accumulate, continue to aim for new ATH💎 Update Plan BTC (July 21)
Notable news about BTC
CEO of Charles Schwab, Rick Wurster, said the company plans to deploy Bitcoin and Ethereum transactions for customers.
This company aims to compete with Coinbase, where customers buy BTC.
This development takes place after the progress of cryptocurrencies when President Donald Trump signs the Genius bill into law.
In an interview on Friday, the CEO of Charles Schwab, Rick Wurster, said the company plans to launch Bitcoin (BTC) and Ethereum (ETH) to compete with Coinbase cryptocurrencies. The move took place after President Donald Trump signed the Genius bill, officially confirming the first cryptocurrency law in the United States.
Technical analysis angle
🟠 Main trend:
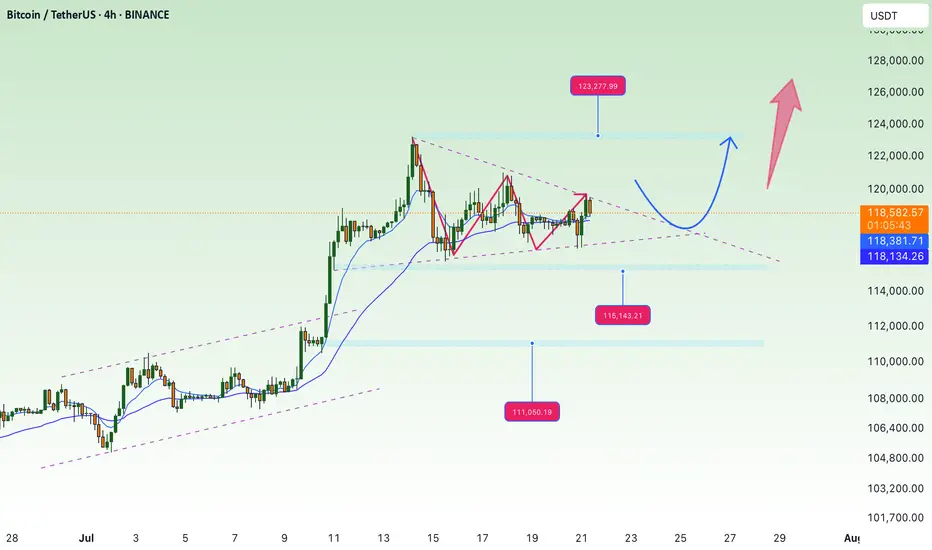
BTC is sideway accumulated in the amplitude of 117,000 - 122,000 after a sharp increase.
The chart shows the descending triangular model - a potential sign for Breakout.
🔍 important areas:
Resist:
122,000 - 122,700: Strong resistance area, fibonacci mold 1.0.
130,600 - 131,100: The expected area if Breakout is successful (Fibonacci extension 1.618).
Support:
116,000: Support close, coincide with EMA 200.
111,100: The support area is stronger if the current support breaks.
✅ Scenario 1 - Rise:
If the price turns from supporting 116k → Test the resistance area of 122k.
If the 122K break is definitive, the next goal is 130k - 131k.
❌ Scenario 2 - Discount:
If the 116k area is lost, the possibility of falling will fall more deeply at 111k.
This is also the strong EMA area Fibo 0.382 of the previous wave.
Please follow the channel to receive the latest and continuous updates on XauUSD, currency and BTC
BTCUPUSDT trade ideas
Bullish Multi-Timeframe Alignment, Macro Risks & Key Levels__________________________________________________________________________________
Technical Overview – Summary Points
__________________________________________________________________________________
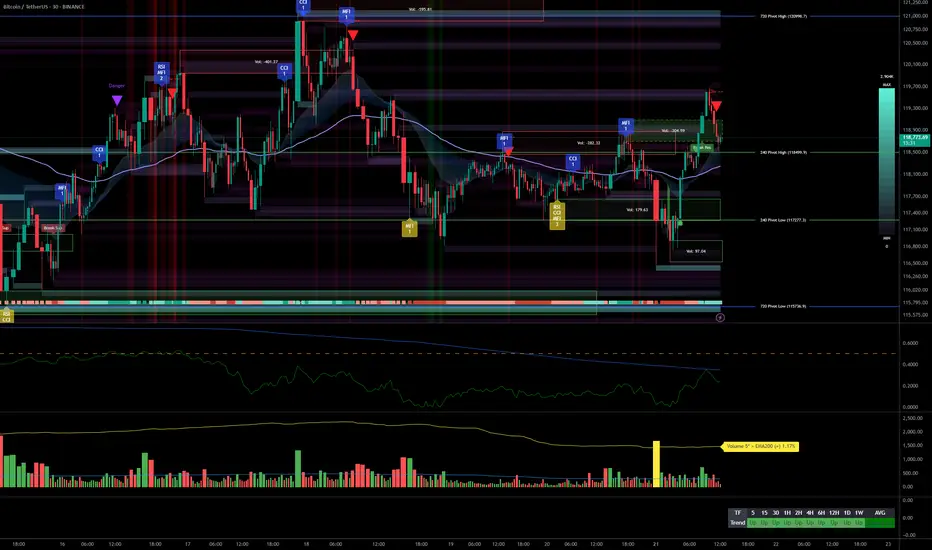
Momentum: Strong bullish trend across all timeframes.
Major Supports: 115796/117277 (720/240 Pivot Low).
Key Resistances: 119000–123200 (240/D Pivot High), watch for potential extension or profit-taking.
Volume: Healthy participation, no marked anomalies.
Risk On / Risk Off Indicator: Strong sector momentum except 15min (neutral), risk appetite confirmed.
Multi-TF Behavior Synthesis: No "behavioral sell" warning, ISPD DIV neutral, no climax.
__________________________________________________________________________________
Strategic Summary
__________________________________________________________________________________
Global Bias: Clearly bullish, all timeframes aligned, no notable technical divergences.
Opportunities: Buy on pullback (HTF support) or on breakout/consolidation above 123200 with increasing bullish volume.
Risk Zones: Drop below 115796 invalidates scenario; watch for “sell” behavioral signals (ISPD red/extreme volumes) or persistent sector divergence.
Macro Catalysts: Next Fed meeting (July 21st), ongoing geopolitical tensions.
Action Plan: Closely monitor supports/resistances, strict stops below 115796, dynamic adjustment to upcoming macro volatility.
__________________________________________________________________________________
Multi-Timeframe Analysis
__________________________________________________________________________________
1D: Bullish breakout, leading tech/growth sector, stable volume.
12H: Bullish signal, price held above all key HTF pivots.
6H: Consolidation below key resistance 123218, no distribution, strength intact.
4H: Sideways just below resistance, controlled pause, possible push upwards.
2H: Stalling under resistance yet bullish momentum still present.
1H: Supports defended, rising volume on rebounds, no excess.
30min: Intraday momentum positive; no signs of reversal, strong indicator consensus.
15min: Testing pivots, slight momentum decline, neutral on Risk On / Risk Off Indicator.
__________________________________________________________________________________
Technical confluence: All timeframes aligned upward, strong sector momentum, controlled volumes, no behavioral excess. Watch for resolution near the 119000–123200 resistance zone (potential supply), and monitor for alert signals on behavioral/volume side. Macro: anticipate volatility around July 21 (Fed).
__________________________________________________________________________________
Macro & Decision Synthesis
__________________________________________________________________________________
News / Macro: Upcoming Fed meeting = caution period, expected volatility spike. Geopolitics: Middle East/Europe tensions, no Asian shock.
On-chain: BTC in price discovery, initial STH profit-taking, everyone in latent profit (interim top risk if overheated, reward up to $130k possible).
Actionable checklist:
Optimal entry: Pullback on 115796–117277 or strong breakout above 123200 with confirmed volume
Stop-loss: Below 115796 (major pivot); intraday swings below 117277
Imperative risk management, avoid leveraged trades ahead of macro event
__________________________________________________________________________________
Final Conclusion
__________________________________________________________________________________
Bitcoin is structurally bullish, supported by perfect multi-timeframe alignment, strong sector leadership (Risk On / Risk Off Indicator), and positive on-chain signals. However, proximity to historical resistances and looming volatility call for strict, active risk management. Targets: $123k/$130k; stops below 115796.
Market overview
WHAT HAPPENED?
Last week, after updating the historical maximum, bitcoin went into correction for the first time, after which it went sideways.
At the moment, the $117,300 – $116,300 zone has been retested (strong absorption of sales) and an active reaction from buyers has been received.
Within the current flat, the cumulative delta supports buyers, indicating the absorption of market sales. At the same time, the global wave structure on the 4H chart casts doubt on the last wave of buys, as we’ve rapidly adjusted back to its beginning.
💼 WHAT WILL HAPPEN: OR NOT?
We expect to exit the sideways at $116,000 – $121,000 in an upward direction from the current levels, either through capturing liquidity and testing the pushing volume zone at $115,000.
The target is the last ATH, which is $123,200. A re-correction is possible near $123,200, resulting in a wider flat range of $123,200 to $115,000. If there is a true breakout, we can expect the continuation of the global long trend.
Buy Zones:
~$115,000 (zone of initiating/pushing volumes)
$110,000–$107,000 (accumulated volume)
📰 IMPORTANT DATES
Macroeconomic events this week:
• Tuesday, July 22, 12:30 (UTC) — speech by Fed Chairman Jerome Powell;
• Wednesday, July 23, 14:00 (UTC) — publication of data on US second-hand housing sales for June;
• Thursday, July 24, 12:15 (UTC) — announcement of the deposit rate for July and the interest rate decision in the Eurozone;
• Thursday, July 24, 12:30 (UTC) — publication of the number of initial applications for unemployment benefits in the United States;
• Thursday, July 24, 12:45 (UTC) — press conference of the European Central Bank;
• Thursday, July 24, 13:45 (UTC) — publication of business activity indices (PMI) in the manufacturing and services sectors of the United States for July;
• Thursday, July 24, 14:00 (UTC) — publication of data on new home sales in the United States for June.
*This post is not a financial recommendation. Make decisions based on your own experience.
#analytics
BTC 4H Structure Break – Long Bias with Conditions🚀 BTC (Bitcoin) has clearly broken bullish market structure on the 4-hour timeframe.
📈 My bias is to ride the momentum and look for a pullback to enter long.
✅ I follow a specific entry criteria — price must pull back into the imbalance, find support, and then form a bullish break of structure on a 15m chart to trigger an entry.
❌ If that setup doesn't play out, we simply abandon the idea.
⚠️ This is not financial advice.

BTC/USDT – Fibonacci Levels in PlayMEXC:BTCUSDT.P
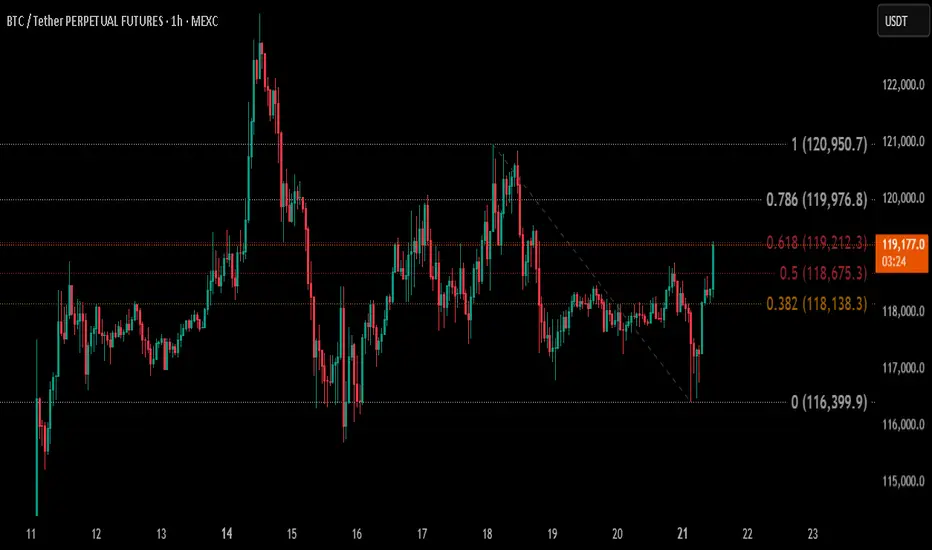
🔹 Price pushing through key resistance zones
BTC just tapped the 0.618 Fibonacci level (119,212) after breaking above 0.5 — signaling strength in short-term momentum. If bulls can hold above this level, the next logical targets are:
➡️ TP1: 119,976 (0.786)
➡️ TP2: 120,950 (Full retracement)
🔸 Key Support: 118,675
🔸 Invalidation below: 118,500
Holding above the golden zone (0.618) increases the probability for a full move toward 121K. Watching price reaction closely here — breakout or rejection will decide the next leg.
🔄 Keep supporting by sharing and dropping your thoughts!
🚀 And don’t forget to hit that Boost button – it helps and motivates me to keep bringing top-level analysis for you all 🙌
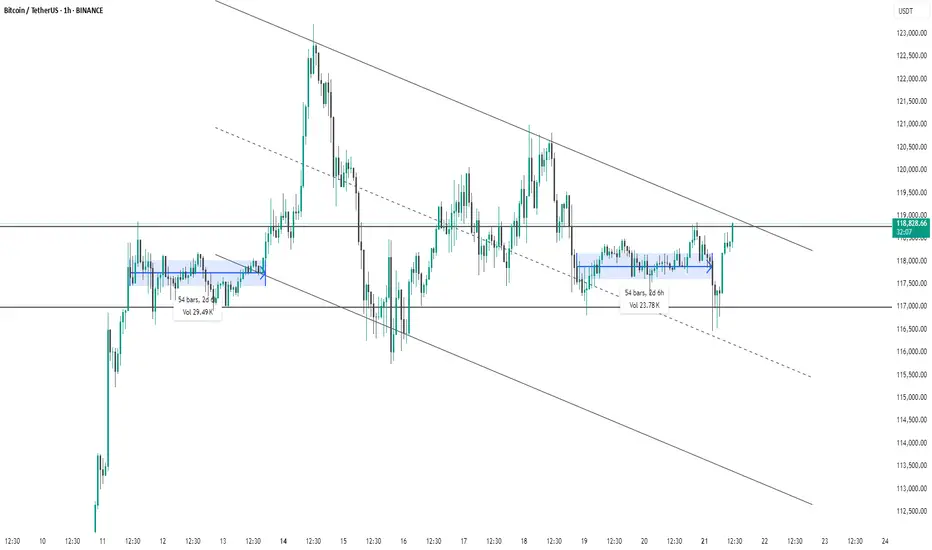
BTC #1-hour chart of Bitcoin/USDTThis 1-hour chart of Bitcoin/USDT (Binance) shows a descending channel pattern with clearly defined upper and lower trendlines. Price has recently broken out of a consolidation zone (highlighted in blue) and is now testing the upper boundary of the descending channel near $119,000. The breakout from the recent range (lasting 54 bars / 2d 6h with 23.78K volume) suggests bullish momentum. However, for confirmation of trend reversal, a strong breakout above the channel is needed. Until then, the broader downtrend structure remains intact.
thanking you
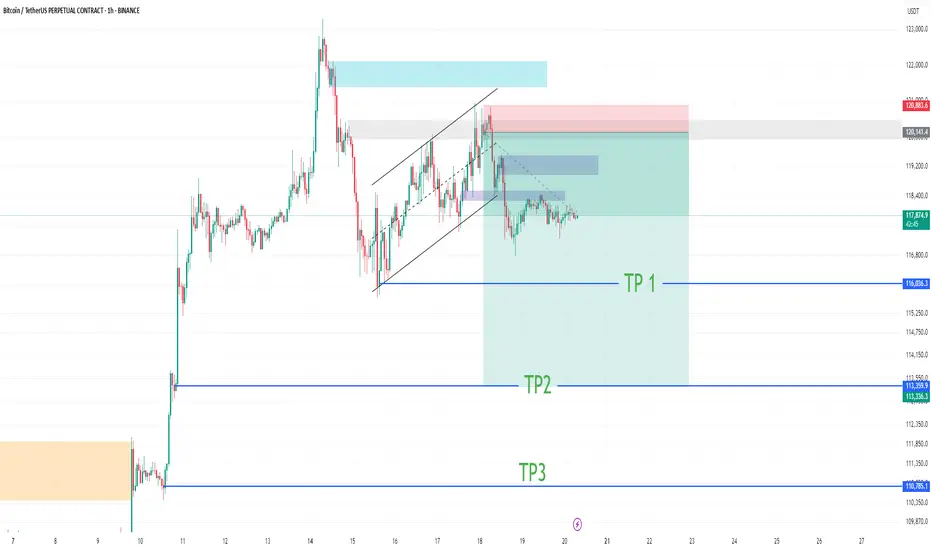
#BTC Update #8 – July 21, 2025#BTC Update #8 – July 21, 2025
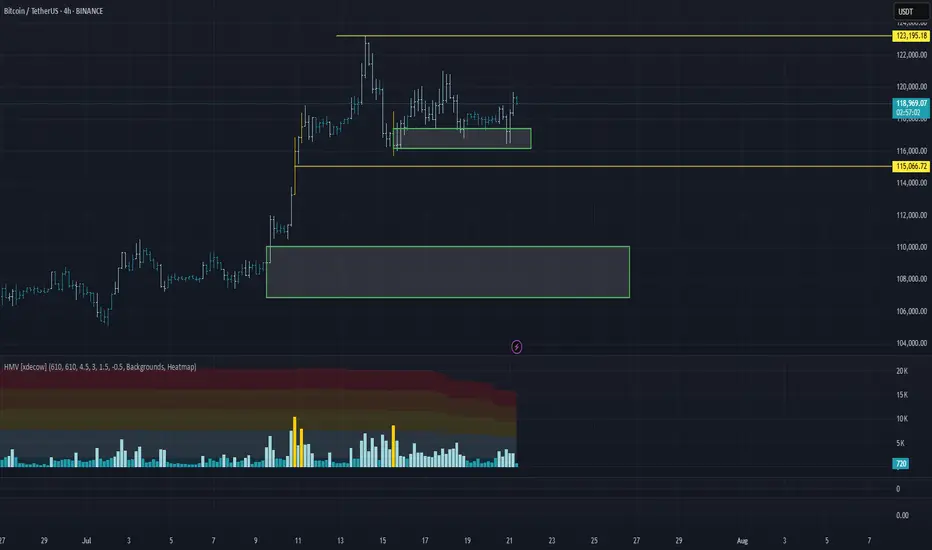
Bitcoin isn’t moving in a textbook symmetrical triangle, but it’s trading in a similar, tight range, mostly bouncing around the highlighted box area in the chart. It’s attempting a new impulsive leg, but $120,000 remains a key resistance level, having rejected price several times already.
As long as $116,500 holds, there's no major risk for Long bias. However, considering the triangle-like structure, the short-term upside is limited to about 2% for now.
A breakout above the upper edge of this structure, particularly if $123,200 is broken with strong volume — would justify a Long position. Until then, I don’t plan on entering any trades.
The last corrective move has completed, and my next major upside target is $127,900. If further correction occurs, watch for potential support around $115,000, $113,000, and the strong base at $112,000 — though I don’t expect price to fall that low.

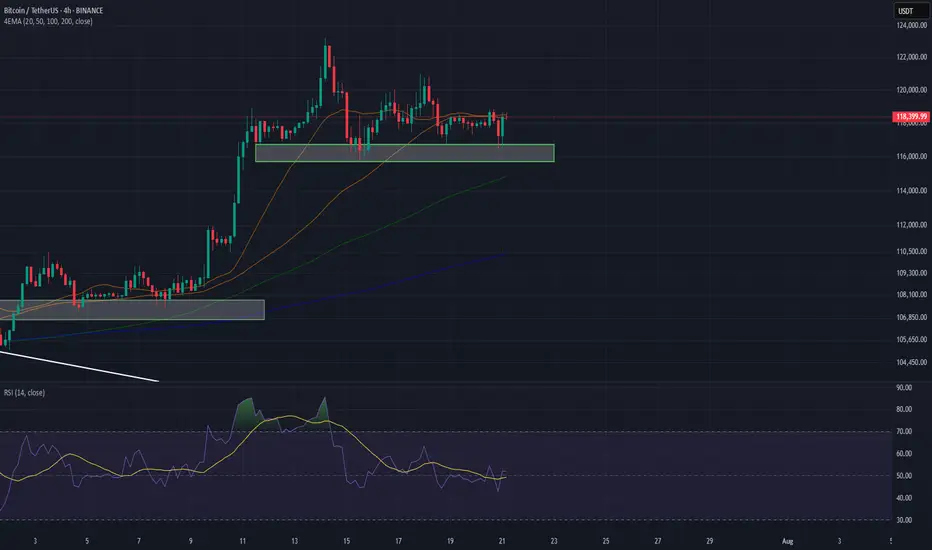
Bitcoin Technical AnalysisBTC made a recorded high of 123,218$ on Monday, and made a correction to 116k$ and keep consolidate in the range of 116k$-120k$, at the time of writing this bitcoin is currently trading at 118,224k$.
116k$-117k$ reacting as a strong support zone, if BTC breakdown this support zone the next target of bears is 112k$-110k$.
The Relative Strength Index (RSI) on the daily chart currently reads 64, having declined from last week's overbought level of 70. This suggests a cooling in bullish momentum, potentially signaling a pause or reversal in the recent upward trend.
Meanwhile, the Moving Average Convergence Divergence (MACD) is on the verge of forming a bearish crossover on the daily chart. If confirmed, this crossover would act as a sell signal, reinforcing the view of emerging bearish momentum.
However, if BTC closes above the $120,000 on a daily basis, it could extend the recovery toward the fresh all-time high at $123,218 and beyond.
BTC ~ 125K when?BTC made this strong hold the green box, Please keep in mind this if it holds, goes straight up and we plan shorts on the top as scalps!

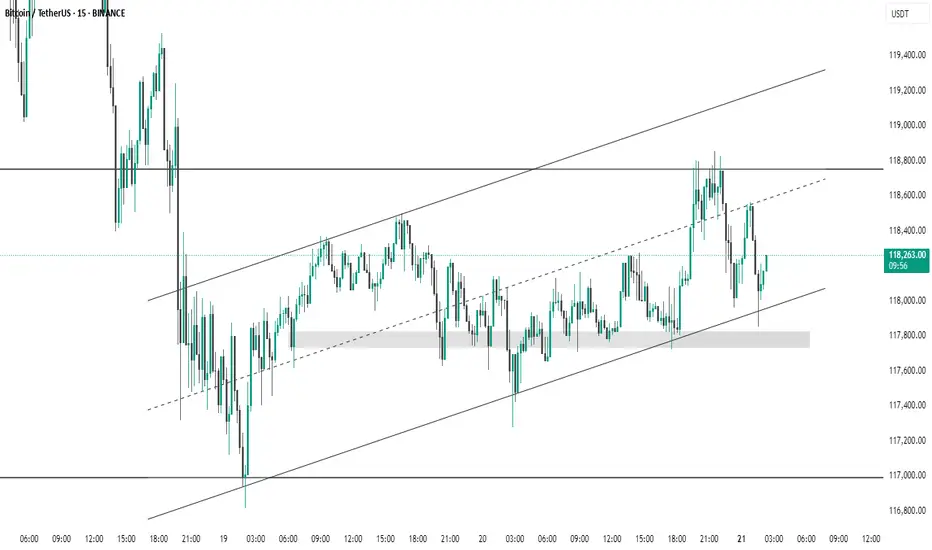
BTC #15-minute BTC/USDT chart This 15-minute BTC/USDT chart from Binance shows Bitcoin trading within an ascending channel. Price recently bounced off the lower trendline and a highlighted demand zone around 117,800 USDT, suggesting strong support. The upper channel and resistance near 118,800 USDT may act as potential targets. Short-term momentum appears bullish as long as price holds above the support trendline.
BTCUSDTBTCUSDT Updated in H1 :
The gold signal is marked on the chart based on the latest price changes and the supply and demand in the market. These points include the entry point, stop loss, and take profit

Bitcoin: Promising Patterns and Potential BreakoutBitcoin's recent price action has been nothing short of captivating for traders and analysts alike. On the daily chart, we've observed the formation of an Inverse Head & Shoulders and a Cup & Handle pattern, both of which have now transitioned into a Bull Flag. These bullish signals suggest a strong potential for upward movement.
Zooming into the 4-hour and 1-hour charts, we can see prominent Ascending Triangles taking shape. These patterns are often harbingers of significant breakouts, and it appears that Bitcoin is winding up for a substantial move.
Moreover, when utilizing a Trend-based Fibonacci Extension on the daily timeframe, the golden pocket points to a target of $126k, with the next pocket at $185k. This aligns with historical data and technical indicators, suggesting that Bitcoin might be poised to rewrite history once again.
Stay tuned as we monitor these developments and anticipate what could be a historic breakout for Bitcoin!

Btcusd trade ideaWen those candles moves like that they just wanna fill those imbalances on htf and use the opportunity to grab fuel for the next move, no cause for alarm just my pov tho

BTCUSD SHORT POSITION = SELLWe can see that BTCUSD consolidated a and ended up given us a possible sell.
To my point of view, we can take a sell position at an Entry = 117878.44 with a proper calculated risk of a SL = 118285.00.
With this short position we can expect to take our profits at the following zones:
TP1: 117509.65
TP2: 117386.65
TP3: 117267.62
TP4: 117066.41
The takes profits are a calculated Risk Reward Ratio of 1.00 to 2.00
It is advisable to use a small lot size or according to your account

BTC - Ranges overview (update) BTC has been moving nicely lately so let's see where we go from here.
As previously mentioned, we should expect an aggressive move upwards towards 110K and eventually new ATH. As expected we got the move and are now trading around 120K.
IF we fail to hold the sellside at 115K expect us to trade back towards 110K.
IF we hold our current levels expect further upside towards new ATH.
No NEED TO FRONTRUN THE MARKET. BE PATIENT AND TRADE WITH IT.
Stay safe and never risk more than 1-5% of your capital per trade. The following analysis is merely a price action based analysis and does not constitute financial advice in any form.
BTC ShortI think Bitcoin will experience a small correction and then return to the uptrend.
Maybe Bitcoin will achieve the third target.
Entering Green Markets or Getting Close to Liquidation?They told you it’s a green market, time to buy... but something’s off.
Most major losses begin with a green candle, not a red one!
Before jumping in, ask yourself: why does everything suddenly look so clear?
Hello✌
Spend 3 minutes ⏰ reading this educational material.
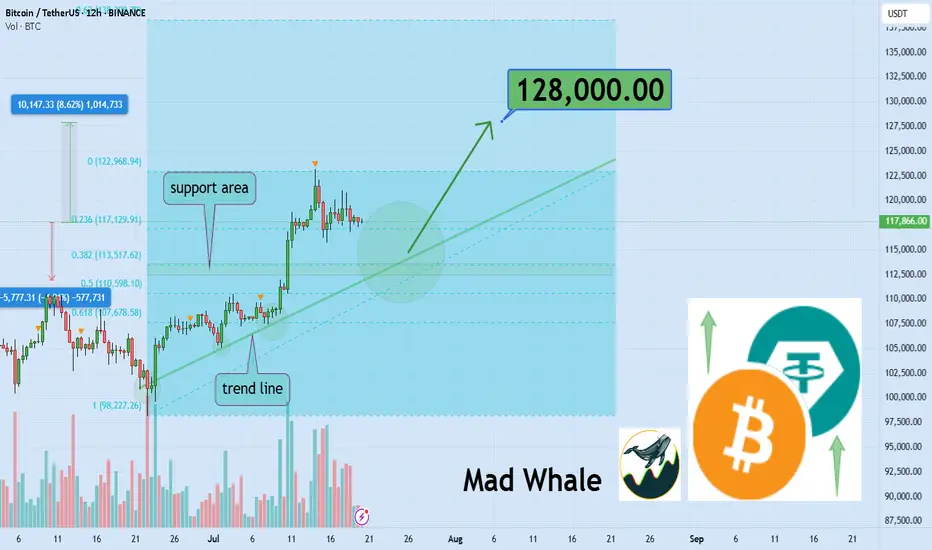
🎯 Analytical Insight on Bitcoin:
Strong volume confirming daily trendline and Fibonacci support signals a potential 8% upside, with a key target near $128,000 📈. This confluence could offer a solid entry opportunity for BINANCE:BTCUSDT traders 🧭.
Now , let's dive into the educational section,
📉 Green Doesn’t Always Mean Safe
Many traders jump into green candles, feeling they’re missing out. But most pumps end where excitement begins. The market isn’t always bullish it’s often just using collective emotion against you.
🧠 They’re Targeting Your Mind, Not Just Your Capital
Whales don’t need your money they need your mind first. The moment you think you're "too late" and must enter now, is often when they’re selling.
💡 You’re Fueling Their Profits, Not Your Trade
Those who bought early are waiting for someone like you. If you enter now, you're not beating the market you’re just helping others close in profit.
🔍 Why Most Liquidations Happen After Green Moves
Contrary to belief, major liquidations often come after green runs. That’s when confidence is high, stops are forgotten, and greed kicks in perfect timing for a rug-pull.
📊 History Doesn’t Repeat It Rhymes (Loudly)
Go back and look at Bitcoin’s chart since 2017. Nearly every major drop followed a smooth-looking pump. It’s not a warning. It’s a recurring pattern.
🎯 Hidden TradingView Tools for Spotting Green Traps
The market looks bullish. But the truth is, many pumps are just emotional traps built to bait late entries. TradingView has tools that, if used right, help you spot these traps before you step into them:
✅ Volume Profile (Fixed Range):
Use this to identify where the most trading volume occurred. If price rises on weak volume, be suspicious. It could be a fakeout or engineered pump by whales.
✅ RSI + Manual Divergence Drawing:
RSI seems simple, but traps often hide when RSI climbs while price action lags. TradingView allows manual drawing spot bearish divergence before the fall.
✅ On-Balance Volume (OBV):
If price is rising and OBV is flat or falling, warning lights should flash. A rally without money inflow is often a visual illusion.
✅ Session Volume HD (from Public Library):
See when most liquidity enters. Many fake bullish moves happen during the Asia session when volume is low and price is easier to manipulate.
✅ Multi-Timeframe Analysis:
If you're looking at the 15-min chart while the 4-hour sits in resistance, you may just be playing into a bull trap. Cross-reference your timeframes.
🧭 How to Avoid the Green Traps
Watch volume, not just candle color
Wait for level confirmations, not hype
Use TradingView’s combo indicators
Always ask: who profits if I enter right now?
✅ Final Thoughts
Not every green candle is hope sometimes it’s bait. The market is after your emotions, not your charts. Step back, zoom out, and use the right tools before you act.
✨ Need a little love!
We pour love into every post your support keeps us inspired! 💛 Don’t be shy, we’d love to hear from you on comments. Big thanks , Mad Whale 🐋
📜Please make sure to do your own research before investing, and review the disclaimer provided at the end of each post.
Bitcoin is still bullish (4H)Bitcoin appears to be in a dual bullish structure, currently in the second bullish phase following wave X.
Considering the expansive nature of the correction in the second pattern, it seems we are within an expanding triangle or a diametric structure.
Based on the duration of wave C, it appears that the bullish wave of the second structure is not yet complete.
We expect such fluctuations for Bitcoin in the coming period.
A daily candle close below the invalidation level would invalidate this outlook.
For risk management, please don't forget stop loss and capital management
Comment if you have any questions
Thank You

BTC #Bitcoin (BTC/USDT) on the 1-hour timeframeThis chart shows Bitcoin (BTC/USDT) on the 1-hour timeframe, highlighting two periods of sideways consolidation (marked in blue).
Both zones lasted 64 bars (2d 16h), indicating similar market indecision or accumulation/distribution phases.
The first consolidation (left) was followed by a strong bullish breakout, while the second (right) is currently unresolved.
Price is trading within a tight range between ~117,600 and ~118,400 USDT, suggesting potential for an imminent breakout or breakdown.
Volume during the current consolidation is lower than the previous one, hinting at reduced momentum.
This setup may signal a key move once the price exits this range.
thanking you

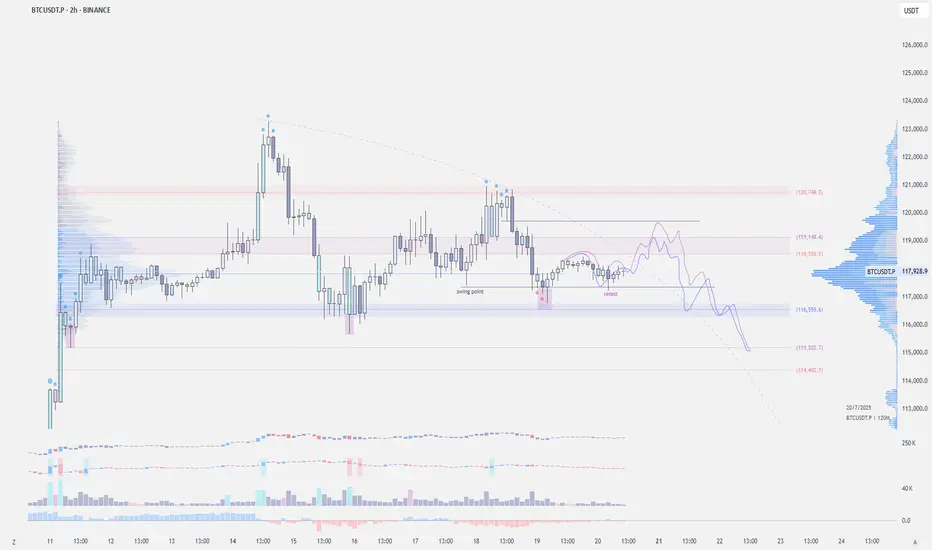
Bitcoin price analysisPossible LTF setup:
We got the 2h swing point retest. If base support holds, I’m looking for a potential move back to 119k — possibly even a gap fill to 119.7k before taking out the local lows.

Buy Signal at 117k, Eyeing 118.5k BreakoutDescription:
Bitcoin is consolidating just above the 200 EMA on the 1H timeframe, forming a slight ascending triangle. A buy around 117,000 with TP set at 118,421. With RSI near neutral and QQE MOD potentially flipping bullish, we are watching for a breakout above 118,500 for continuation. SL sits below the recent swing low at 116,485.
Trade Setup
Long Entry: 117,000 (as signaled)
Take Profit: 118,421 or higher (watch 118,800 zone)
Stop Loss: 116,485
Alternate Trigger: Break and close above 118,500 with increased volume = breakout entry
Invalidation:
A break below 116,400 (below SL zone and 200 EMA) could invalidate the bullish thesis and open downside toward 114,000.
Confirmation to Watch
Breakout candle above the 50 EMA with volume spike
QQE MOD crossover with histogram flipping blue
RSI moving above 50 confirming strength

$BTC - Weekend LTF SetupCRYPTOCAP:BTC | 2h
Possible LTF setup:
We got the 2h swing point retest. If base support holds, I’m looking for a potential move back to 119k — possibly even a gap fill to 119.7k before taking out the local lows.
BTC/USDT – 4H Chart Technical AnalysisBTC/USDT – 4H Chart Technical Analysis
Market Structure & Trend
Overall Trend : Bearish (clearly defined by a consistent downtrend channel).
Current Structure : Price is in a corrective downtrend within a descending channel, after multiple rejections from the supply zone.
Key Technical Zones
1. Supply Zone
Strong rejection zone where the price previously reversed sharply.
Still acting as resistance, located around the upper range.
2. Demand Zone
Currently being retested for the fifth time, weakening its strength.
Recent price action shows liquidity sweep and swing low break inside this zone, potentially trapping early longs.
Fair Value Gaps (FVG) & Fibonacci Levels
1D FVG sits below the current demand, aligning with:
Golden Pocket (0.618–0.65 Fib).
Acts as a high-probability bounce zone for long entries if demand fails.
A break below this FVG could open up deeper downside toward the 0.786 Fib or beyond.
Psychological Levels
105,000 – Major resistance & potential take-profit area for long positions.
100,000 – Key support and liquidity magnet if the demand zone fails.
Volume Profile
High Volume Node: 102,000 – 106,800 — price tends to gravitate here, indicating potential consolidation or resistance.
Low Volume Area: Below 100,500 — suggests thin liquidity, which may cause sharp moves if price drops into this range.
Scenarios & Trade Ideas
Bullish Scenario
If price holds above the demand zone (after multiple retests) and confirms on LTF:
Potential Long to local resistance.
On breakout, target the 105,000 psychological level.
Confluence: High volume area offers both support and a magnet.
Bearish Scenario
If price fails to hold the demand zone:
Enter short position targeting the 1D FVG and 100,000 psychological level.
If that breaks, expect sharp continuation due to low volume below.
Conclusion
Price is at a pivotal point — currently balancing on weakened demand after multiple retests. Watch for LTF confirmation:
Above demand = bullish recovery setup.
Below demand = bearish continuation toward 100,000 and the FVG.
Manage risk tightly due to the proximity of both key zones.
