Bitcoin is still bullish (4H)Bitcoin appears to be in a dual bullish structure, currently in the second bullish phase following wave X.
Considering the expansive nature of the correction in the second pattern, it seems we are within an expanding triangle or a diametric structure.
Based on the duration of wave C, it appears that the bullish wave of the second structure is not yet complete.
We expect such fluctuations for Bitcoin in the coming period.
A daily candle close below the invalidation level would invalidate this outlook.
For risk management, please don't forget stop loss and capital management
Comment if you have any questions
Thank You
BTCUPUSDT trade ideas

BTC #Bitcoin (BTC/USDT) on the 1-hour timeframeThis chart shows Bitcoin (BTC/USDT) on the 1-hour timeframe, highlighting two periods of sideways consolidation (marked in blue).
Both zones lasted 64 bars (2d 16h), indicating similar market indecision or accumulation/distribution phases.
The first consolidation (left) was followed by a strong bullish breakout, while the second (right) is currently unresolved.
Price is trading within a tight range between ~117,600 and ~118,400 USDT, suggesting potential for an imminent breakout or breakdown.
Volume during the current consolidation is lower than the previous one, hinting at reduced momentum.
This setup may signal a key move once the price exits this range.
thanking you

Bitcoin price analysisPossible LTF setup:
We got the 2h swing point retest. If base support holds, I’m looking for a potential move back to 119k — possibly even a gap fill to 119.7k before taking out the local lows.

Buy Signal at 117k, Eyeing 118.5k BreakoutDescription:
Bitcoin is consolidating just above the 200 EMA on the 1H timeframe, forming a slight ascending triangle. A buy around 117,000 with TP set at 118,421. With RSI near neutral and QQE MOD potentially flipping bullish, we are watching for a breakout above 118,500 for continuation. SL sits below the recent swing low at 116,485.
Trade Setup
Long Entry: 117,000 (as signaled)
Take Profit: 118,421 or higher (watch 118,800 zone)
Stop Loss: 116,485
Alternate Trigger: Break and close above 118,500 with increased volume = breakout entry
Invalidation:
A break below 116,400 (below SL zone and 200 EMA) could invalidate the bullish thesis and open downside toward 114,000.
Confirmation to Watch
Breakout candle above the 50 EMA with volume spike
QQE MOD crossover with histogram flipping blue
RSI moving above 50 confirming strength

$BTC - Weekend LTF SetupCRYPTOCAP:BTC | 2h
Possible LTF setup:
We got the 2h swing point retest. If base support holds, I’m looking for a potential move back to 119k — possibly even a gap fill to 119.7k before taking out the local lows.
BTC/USDT – 4H Chart Technical AnalysisBTC/USDT – 4H Chart Technical Analysis
Market Structure & Trend
Overall Trend : Bearish (clearly defined by a consistent downtrend channel).
Current Structure : Price is in a corrective downtrend within a descending channel, after multiple rejections from the supply zone.
Key Technical Zones
1. Supply Zone
Strong rejection zone where the price previously reversed sharply.
Still acting as resistance, located around the upper range.
2. Demand Zone
Currently being retested for the fifth time, weakening its strength.
Recent price action shows liquidity sweep and swing low break inside this zone, potentially trapping early longs.
Fair Value Gaps (FVG) & Fibonacci Levels
1D FVG sits below the current demand, aligning with:
Golden Pocket (0.618–0.65 Fib).
Acts as a high-probability bounce zone for long entries if demand fails.
A break below this FVG could open up deeper downside toward the 0.786 Fib or beyond.
Psychological Levels
105,000 – Major resistance & potential take-profit area for long positions.
100,000 – Key support and liquidity magnet if the demand zone fails.
Volume Profile
High Volume Node: 102,000 – 106,800 — price tends to gravitate here, indicating potential consolidation or resistance.
Low Volume Area: Below 100,500 — suggests thin liquidity, which may cause sharp moves if price drops into this range.
Scenarios & Trade Ideas
Bullish Scenario
If price holds above the demand zone (after multiple retests) and confirms on LTF:
Potential Long to local resistance.
On breakout, target the 105,000 psychological level.
Confluence: High volume area offers both support and a magnet.
Bearish Scenario
If price fails to hold the demand zone:
Enter short position targeting the 1D FVG and 100,000 psychological level.
If that breaks, expect sharp continuation due to low volume below.
Conclusion
Price is at a pivotal point — currently balancing on weakened demand after multiple retests. Watch for LTF confirmation:
Above demand = bullish recovery setup.
Below demand = bearish continuation toward 100,000 and the FVG.
Manage risk tightly due to the proximity of both key zones.

BTC/USD Fake out before Pump | Bullish Flag formationBTC/USDT (1D) Market Outlook – July 1, 2025
Introduction
BTC is currently consolidating within a bullish flag pattern after printing a swing high at 108.9K and a recent swing low at 98K. The price sits just below a major supply zone.
Context 1: Key Zones
Supply: 104.6K – 112.1K
Demand: 74.4K – 82.5K
Fair Value Gaps (FVG): 3 zones below price, with one near 88–90K
Context 2: Technical Confluence
Liquidation Zone: 106.2K
Golden Pocket (Fib 0.618): 102.1K
Psychological Levels: 105K and 110K
Context 3: Market Structure
Pattern: Bullish flag
Trend (LTF): Sideways/consolidation
Volume Profile: Heavy activity near 105K–110K
Bullish Scenario
Breaks above 106.2K (liq zone)
Pulls back to 102.1K (golden pocket), forms higher low
Retests resistance for continuation
Alt scenario: clean breakout above resistance → ATH retest
Bearish Scenario
Breaks below 106.2K and flag support
Fills FVG, breaks prior low at 98K
Triggers macro downtrend toward 88–90K zone
Summary
BTC is at a decision point inside a bullish flag, facing supply. A break above 106.2K favors upside continuation, while rejection and a lower low could trigger a deeper retracement. Watch key levels closely.

Bitcoin's Critical Zone: Breakout or Breakdown?
✨ Stay ahead of the market — follow for daily crypto insights & smart analysis.
🧠 Think smart. Trade smart.
🚀 Tap the rocket if you're ready for liftoff!
🔍 Bitcoin Analysis (BTC)
📌 Scenario 1:
For BTC to break above 122 this time, it’ll need a real whale push. There are still many micro sellers at that level, and a slow, gradual move like yesterday likely won’t work.
Since buyers already spent their dry powder, they might not have enough left to defend 110 if price gets rejected again.
📌 Scenario 2:
But if price doesn’t attempt 122 again from here, we probably won’t see the 110 bottom either — simply because buyers haven’t deployed capital yet and may be waiting for entries around 115. That forms a potential range between 115 and 122.
🕰️ Daily timeframe:
Market is resting for now.
🎯 Entry trigger: 120.35
If price struggles at this level and BTC dominance isn't strong, we’ll likely shift attention to altcoins.
If BTC gets rejected at 122 and dominance turns red, again — alts may outperform.
💡 Current BTC & ETH positions remain open. No interest in shorts.
As long as we stay above 115, the focus remains on alt/BTC pairs during dips.
📊 TOTAL Market Cap:
🟡 Although we moved above 3.78 yesterday, we don’t call that a breakout — unless price moves away from the level significantly. Right now, it’s still struggling near resistance.
Next key level to watch for a true breakout: 3.91
This is the same region BTC needs a whale to push through.
📈 TOTAL2 – Entry Trigger: 1.05
If any altcoin shows strong momentum and volume before this level breaks (⚠️ low weekend volume is expected), we can consider that a signal.
On Saturdays, volume confirmation is tricky, so we may take small breakout trades using only 0.25% of capital, with fewer positions.
💠 OTHERS.D:
If BTC dominance drops, BTC ranges, and OTHERS.D rises ⬆️
➡️ It suggests that non-top-10 coins are starting to move.
That’s when we should analyze dominance of each top 10 coin individually.
🎯 Entry trigger: 7.80
💵 USDT.D:
No clean level for now, but keep an eye on 3.80 going forward.
🌐 ETH/BTC:
Still bullish, showing no signs of pullback. Price continues to push up.
✨ Stay ahead of the market — follow for daily crypto insights & smart analysis.
🧠 Think smart. Trade smart.
🚀 Tap the rocket if you're ready for liftoff!
BTCUSDT Short Swing TradeBINANCE:BTCUSDT Short Swing Trade, with my back testing of this strategy, it hits multiple possible take profits, manage your position accordingly.
This is good trade, don't overload your risk like greedy, be disciplined trader.
I manage trade on daily basis.
Use proper risk management
Looks like good trade.
Lets monitor.
Use proper risk management.
Disclaimer: only idea, not advice

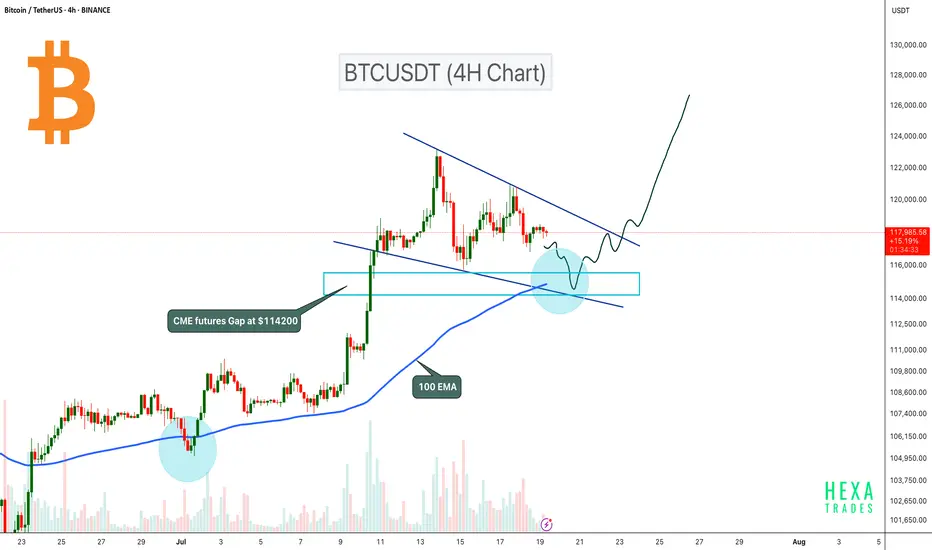
BTC Pullback Expected to $114K Before Next Leg Up!Bitcoin is currently consolidating inside a bullish flag pattern on the 4H timeframe. The price could retest the flag support, where the 100 EMA will act as dynamic support. Additionally, there is a CME futures gap at the $114,200 level, which also aligns with the 0.5 Fibonacci retracement level. Therefore, a retest to the $114,200 zone is likely before the next potential upward move.
A potential bullish reversal could occur if BTC retests this zone and confirms a bounce. A breakout from the bullish flag pattern could signal the next leg up.
Cheers
Hexa🧘♀️
BITSTAMP:BTCUSD CRYPTOCAP:BTC
BTC/USDT 5H – Demand Zone Bounce Targeting $123KBTC/USDT 5H Analysis:
Price is consolidating above a demand zone ($121,031), with a final target around $123,280.


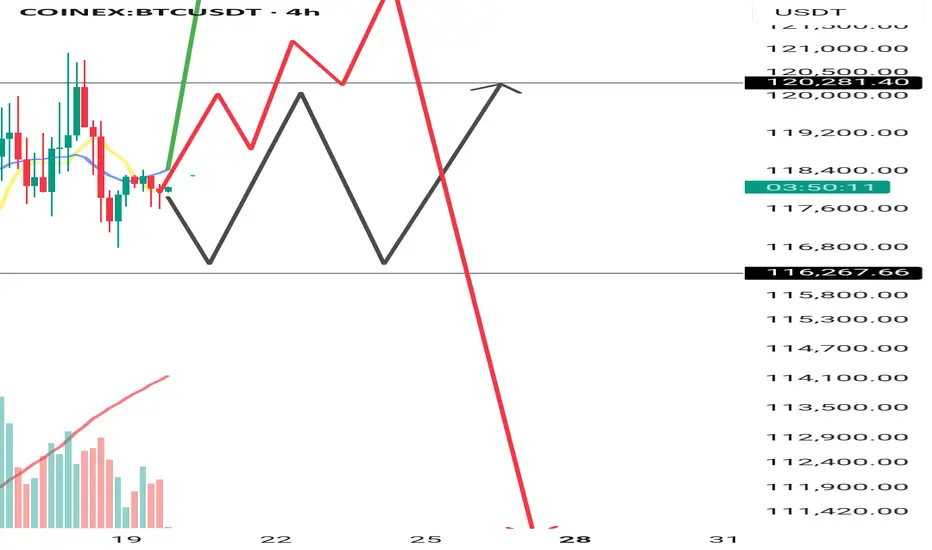
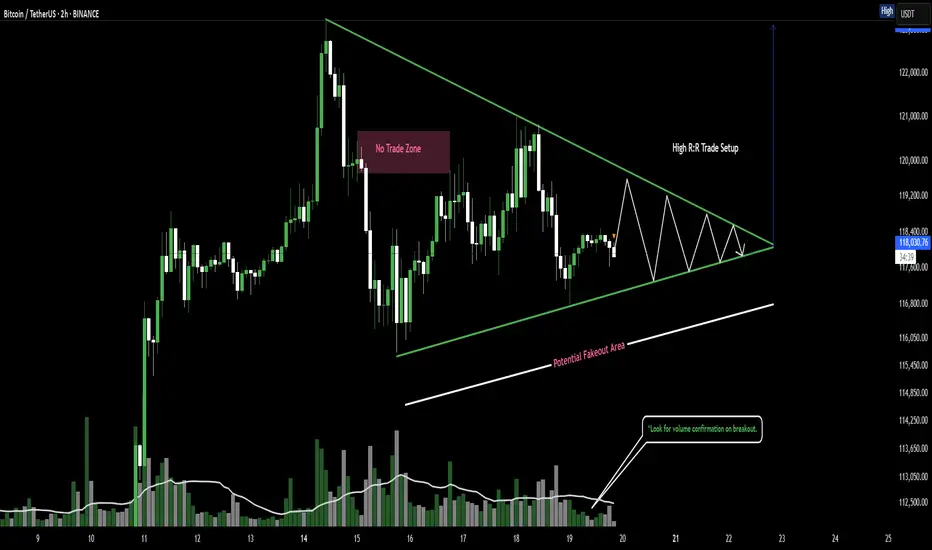
Bitcoin Technical Outlook -2HA symmetrical triangle is forming with declining volume — signaling a likely breakout.
🔼 Break above ~$119.5K → Target: $123K
🔽 Break below ~$116K → Target: $113.5K
⚠️ Await confirmation before entering. Risk management is key.
Bitcoin (BTC/USDT) Technical Outlook – 2H Chart
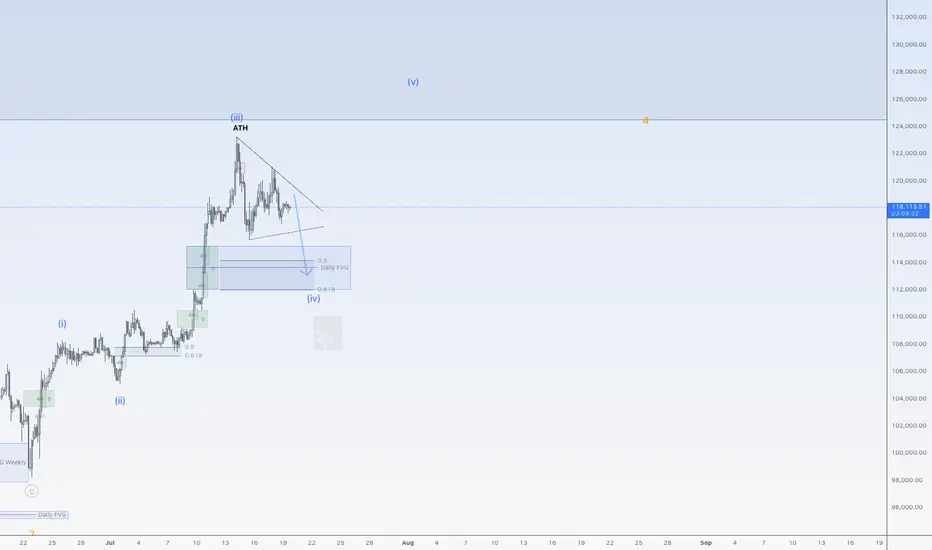
Correction down for BitcoinHi traders,
Last week Bitcoin made a small correction down and up again to finish wave 3 (blue).
After that it started a bigger correction down for wave 4 (blue). This could be a Triangle (no break of previous low) or Zigzag (break of previous low into the bullish Daily FVG).
After the finish of the correction down we could see more upside again.
Let's see what the market does and react.
Trade idea: Wait for the correction down to finish.
Then after an impulse wave up, a small correction down on a lower timeframe and a change in orderflow to bullish you could trade longs.
If you want to learn more about trading FVG's with wave analysis, please make sure to follow me.
This shared post is only my point of view on what could be the next move in this pair based on my analysis.
Don't be emotional, just trade your plan!
Eduwave
BTCUSDTHello Traders! 👋
What are your thoughts on BITCOIN?
Bitcoin has recently posted a new all-time high and is now undergoing a healthy correction. This pullback is expected to extend toward a key support zone, which aligns with both the previous breakout level and the bottom of the ascending channel.
Once the correction is completed near the channel support / previous high, we anticipate a bullish continuation.
The next leg higher could take Bitcoin toward the upper boundary of the current channel.
As long as price remains above the key support area, the overall structure stays bullish and this correction is likely to be a buy-the-dip opportunity within a broader uptrend.
Will Bitcoin use this pullback as a launchpad for new highs? Share your view in the comments! 🤔👇
Don’t forget to like and share your thoughts in the comments! ❤️

BITCOIN's Situation (1h) !!!The price is within an ascending triangle, which could be encouraging. However, since crypto doesn't always follow patterns, it might break down from below and correct to around $115K!
Best regards CobraVanguard.💚

Drop Your Token – I’ll Do The AnalysisHey everyone! Hope you’re having an amazing weekend !
Want me to analyze your favorite token ? Just drop your request in the comments using this format:
Request Format
Project Name: Bitcoin
Token Symbol: BTC( BINANCE:BTCUSDT )
Important Notes:
I’ll pick and analyze only the first 10 tokens requested .
One request per person — so choose wisely!
I’ll reply directly under your comment with the analysis.
If you find this helpful, don’t forget to Like ❤️ and Share this post with your friends!
Here’s to your success — health, wealth, and great trades! 🚀

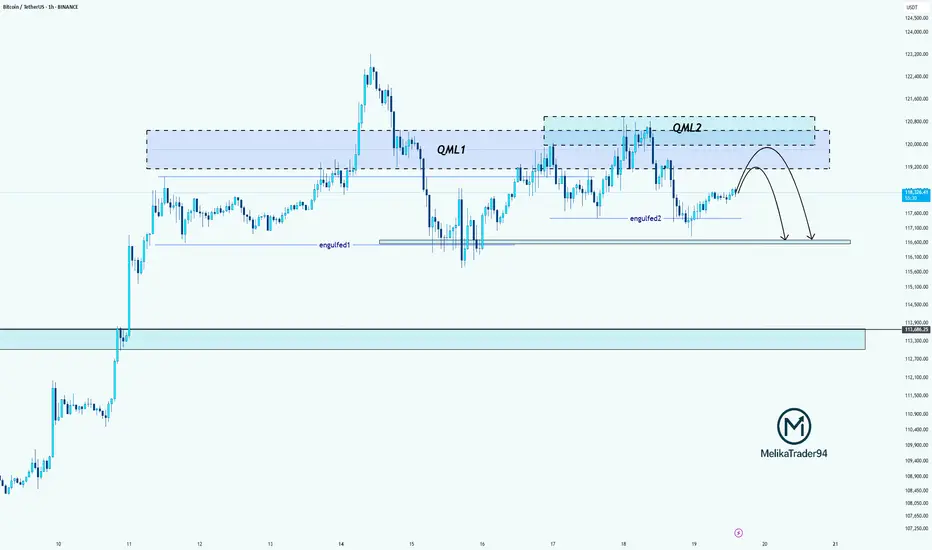
BTC Double QML Setup: Is Another Drop Loading?Hello guys!
Do you remember the last analysis?
Now this BTC chart shows a textbook example of two consecutive QML (Quasimodo Level) patterns forming (QML1 and QML2), each confirmed by clean engulfed lows.
QML1 caused a strong drop after the high was broken and a new low formed.
Price retraced and created QML2, again with a confirmed engulfed low (engulfed2).
We're now likely to see a reaction at the QML2 supply zone.
If price respects this second QML zone, we could see another bearish move toward the 116k zone, possibly lower.
Bitcoin at 120,000: Decisive Breakout or Renewed Consolidation?__________________________________________________________________________________
Technical Overview – Summary Points
__________________________________________________________________________________
Momentum: Strongly bullish on H1 and above; healthy consolidation below ATH.
Supports/Resistances: 120,000 USDT (pivot resistance), 116,400–117,000 (major support), 104,000–110,000 (long-term support).
Volumes: Normal, no anomaly nor climax detected.
Risk On / Risk Off Indicator: Strong buy signal on all timeframes except very short term. Sectoral health confirmed.
Multi-timeframe: Short-term bearish divergence on 15/30min, but robust technical structure above H1-D1.
__________________________________________________________________________________
Strategic Summary
__________________________________________________________________________________
Global bias: Confirmed bullish across all timeframes; no major break detected.
Opportunities: Strategic buys between 116,400–117,000 (pullback); confirmed breakout above 120,000 (target 130,000).
Risk zones: Below 116,000 (potential correction to 112,000–104,000), false breakout at the top.
Macro catalysts: Monitor Fed (next FOMC July 29-30), volatility on risk assets, geopolitical tensions.
Action plan: Prioritize stop management, stay reactive ahead of macro events. Main scenario: buy confirmed pullback or validated breakout.
__________________________________________________________________________________
Multi-Timeframe Analysis
__________________________________________________________________________________
1D / 12H: Bullish structure intact but facing historical resistance (120k), strong supports in place (104–107k).
6H / 4H / 2H: Consolidation below resistance, no signs of exhaustion, tactical supports at 116,000–117,000.
1H / 30min / 15min: Weakness on shorter timeframes (sellers at top), confirmation of range polarization. No emotional excesses (ISPD DIV neutral), standard volumes.
Risk On / Risk Off Indicator: Strong buy except for very short-term fatigue.
Summary:
Multi-horizon bullish bias, technical and sectoral confluence for upside extension if clear breakout >120,000. Key support to hold at 116,400–117,000. Buy dips, ride breakout up to 130,000. Focus on risk management, flexibility advised as macro (Fed) nears.
__________________________________________________________________________________
Key macro events to watch
__________________________________________________________________________________
2025-07-18: Fed rate/volatility debate (Equity, Bonds, BTC).
2025-07-29: FOMC (potential pivot for risk assets).
__________________________________________________________________________________
Strategic decision & final summary
__________________________________________________________________________________
Main bias: Bullish, to be validated at key levels, favor buying dips/breakouts.
Risk management: Stop below 116,000, scale out progressively after 125k, reinforced protection ahead of FOMC.
Opportunities: Pullback 116,400–117,000 (RR >3); H4/D breakout >120,000 targeting 130,000 (RR >2).
Monitoring: Macro (Fed, geopolitics), dynamic management according to market response to news.
Conclusion:
A validated move above 120,000 projects target to 130,000 (next statistical/on-chain extension). Deep dips can be bought above 104,000. Do not loosen risk management as Fed date approaches.

BTC/USDT: Define Your Next Winning MoveHere's the reality: While others panic and second-guess, successful traders recognize the blueprint when they see it.
The Setup That Separates Winners From Losers
Two major support zones (marked in blue) tell the complete story. My footprint CDV analysis confirms what institutional money already knows - these levels aren't suggestions, they're battle lines.
Your Proven Path Forward
Zone 1: Primary accumulation target - where smart money loads up
Zone 2: Final defense line - where rebounds launch
The Choice Is Simple
Execute at these levels with precision, or watch from the sidelines as others capitalize. My track record speaks for itself - these aren't hope-based predictions, they're data-driven opportunities.
What Happens Next
Follow this blueprint: You position at support, manage risk precisely, and capture the inevitable bounce that follows institutional accumulation.
Ignore it: Watch others profit while you chase price higher later.
Bottom Line
The market has drawn the map. The footprint data confirms the plan. Your success depends on one thing: execution when opportunity knocks.
The zones are marked. The analysis is complete. The choice is yours.

BTCUSD LongThe analysis is given on the chart! I'm back on the charts after 9 months i guess. Would learn back again for the next 6 months and come back like an OG profitable trader.
In God we trust ~ Amen.
THIS IS NOT A FINANCIAL ADVICE.

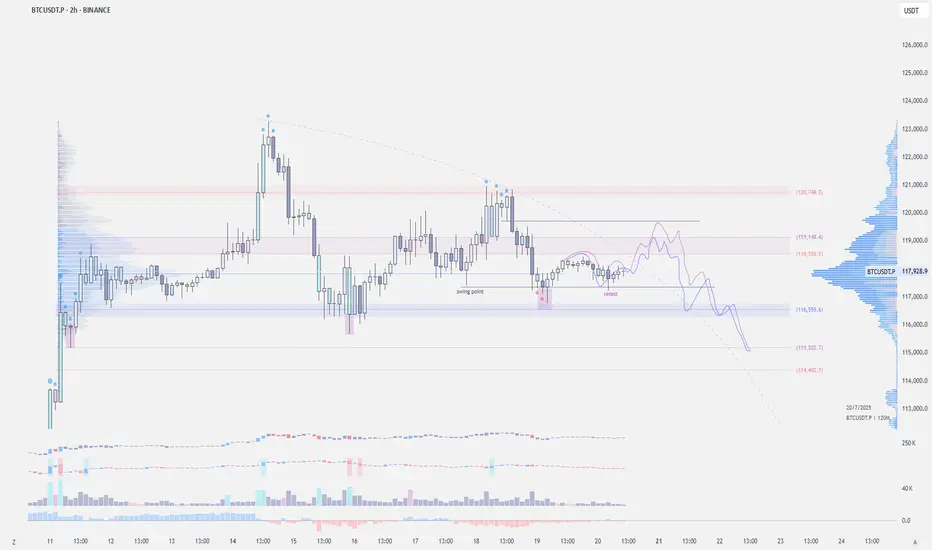
Bitcoin Liquidity updateCRYPTOCAP:BTC
📄 Update on liquidity movement and key liquidity cluster points
◀️ Summary of the first movement: A sale occurred at 121826 and a break happened at 117612, after which liquidity was collected between 116 - 115
◀️ After collecting liquidity, we mentioned that breaking 117612 would allow testing 119723, and that is what happened
⭕️ Now, a selling range has formed between 120813 - 121826, which is clear on the price chart and the way it bounced down
🟣 The current movement is confined between 118398 - 117612
📄 Regarding trading ideas:
⭕️ The thought here is to buy between 11600 - 114813 if a break occurs at 117612 and trading starts below it
⭕️ The second idea, in case this break does not happen, is to wait for confirmation of trading above 118398, and in this case, it's preferable to wait until Monday
