Short Probably!Hello all. before all I wanna tell you that I am not a crypto trader and it is unknown market to me but if it works as Forex market, market will go down from here. be happy(wink)
BTCUPUSDT trade ideas

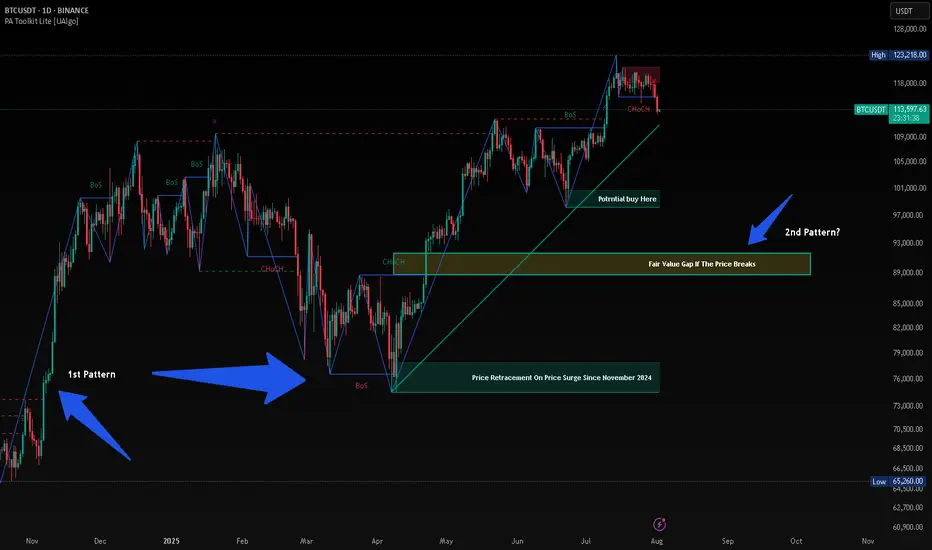
BTC HUNTS LIQUIDITYThis is just my opinion, BTC will hunt liquidity before taking new High. Since November 2024 after President Trump was elected, the price of BTC surge from $74,000 and retrace almost the same price on April 2025 after taking its new High. History will repeat itself and when history failed, there will be a long Bearish at least 90%.
Daily Bitcoin AnalysisBitcoin is at support at $115,000. Personally, I think this support will not hold and it will reach the next level of 112,000. Why? Because the downward momentum of the price is high.
This is not financial advice

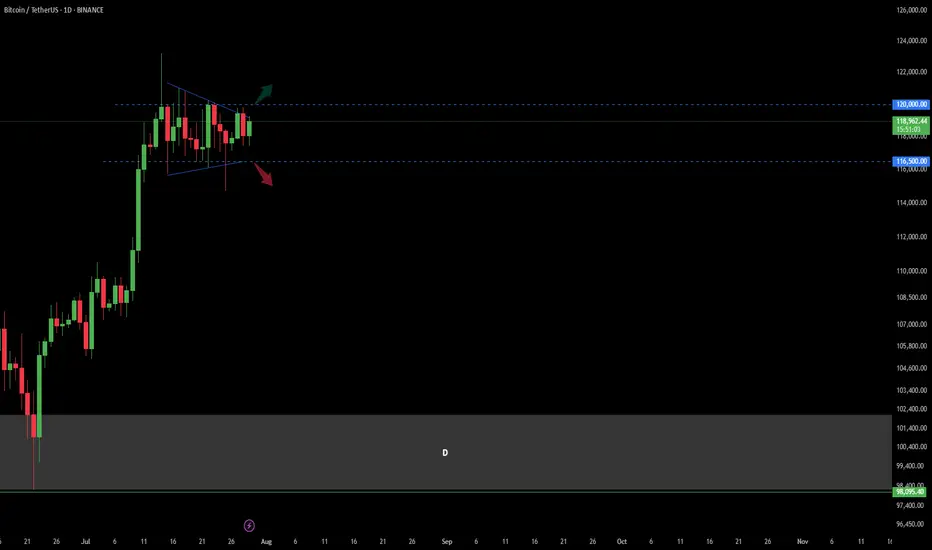
Bitcoin Trend Analaysis UP or DOWN?!Price capped in a wedge in Daily time frame.
There was a fake break from the bottom of this wedge last week and sharply got back to the top of it!
Now : break and confirm above 120 K in Daily would make the market BULLISH
break and confirm under 116.5 K in Daily would make the market BEARISH.
other wise market is still in a range mode...
BTC/USDT Analysis: Testing Strong Support
Hello everyone! This is the daily analysis from CryptoRobotics' trader-analyst.
Yesterday, we tested the local support zones previously marked and moved into a decline. At 21:00 (GMT+3), the U.S. Federal Reserve released its monetary policy statement, which included hawkish comments regarding inflation risks. The interest rate remained unchanged. The market reacted negatively to this news, and Bitcoin accelerated its drop.
At one point, a key buyer zone at $116,200–$115,000 (volume anomalies) was tested. Then, between 21:30 and 22:00 (GMT+3), a report from the White House on digital assets was released, shifting focus toward a more positive regulatory outlook. Bitcoin bounced from the mentioned zone and has since fully recovered the drop.
Currently, there are no immediate resistance levels, so in the near term, we’re likely to see a test of the ~$120,000 level. There, it's important to watch for any signs of selling pressure.
Buy Zones:
• $116,200–$115,000 (volume anomalies)
• $110,000–$107,000 (accumulated volume)
This publication does not constitute financial advice.

#BTC Update #12 – July 31, 2025#BTC Update #12 – July 31, 2025
Bitcoin is currently at the upper boundary of the channel it has been following. It may experience a pullback from this upper boundary. This pullback is estimated to reach the $116,800 level. If it wants to go lower, it could drop as far as the $114,500 level.
There is a significant amount of liquidity between $121,000 and $117,000. Bitcoin may also try to sweep this area. However, despite 4 or 5 attempts, it still hasn’t managed to break above the upper resistance zone. Therefore, a pullback should always be taken into account.
Overall, Bitcoin is still in a correction within a correction. That means no impulsive move has occurred yet. It’s not at a suitable point for either long or short positions. You may choose to trade within this range, but keep in mind that it's quite risky.

$BTC Retest Before Takeoff?Back on July 27, I shared a path 120K → 114K → 127K
Price has followed this playbook closely and now we’re at a critical zone again.
On daily timeframe, structure is still in an uptrend, but momentum is fading.
Price is consolidating between 119.9K–120.1K (Fib 61.8–65%) and 117.8K–116.6K (Fib 38.2–23.6%). MACD bearish crossover and histogram is still growing. RSI is neutral at 51 but definitely losing bullish energy.
If 117.8K breaks cleanly, we may revisit 114.7K (demand zone + full Fib retracement) before bulls reclaim control.
If we look at lower timeframe (4H). It is forming a tight range, but a lower high + weakening MACD suggests a bit more downside short term. Also, RSI at 46 confirms that consolidation with mild bearish tilt.
Key levels that I am currently looking are 118.8K–117.8K for the short-term intraday range play. And 116.6K & 114.7K for the support & potential bounce zone.
The scenario is still in play
- Rejection at 120K
- Retest 114K–116K zone
🚀 Then potential launch toward 127K (measured move + channel top)
Only a daily close above 120.1K with volume invalidates this retrace idea.
TL;DR
🟥 Resistance: 119.9K–120.1K
🟧 Neutral zone: 117.8K–118.9K
🟩 Support: 116.6K - 114.7K
🟦 Target: 127K if bulls reclaim the high ground
Still playing the patient game. Let’s see if 114K gets tagged one more time. What do you guys think?

BTC 4H – Retest Holding, But Golden Pocket BelowBitcoin’s 4H chart is at a key decision point. After a strong breakout in early July, price has been consolidating just above the prior resistance zone — now acting as support. This white box represents a major reclaim level that has held multiple times, but buyers are starting to look fatigued.
Below this support lies a clean Fibonacci retracement zone:
0.5 at 110,971
0.618 (Golden Pocket) at 108,072
0.786 deeper pullback at 103,945
The structure remains intact for now, but a loss of the current level could trigger a deeper sweep into one of these fib levels — especially with momentum (Stoch RSI) resetting from oversold.
A potential bounce here keeps the uptrend alive. However, if the zone breaks, the .618 area may be the magnet.
📊 Watching for:
Strong reaction or absorption at this support
Bullish divergence forming
Sweep into golden pocket followed by reversal structure
This setup blends price action, key S/R levels, and Fib confluence — a great chart for anticipating the next move, not reacting to the last one.

Daily Market Analysis – BTC, ETH, and Key Indexes
💎🔥 Daily Market Analysis – BTC, ETH, and Key Indexes 🔥💎
🚀 Don’t forget to FOLLOW & smash the ROCKET 🚀 button if this helped you!
💬 Drop your thoughts in the comments
♦️ Hello everyone!
On this page, we follow a daily and weekly crypto routine:
🟡 Daily:
• Structural and technical analysis of BTC, ETH, and overall market indexes.
🟡 Every Sunday:
• Analysis of the Top 10 Altcoins (excluding BTC & ETH)
• 🆕 Weekly Watchlist to be introduced soon!
💛Your likes and follows are my fuel to keep posting daily insights 💛
⭕️ We’re currently in a super critical zone across all markets:
• BTC, ETH, major Altcoins
• Key indexes like BTC Dominance (BTC.D), USDT Dominance (USDT.D), TOTAL, TOTAL2, and TOTAL3
All are at major turning points.
❗️Also, this week brings critical macro news:
• U.S. Interest Rate decision – expected to remain unchanged,
but political pressure may push Powell to surprise the markets.
• Reports on U.S. GDP, Japanese Yen interest rate, and Canadian Dollar are also coming.
⚠️ This is a HIGH-IMPACT WEEK – stay alert. We might even be at the edge of a bull run.
♦️ BTC
As mentioned yesterday, to confirm long positions on altcoins and restart their rally,
we need a breakout above 120,300 on BTC and a drop in BTC.D.
✅ Break of 120,300 would inject strong bullish sentiment and possibly trigger high momentum.
🚫 Until then, my focus is strictly on bullish setups only.
📌 If BTC ranges before the U.S. session opens, the entry triggers shared in yesterday's watchlist will be ideal to activate.
♦️ BTC Dominance (BTC.D)
While BTC price rises, BTC.D is dropping – a great signal for altcoin entries.
BTC.D is testing two key levels:
1️⃣ 60.83
2️⃣ 60.42
📉 A full breakdown of 60.83 would be the first signal of an altcoin reversal.
❗️If 60.42 breaks too – do NOT stay out of altcoins!
♦️ TOTAL (Market Cap)
Currently struggling with the 3.91T level.
A clean break here could bring in serious volume and momentum.
💡 Missed some entries from the watchlist? Look for major breakout levels on other coins.
♦️ TOTAL2 (Altcoin Cap excl. BTC)
Also testing its key level of 1.48T. Breakout = confirmation of altcoin strength.
♦️ TOTAL3 (Altcoin Cap excl. BTC & ETH)
Yesterday, gave us its first bullish signal breaking above 1.03T.
Because ETH has moved already, TOTAL2 reacted faster.
⏳ That means: we still have time for altcoin setups (excluding BTC & ETH).
♦️ USDT Dominance (USDT.D)
Broke 4.23% – which was the first early sign of a bullish shift.
Before it breaks 4.13%, we should already be in long positions on BTC and alts.
⚠️ Once 4.13% breaks, sharp altcoin rallies may happen quickly – entry opportunities may disappear.
♦️ ETH/USDT
Although ETH has bullish candles, volume and trend strength are weak.
My preferred entry was around $3,750 – that would give us room toward the $4,000 resistance.
Right now, no valid entry trigger in ETH.
If it reacts to $4,000 and forms a lower low, then we might scout for bullish setups.
⛔️ $4,000 is likely to cause some chop – which is why $3,750 was a better buy zone.
♦️ Outlook & Strategy ♦️
1️⃣ Consider the chance that all coins may bounce exactly from current levels – that's what I’m personally positioning for, accepting the risk.
2️⃣ If BTC and ETH break 120K and 4K then consolidate, and BTC.D continues to drop —
➡️ Get ready for an Altcoin Party.
3️⃣ Monitor the daily watchlist triggers closely.
4️⃣ If BTC fails to break 120.3K, we won’t get the explosive rally.
5️⃣ If BTC ranges while BTC.D continues dropping, alts will still perform —
⚠️ But not as strong as a full bull run.
🚀 Hit the ROCKET if this helped you stay ahead of the market!
🟡 Follow me for daily BTC, ETH & index updates.
💬 Let me know your market view in the comments!

Bitcoin Go 70k What are you waiting for? It's going to go up more. We have a weekly negative divergence and the correction is now the entire market is bearish.

BTC Next Move Toward $150K?Bitcoin recently broke out above a long-standing resistance zone ($110K–$115K), supported by a clean move through the volume profile high node. After testing local highs, BTC is now pulling back to retest the breakout area, a critical level that could act as new support.
Key Points:
Breakout Retest: Price has pulled back into the breakout zone around $114K, aligning with strong previous resistance that may now flip to support.
Volume Profile: A strong high-volume node is visible below ($105K–$110K), which reinforces this area as a major demand zone.
EMA Confluence: The 50-day and 100-day EMAs are trending upward and aligning near the retest area, providing additional support.
If this level holds, BTC could resume its bullish leg toward the $150K level.
Cheers
Hexa

#BTC Update #13 – Aug 01, 2025#BTC Update #13 – Aug 01, 2025
Bitcoin has approached the lower edge of its current channel and received a reaction from there. However, in the current timeframe, the ongoing candle seems willing to pull back again. The MA200 band held the previous candle well, which also represented the bottom of the current channel. There is high liquidity between the $113,200 and $121,000 zones. I believe Bitcoin will continue to move by sweeping through this region. Therefore, I think Bitcoin’s current target is to reach around the $118,000 level with a 3% push move.
If Bitcoin does not make this move and chooses to pull back instead, it may go as far as filling the imbalance at the $110,000 level. The last impulsive move was made around 20 days ago, and since then, the chart has been progressing with a correction of a correction. As long as there’s no close below $107,500, the uptrend will remain intact in the long term. However, if the $107,500 level is broken with a strong candle, we can say that Bitcoin has turned bearish on the 4-hour timeframe. For now, this doesn’t seem very likely. I believe Bitcoin’s next move will target the $118,000 region, continuing to clear out the liquidity accumulating in the upper ranges. However, this channel will need to break at some point.

Bitcoin Retests Broken Trendline Minor Resistance in Focus!Bitcoin has recently taken support from the lower levels and moved upward, successfully breaking above a key trendline resistance. Currently, the market appears to be forming another minor trendline resistance on the short-term chart. Interestingly, the previous trendline that was broken is now acting as a support zone, indicating a potential shift in market structure.
If the price manages to break this newly developing minor trendline resistance, we may expect a possible retest of that level. Should the retest hold, it could provide a strong bullish signal, allowing Bitcoin to continue its upward movement toward higher liquidity zones or resistance levels.

Bitcoin ready to correct to 92,000A treasure channel that, after a little suffering and fear, cascades down.
Tp:92000

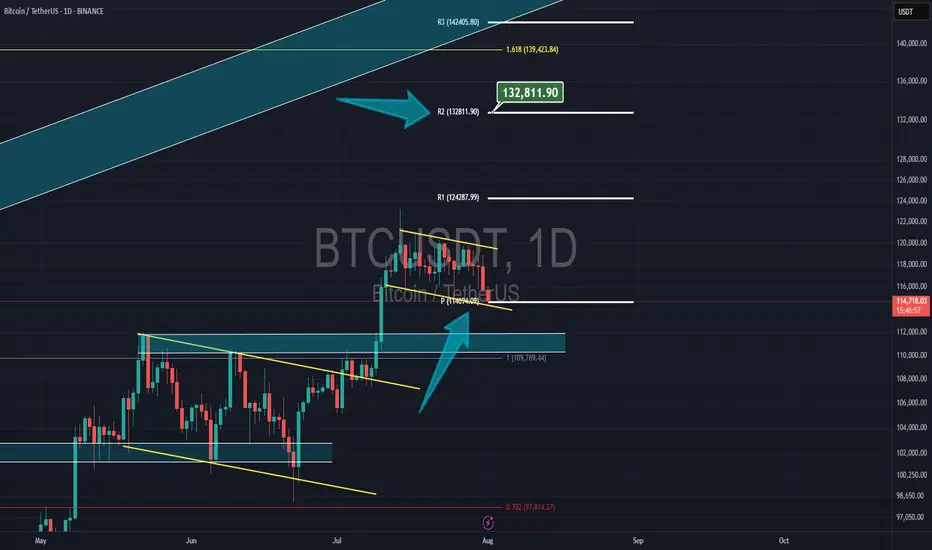
Bitcoin & NEW monthly PivotBitcoin had a correction yesterday but now its still above the new monthly pivot at $14,700 and my target is the 2nd resistance of the pivot at $132,800
Btc UpdateBTC is moving within a falling wedge and is making its fourth breakout attempt.
A successful breakout and retest of the wedge would confirm a bullish trend, while rejection could signal further movement within the wedge.

Shark harmonic pattern
---
### 🦈 What Is the Shark Harmonic Pattern?
- **Discovered by**: Scott Carney in 2011
- **Foundation**: Combines **Fibonacci ratios** with **Elliott Wave Theory**
- **Purpose**: Identifies potential **trend reversals** using precise geometric price structures
- **Structure**: Five points labeled **O, X, A, B, C** (not the usual XABCD)
- **Key Feature**: Relies heavily on the **88.6% Fibonacci retracement** and **113% extension**
---
### 📐 Pattern Geometry & Ratios
| Leg | Description | Fibonacci Ratio Range |
|------------|--------------------------------------------------|-------------------------------|
| XA | Initial impulse leg | No specific ratio |
| AB | Extension beyond X | 113% to 161.8% of XA |
| BC | Completion leg | 88.6% to 113% of OX |
| | | 161.8% to 224% of AB |
- **Point B** must **exceed point X**, forming an **Extreme Harmonic Impulse Wave**
- **Point C** is the **Potential Reversal Zone (PRZ)**
---
### 🛒 Buy Setup (Bullish Shark)
1. **No fixed retracement for A**
2. **B extends 113%–161.8% of XA**
3. **C completes at**:
- 88.6%–113% of OX
- 161.8%–224% of AB
📍 **Entry**: Near point C
📍 **Stop Loss**: Below point C
📍 **Target**: Retracement levels of BC (e.g., 50%, 61.8%), or back to point A/B
---
### 📉 Sell Setup (Bearish Shark)
1. **No fixed retracement for A**
2. **B extends 113%–161.8% of XA**
3. **C completes at**:
- 88.6%–113% of OX
- 161.8%–224% of AB
📍 **Entry**: Near point C
📍 **Stop Loss**: Above point C
📍 **Target**: Retracement levels of BC, or back to point A/B
---
### 📊 Real Trade Example & Educational Resources
In the comment

Shark harmonic pattern Absolutely, Amedeo! Here's a detailed and visually engaging breakdown of the **Shark Harmonic Pattern**, including its structure, trading styles, and how it connects Fibonacci ratios with Elliott Wave Theory:
---
### 🦈 What Is the Shark Harmonic Pattern?
- **Discovered by**: Scott Carney in 2011
- **Foundation**: Combines **Fibonacci ratios** with **Elliott Wave Theory**
- **Purpose**: Identifies potential **trend reversals** using precise geometric price structures
- **Structure**: Five points labeled **O, X, A, B, C** (not the usual XABCD)
- **Key Feature**: Relies heavily on the **88.6% Fibonacci retracement** and **113% extension**
---
### 📐 Pattern Geometry & Ratios
| Leg | Description | Fibonacci Ratio Range |
|------------|--------------------------------------------------|-------------------------------|
| XA | Initial impulse leg | No specific ratio |
| AB | Extension beyond X | 113% to 161.8% of XA |
| BC | Completion leg | 88.6% to 113% of OX |
| | | 161.8% to 224% of AB |
- **Point B** must **exceed point X**, forming an **Extreme Harmonic Impulse Wave**
- **Point C** is the **Potential Reversal Zone (PRZ)**
---
### 🛒 Buy Setup (Bullish Shark)
1. **No fixed retracement for A**
2. **B extends 113%–161.8% of XA**
3. **C completes at**:
- 88.6%–113% of OX
- 161.8%–224% of AB
📍 **Entry**: Near point C
📍 **Stop Loss**: Below point C
📍 **Target**: Retracement levels of BC (e.g., 50%, 61.8%), or back to point A/B
---
### 📉 Sell Setup (Bearish Shark)
1. **No fixed retracement for A**
2. **B extends 113%–161.8% of XA**
3. **C completes at**:
- 88.6%–113% of OX
- 161.8%–224% of AB
📍 **Entry**: Near point C
📍 **Stop Loss**: Above point C
📍 **Target**: Retracement levels of BC, or back to point A/B
---
### 📊 Real Trade Example & Educational Resources are in the comment

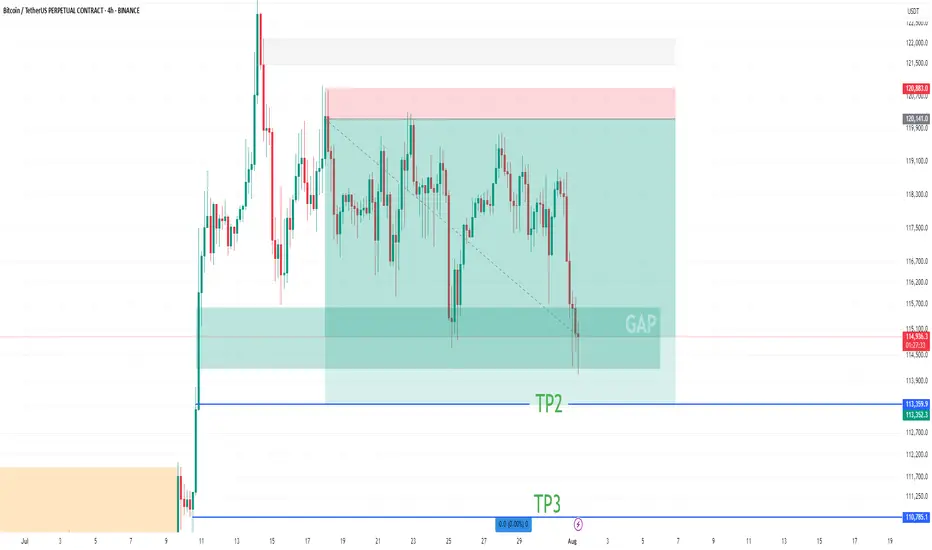
BTC Short Update Hello ❤️
Bitcoin
Let's have an update on Bitcoin analysis
💁♂️ First Target 🔥
Near Second Target
According to the analysis I posted on the page, Bitcoin touched the first target and is now near the second target
It is a good place to save profits. The price gap is filled
Please don't forget to like, share, and boost so that I can analyze it for you with more enthusiasm. Thank you. 💖😍
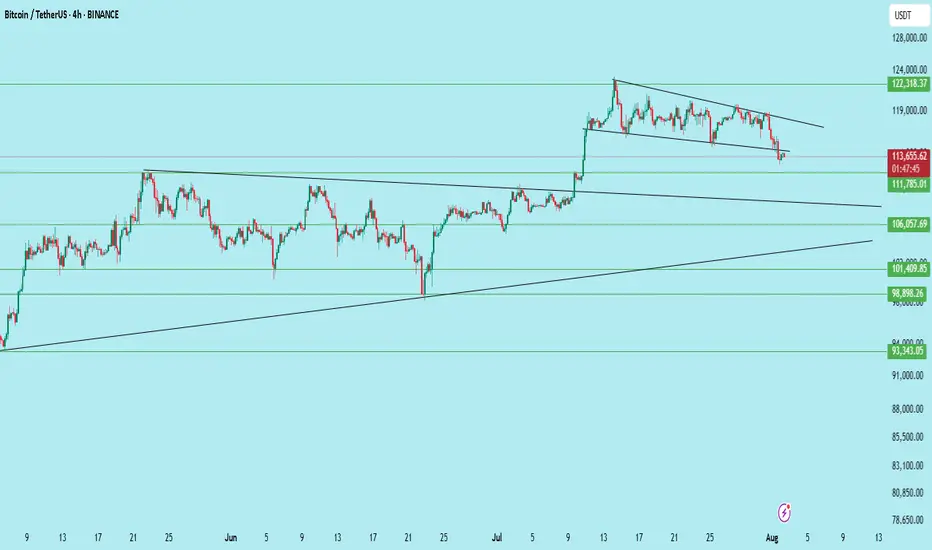
$BTC /USDT – Breakdown from Channel, Bears Gaining ControlBitcoin has broken down from its descending channel on the 4H chart after repeated rejection from the upper trendline. Price is now hovering near key support at $111,785.
Key Technicals:
Rejection from the descending trendline resistance
Breakdown of the mini-channel structure
Current price: $113,637
Support levels:
$111,785 (Immediate)
$106,057
$101,409
$98,398
Bearish continuation is likely if $111,785 breaks with volume
If the $111.7k zone fails to hold, BTC could see further downside toward $106k and even $98k in the coming sessions.
Invalidation: Bullish only on reclaim of $117K+ with strength.
DYOR | Not Financial Advice
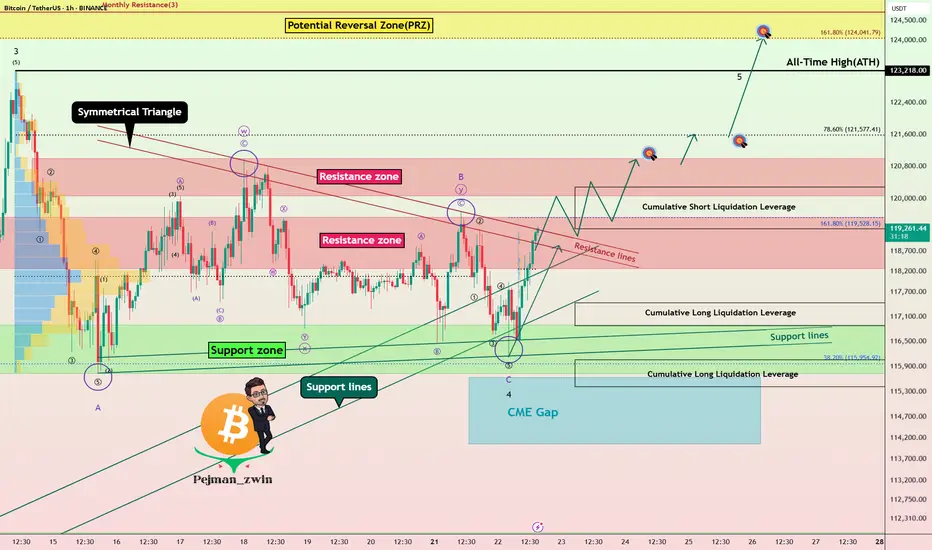
Powell’s Comments Could Decide BTC’s Fate: New ATH or Rejection!Bitcoin ( BINANCE:BTCUSDT ) has attacked the Support zone($116,900-$115,730) several times over the past week but failed to break through, meaning that buyers are still hoping for a BTC increase or even a new All-Time High(ATH) .
Bitcoin has reached a Resistance zone($119,530-$118,270) again and is trying to break the upper lines of the Symmetrical Triangle Pattern . The Cumulative Short Liquidation Leverage($117,255-$116,675) is important and includes high sell orders , so if Bitcoin can break the Resistance zone($119,530-$118,270) and the Resistance lines with high momentum , we can hope for a continuation of the upward trend.
Whether or not the Resistance zone($119,530-$118,270) and the Resistance lines break could depend on the tone of Jerome Powell’s speech today .
Jerome Powell will speak at the opening of the “ Integrated Review of the Capital Framework for Large Banks ” — the final major appearance before the Federal Reserve enters its pre-meeting blackout period.
Market Expectations:
The speech is officially about regulatory frameworks (like Basel III), but traders are watching closely for any hints regarding interest rate policy. Even indirect comments could move risk assets like BTC.
Rate Cut Signals?
With political pressure mounting (including criticism from Trump ) and markets pricing in a potential cut later this year, Powell may adopt a cautious, data-dependent tone emphasizing flexibility in decision-making.
--------------------
In terms of Elliott Wave theory , it seems that the wave structure of the main wave 4 correction is over. The main wave 4 has a Zigzag Correction(ABC/5-3-5) , so that the microwave B of the main wave 4 has a Double Three Correction(WXY) . Of course, the breakdown of the Resistance zone($119,530-$118,270) and Resistance lines can confirm the end of the main wave 4 .
Also, there is a possibility that the 5th wave will be a truncated wave because the momentum of the main wave 3 is high , and Bitcoin may NOT create a new ATH and the main wave 5 will complete below the main wave 3.
I expect Bitcoin to rise to at least the Resistance zone($121,000-$120,070) AFTER breaking the Resistance zone($119,530-$118,270) and Resistance lines .
Second Target: $121,620
Third Target: $123,820
Note: Stop Loss(SL)= $117,450
CME Gap: $115,060-$114,947
Cumulative Long Liquidation Leverage: $117,429-$116,878
Cumulative Long Liquidation Leverage: $116,053-$115,411
Please respect each other's ideas and express them politely if you agree or disagree.
Bitcoin Analyze (BTCUSDT), 1-hour time frame.
Be sure to follow the updated ideas.
Do not forget to put a Stop loss for your positions (For every position you want to open).
Please follow your strategy and updates; this is just my Idea, and I will gladly see your ideas in this post.
Please do not forget the ✅' like '✅ button 🙏😊 & Share it with your friends; thanks, and Trade safe.
Bitcoin (BTC): OrderBook is Hinting To $115K Bounce | Thoughts?Bitcoin has recently broken the $116K local neckline zone and reached the $115K area, which has been at our attention due to huge orders sitting there.
What we are thinking is that this zone will be a good bounce area, which should lower the price to $120K.
Either way, this zone is important, so keep an eye on it!
Swallow Academy

TradeCityPro | Bitcoin Daily Analysis #134👋 Welcome to TradeCity Pro!
Let’s dive into the Bitcoin analysis and key crypto indices. As usual, in this analysis I will review the New York futures session triggers for you.
⏳ 1-Hour Timeframe
On the 1-hour timeframe, Bitcoin has formed a range box between 116829 and 119395. Yesterday, after getting supported at 116829, it climbed back to the top at 119395.
📊 As you can see, buying volume has increased, which indicates strong buyer momentum.
📈 If 119395 is broken, the price could move toward higher targets like 120594 and 122733.
🧩 This 119395 area is also the breakout trigger of the descending triangle. The bottom at 116829 has supported the price multiple times, and now with the descending trendline being broken, price could aim for higher resistance levels.
👑 BTC.D Analysis
Let’s move on to Bitcoin Dominance. BTC Dominance has been supported at 60.46, which is why Bitcoin is moving upward, while altcoins are dropping.
🎲 The dominance trend is still clearly bearish, and if 60.46 breaks, the next downward leg may begin.
📅 Total2 Analysis
Let’s look at Total2. This index has also formed a range between 1.48 and 1.55, and it is currently sitting at the bottom of the box.
🔔 If we get confirmation of support at 1.48, we can consider entering a long position. The main long trigger would be the break of 1.55.
📅 USDT.D Analysis
This index has also formed a range box. The previous support level was 4.08, which has now shifted to 4.13.
💥 The top of the box is 4.25. Given the bearish momentum in dominance, the probability of 4.13 breaking is higher.
🎲 So keep a close eye on altcoins in the coming days, because a lot of capital is flowing into them and they could see significant pumps.
❌ Disclaimer ❌
Trading futures is highly risky and dangerous. If you're not an expert, these triggers may not be suitable for you. You should first learn risk and capital management. You can also use the educational content from this channel.
Finally, these triggers reflect my personal opinions on price action, and the market may move completely against this analysis. So, do your own research before opening any position.
