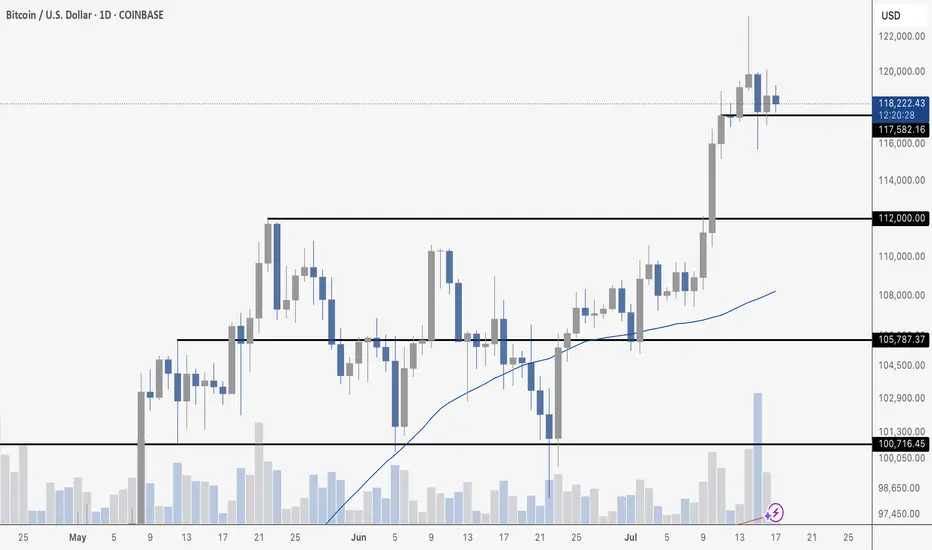
BTC CONSOLIDATESBitcoin is consolidating just below \$120,000 after Tuesday’s sharp pullback – which came on the highest daily volume since the \$74,000 bottom in March – mostly driven by selling. Despite the pressure, price held support cleanly at \$117,582 and continues to range tightly, suggesting healthy consolidation after a strong breakout above \$112,000. As long as \$117,582 holds, the structure remains bullish. A close above \$120,000 could ignite the next leg higher.
BTCUSD.P trade ideas
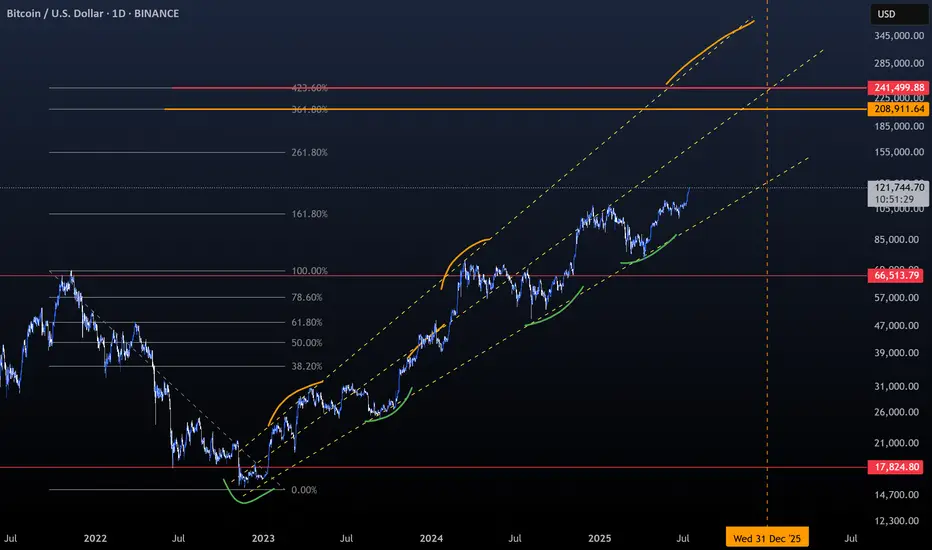
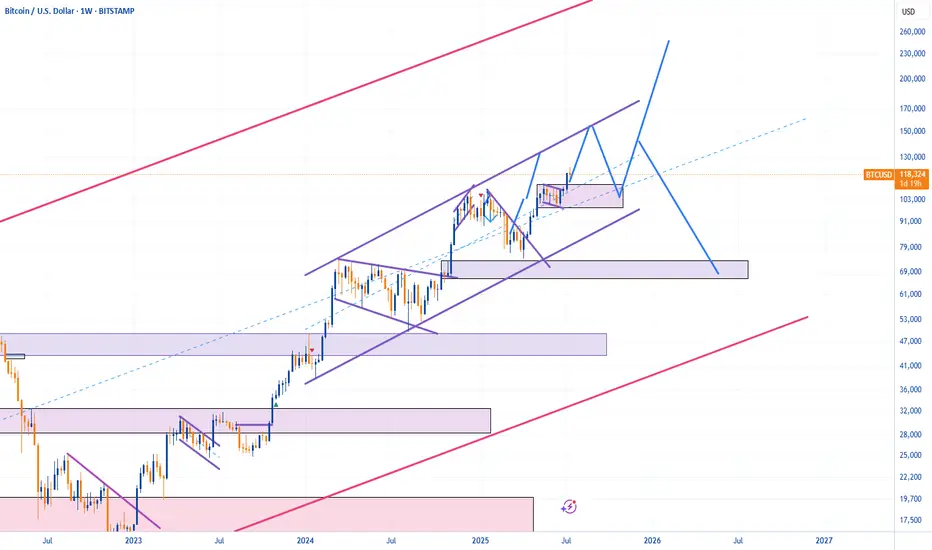
Bitcoin -> The bullrun is not over!📣Bitcoin ( CRYPTO:BTCUSD ) is still totally bullish:
🔎Analysis summary:
A couple of months ago Bitcoin broke above the previous all time high. This was basically just the expected creation of new highs, perfectly following the underlying cycles. With respect to the long term rising channel formation, this bullrun on Bitcoin is just starting.
📝Levels to watch:
$100.000
🙏🏻#LONGTERMVISION
Philip - Swing Trader

Bitcoin Buy Bias – On-Chain Confidence Still Has Room to RunThe On-chain Confidence indicator is showing signs of increasing sell pressure and profit-taking, but it still remains well below the historical peaks seen in previous bull market tops (2017 & 2021).
👉 This is a composite indicator combining several key on-chain metrics like RHODL Ratio, Puell Multiple, and MVRV, among others.
📊 The current level resembles early 2024 and early 2025, suggesting we are not yet at extreme sentiment levels.
If this indicator continues to climb toward its previous cycle highs, it may signal that we’re entering the final leg of this bull run. For now, there’s still room for upside momentum.

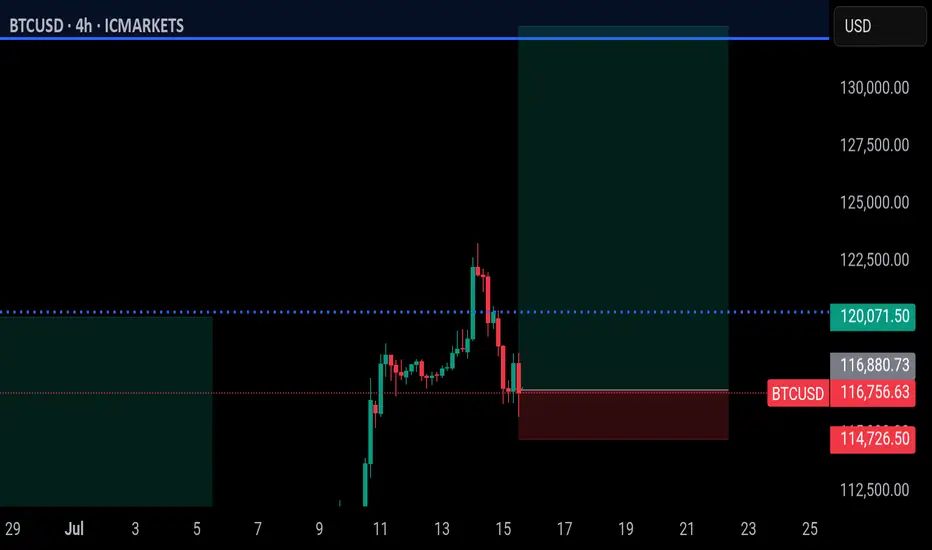
BTCUSD focuses on shorting in the supply zoneOn the 4-hour chart, BTCUSD has fallen from its historical high. Currently, we can focus on the supply zone of 119200-120500. If the rebound is blocked, we can consider shorting. The downside target is around 112000.

Bitcoin may make correction movement to support levelHello traders, I want share with you my opinion about Bitcoin. Price recently printed a new ATH at 118800 points and then began to show signs of correction. Before this breakout, the price was stuck in a long downward channel, where it bounced inside the buyer zone (103000–103800) several times and reversed upward. After the final breakout, BTC entered a range phase between the support level (103800) and the support area (110300–111300), building energy before the massive move. Once the price escaped this range, a strong impulse up followed, pushing BTC above all major levels and reaching a new high. However, after hitting the ATH, the price started to stall and consolidate. Currently, we can see signs of weakness at the top — the structure is forming lower highs and looks unstable, which may indicate a potential retracement. Now the price is trading above the support area, but I expect a corrective move back toward the current support level at 110300. This level aligns with the top of the previous range and now acts as strong demand. That’s why I’ve set my TP at 110300 level — right at the beginning of potential buyer interest. Please share this idea with your friends and click Boost 🚀
Disclaimer: As part of ThinkMarkets’ Influencer Program, I am sponsored to share and publish their charts in my analysis.


Key Insights: Financial Markets Transformation by 2030For years, this page has been my space to share in-depth market research and personal insights into key financial trends. This post reflects my perspective — a strategic outlook on where I believe the digital finance industry is heading.
The financial world is evolving at an unprecedented pace, and it's easy to overlook subtle shifts. But the undeniable fact is that we are now standing at the intersection of three powerful industries — financial markets, blockchain, and artificial intelligence. We are positioned at the cutting edge of technology, where innovation is not a future concept but a present reality.
This post serves as a reference point for future trends and a guide to understanding the transformative forces shaping financial markets by 2030. These are not just facts, but my vision of the opportunities and challenges ahead in this rapidly converging digital ecosystem. Staying ahead today means more than following the market — it means recognizing that we are part of a technological shift redefining the core of global finance.
📈 1. Electronic Trading Evolution
Full transition from traditional trading floors to AI-driven digital platforms.
Integration of blockchain and smart contracts ensures transparency, automation, and risk reduction.
Real-time data analytics democratizes market access and enhances strategic decision-making.
🤖 2. Algorithmic Trading Growth
Accelerated by AI, machine learning, and big data analytics.
High-frequency trading (HFT) boosts efficiency but introduces new volatility factors.
Adaptive algorithms dynamically adjust strategies in real time.
Strong focus on regulatory compliance and ethical standards.
🔗 3. Tokenization of Real World Assets (RWA)
Transforming asset management with projected growth to $18.9 trillion by 2033. (now 18.85B)
Enhances liquidity, accessibility, and transparency via blockchain.
Institutional adoption is driving mainstream acceptance.
Evolving regulations (DLT Act, MiCA) support secure tokenized ecosystems.
🏦 4. Institutional Adoption & Regulatory Frameworks
Digitalization of fixed income markets and exponential growth in institutional DeFi participation.
Key drivers: compliance, custody solutions, and advanced infrastructure.
Global regulatory harmonization and smart contract-based compliance automation are reshaping governance.
💳 5. Embedded Finance & Smart Connectivity
Embedded finance market to hit $7.2 trillion by 2030.
Seamless integration of financial services into everyday platforms (e-commerce, mobility, etc.).
AI, blockchain, and IoT power real-time, personalized financial ecosystems.
Smart contracts reduce operational friction and enhance user experience.
🛡 6. Financial Crime Risk Management
Market expected to reach $30.28 billion by 2030.
AI-driven threat detection and anomaly monitoring strengthen AML compliance.
Blockchain ensures data integrity and automates cross-border regulatory adherence.
Global collaboration (FATF, EU AML) fortifies defenses against evolving financial crimes.
🌍 7. Consumer Behavior & Financial Inclusion
Digital banking bridges the gap for underbanked populations, especially in emerging markets.
Mobile solutions like M-Pesa revolutionize access to financial services.
Biometrics, microfinance, and AI-powered engagement tools foster inclusive economic participation.
🚀 Conclusion
By 2030, financial markets will be defined by technology-driven efficiency, regulatory adaptability, and inclusive growth.
Success will favor those who embrace innovation, leverage automation, and engage in cross-sector collaboration.
The future belongs to agile stakeholders navigating a landscape shaped by AI, blockchain, tokenization, and smart finance connectivity.
Best regards, EXCAVO
_____________________
Disclosure: I am part of Trade Nation's Influencer program and receive a monthly fee for using their TradingView charts in my analysis.

BITCOIN's Situation (1h) !!!The triangle pattern will break in the direction it is breached, and the price will move in that direction. In my opinion, the price could be corrective and may correct down to $115K.

Bitcoin Early, Not LateA simple graphic with all annotations included :
- Trend.
- Fibonnacci.
- Middle Line.
- Support and Bounces.
- Resistances and dips.
- Everyone gets Bitcoin at the price they deserve.
- Not a price Prediction, keep things simple.
Happy Tr4Ding !
#BTC/USDT It's not over yet! Eying at 130K +ALTCOIN CHEAT SHEET!The last time I shared this chart was on April 14th, when Bitcoin was trading around $84,000 — right when panic was setting in across the market.
The message back then was simple: don’t panic, it’s just a retest.
And here we are again, revisiting the same sentiment with a new chart!
There are a lot of “double top” charts circulating in the space right now, but let me be clear: it’s not over yet.
Before jumping to conclusions, go through this chart and analysis to understand the full picture.
Bitcoin closed the week at $105,705 — certainly higher than most expected just a few days ago.
This marks the first red weekly candle after seven consecutive green closes, which is normal in the context of a healthy uptrend. We're still midway toward the broader target, so there’s no reason to panic or shift into disbelief.
Yes, we may see further corrections in BTC over the coming days or week, potentially down to $98K, and in a less likely scenario, even $ 92K. But this time, Ethereum is showing signs of strength and is likely to outperform Bitcoin, creating high-quality entry opportunities across the altcoin market. In other words, this phase is not a threat, it's an opportunity. BTC is still destined to hit $130k+ as per charts and other important metrics.
Here’s a typical market structure and reaction flow to help put things in perspective:
1. Bitcoin rallies — Altcoins underperform or get suppressed due to capital rotation into BTC.
2. Bitcoin corrects — Altcoins correct further as fear increases and dominance rises.
3. Bitcoin stabilises — Ethereum begins to gain strength, often leading the altcoin recovery.
4. ETH/BTC ratio increases — Ethereum holds up better while many altcoins continue to lag.
5. Bitcoin breaks ATH — This triggers a gradual recovery in altcoins.
6. BTC dominance peaks — Altcoins start gaining serious momentum.
7. Capital rotates from BTC and ETH into altcoins — Sectors tied to the current narrative (like meme coins this cycle, and Metaverse/NFTs in the last one) begin to lead.
8. Altcoin season begins — Utility and mid-cap tokens follow, often delivering strong returns in the final phase.
This pattern has repeated across cycles. Currently, we appear to be in the transition between Bitcoin stabilising and Ethereum gaining dominance — typically the stage that precedes a strong altcoin rally.
Now is not the time to assume the move is over. Stay objective, monitor capital rotation closely, and prepare for what comes next.
If your views resonate with mine, or if this post adds any value to you, please boost with a like and share your views in the comments.
Thank you
#PEACE

Final BTC target still remain above 130kBTC still has some push to do to reach my final target, 130k - 145k region. If you look at my BTC chart from January, that region has been highlighted. Till then, I'm still bullish. Now DXY is trying to turn bullish too, which will mean bearish BTC but it is that is s lagging indicator. It won't happen immediately, maybe next 2 or 3 months. Be prepared, for now, we still go up. Enjoyyy
Follow me as my trades are market order so you'll see the trades on time anand enter on time
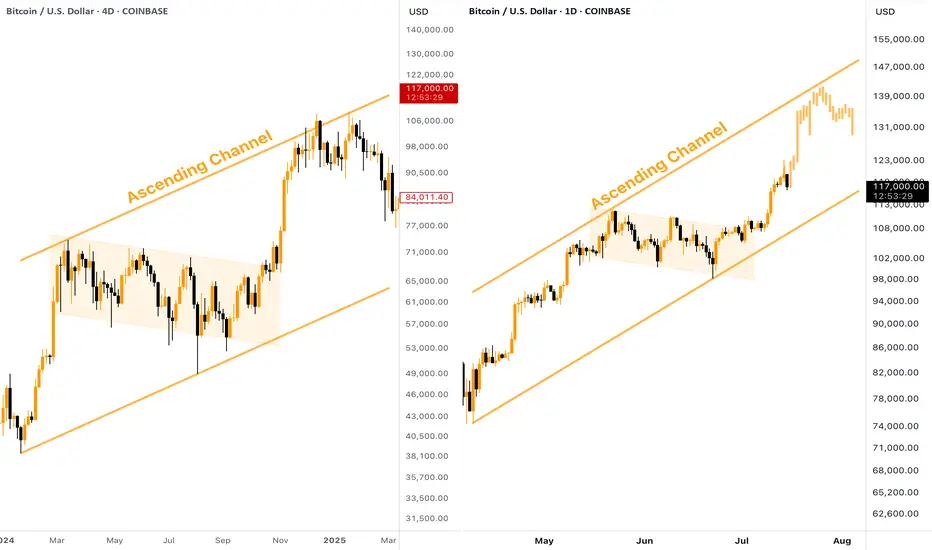
[BITCOIN] - Where is Potential TOP (ATH) of the Bull Cycle?Many people wondering where is the potential TOP of the current Bitcoin Bull Run? Besides setting a Fibo Retracement, we can take a look at the past. The current situation on CRYPTOCAP:BTC chart reminds me of what we've seen in the end of 2024, here is why:
Big ascending channel, price perfectly moves inside without breaking borders
Descending consolidation inside the bull flag
Strong breakout and pump towards the resistance of the channel
👉 According to this pattern, the target for the current Bitcoin upward move should be located in the $140,000 zone. Keep this in mind when planning your trades.
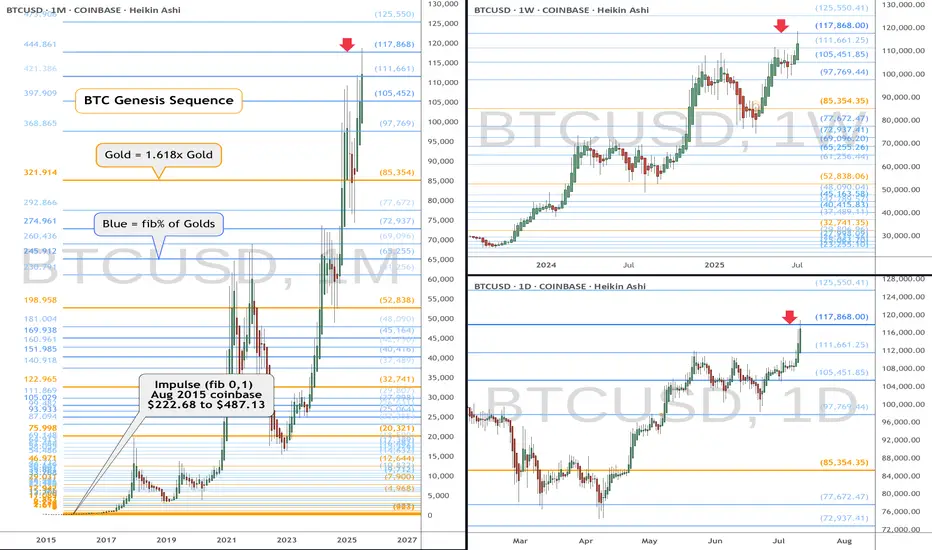
BTC eyes on $117,868: SemiMajor Genesis fib to Orbit a few times\Shown here is a single fib series in three different time-frames.
The "Genesis Sequence" has called all major turns since 2015.
This are "High Gravity" Fibs try to capture price into Orbit.
$ 117,668.00 (Coinbase) is the exact level of interest.
$ 111,661.25 is the first support below, a minor ratio.
$ 105,451.85 is semi-major and MUST hold fib below.
$ 125,550.41 is the next target above, a minor ratio.
See "Related Publications" for many PRECISE and TIMELY charts -------->>>>>>>
.
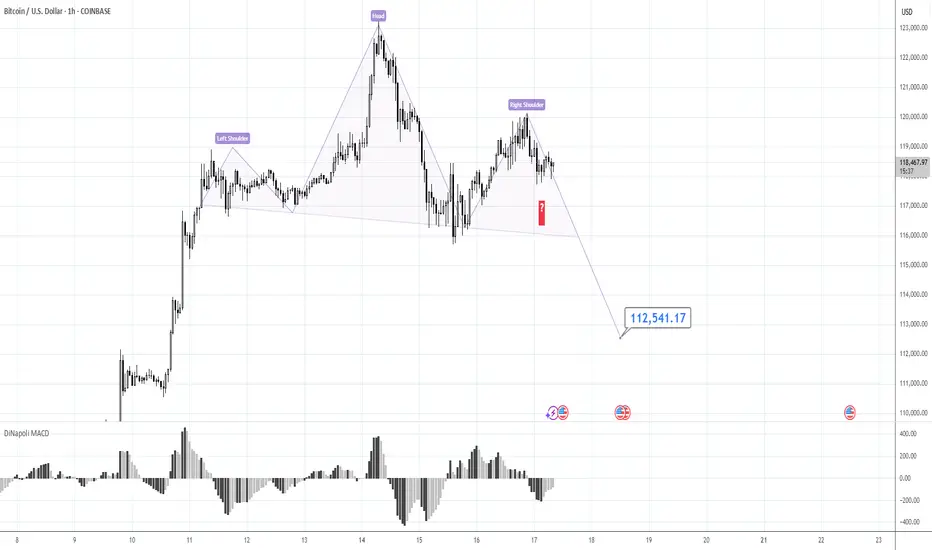
120K is the Key.Morning folks,
Our last plan worked perfect - market re-tested 117K support and jumped out. If you have longs - you could keep it.
We consider now two alternative scenarios, although we think that this one with triangle is more probable, we do not exclude the H&S shape on 1H chart that could lead BTC down to 112-113K support area.
So, if you do not know how to deal with this - keep an eye on the 120K area and top of the right arm. Upside breakout will confirm H&S failure and triangle scenario. Otherwise, until market stands under 120K - consider H&S as a basic scenario, just for safety.
Take care, S.
₿itcoin: Pushing Higher—But Watch for a Reversal AheadAfter taking a brief pause over the weekend, Bitcoin resumed its upward momentum early this morning, trading within the blue Target Zone between $117,553 and $130,891. This marks the first time the cryptocurrency giant has traded above the key $120,000 level. Within this zone, and in line with our primary scenario, we continue to anticipate the peak of the corrective wave B rally, followed by a trend reversal to the downside. We expect a significant wave C decline, targeting the lower blue zone between $62,395 and $51,323. As such, prices in the upper blue Target Zone may present an opportunity to take (partial) profits on existing long positions and, where appropriate, to initiate potential short positions as a hedge. These shorts could be protected with a stop 1% above the upper boundary of the zone, given there remains a 35% probability that Bitcoin could break directly above the $130,891 resistance and set a new high as blue wave alt.(i).
📈 Over 190 precise analyses, clear entry points, and defined Target Zones - that's what we do.

Bitcoin: Short term tradeHello,
Cryptocurrencies, particularly major coins like Bitcoin, have experienced a volatile yet exhilarating rally in July 2025, reaching unprecedented all-time highs. This surge has attracted significant attention, drawing in new investors driven by fear of missing out (FOMO) and heightened market enthusiasm. While Bitcoin’s long-term potential remains robust, our analysis suggests a near-term correction is likely.
From a technical perspective, Bitcoin is currently undergoing a corrective phase as early investors capitalize on recent gains by taking profits. Chart patterns indicate the formation of a bullish flag, a continuation pattern that often precedes further upside after a consolidation period. We recommend that investors exercise patience and wait for the correction to fully develop. Optimal buying opportunities are anticipated around the $113,000 level, with a short-term price target of $130,000.
A key technical indicator, the Moving Average Convergence Divergence (MACD), is approaching a zero-line crossover, which could serve as a strong catalyst to confirm the resumption of Bitcoin’s upward momentum. We remain bullish on Bitcoin, maintaining an overweight position in our portfolio with a short-term target of $132,000.
Disclosure: I am part of Trade Nation's Influencer program and receive a monthly fee for using their TradingView charts in my analysis.
#BTCThe next potential move... It could touch the top of the channel, and if the breakout is confirmed on the monthly timeframe, we’ll likely see a pullback to the lower level.
Bearish reversal off Fibonacci confluence?The Bitcoin (BTC/USD) is rising towards the pivot and could reverse to the 1st support which is a pullback support.
Pivot: 121,983.11
1st Support: 112,086.50
1st Resistance: 128,114.70
Risk Warning:
Trading Forex and CFDs carries a high level of risk to your capital and you should only trade with money you can afford to lose. Trading Forex and CFDs may not be suitable for all investors, so please ensure that you fully understand the risks involved and seek independent advice if necessary.
Disclaimer:
The above opinions given constitute general market commentary, and do not constitute the opinion or advice of IC Markets or any form of personal or investment advice.
Any opinions, news, research, analyses, prices, other information, or links to third-party sites contained on this website are provided on an "as-is" basis, are intended only to be informative, is not an advice nor a recommendation, nor research, or a record of our trading prices, or an offer of, or solicitation for a transaction in any financial instrument and thus should not be treated as such. The information provided does not involve any specific investment objectives, financial situation and needs of any specific person who may receive it. Please be aware, that past performance is not a reliable indicator of future performance and/or results. Past Performance or Forward-looking scenarios based upon the reasonable beliefs of the third-party provider are not a guarantee of future performance. Actual results may differ materially from those anticipated in forward-looking or past performance statements. IC Markets makes no representation or warranty and assumes no liability as to the accuracy or completeness of the information provided, nor any loss arising from any investment based on a recommendation, forecast or any information supplied by any third-party.

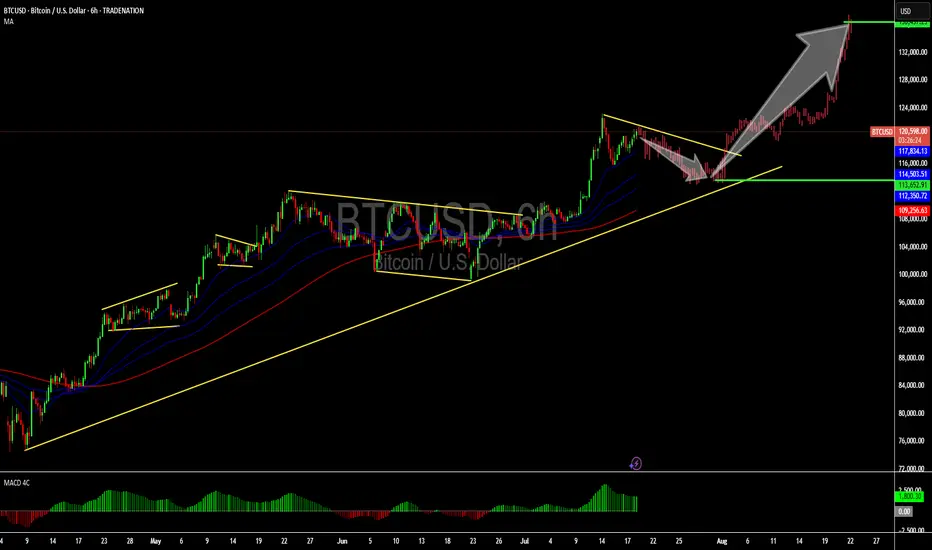
Bitcoin (BTC/USD) Technical AnalysisBitcoin (BTC/USD) Technical Analysis – Daily Chart Overview
This chart shows a **bullish continuation setup** for Bitcoin, supported by **EMA structure**, **trendline**, and **support zone** validation. Here's the detailed breakdown:
**1. Trend & Structure**
* **Uptrend:** Price is in a clear uptrend, making higher highs and higher lows.
* **Trendline:** The ascending trendline confirms strong upward momentum. It has been respected multiple times, acting as dynamic support.
**2. Key Support Zones**
* **Recent Breakout Zone (\~\$118,000 – \$119,000):**
Bitcoin broke out above this horizontal resistance and is now **retesting it as support**. This is a classic bullish retest pattern.
* The chart suggests that as long as price holds above this zone, **bullish continuation** is expected.
**3. EMA Indicators (Exponential Moving Averages)**
* **7 EMA (Red) – \$118,386**
* **21 EMA (Blue) – \$114,042**
* **50 EMA (Black) – \$109,483**
All EMAs are **sloping upwards** and aligned in bullish order (7 > 21 > 50), confirming strong upside momentum. The price is currently above all EMAs, which supports a continuation of the bullish trend.
**4. Bullish Target**
* The green arrow suggests a projected bullish move with a potential target above **\$130,000–\$132,500**, assuming price holds the support and resumes upward.
**5. Risk Area**
* If BTC closes **below the highlighted support zone (\~\$118,000)**, it could invalidate the bullish structure temporarily and push toward the next support near **\$114,000–\$115,000**.
**Conclusion**
* **Bias:** Bullish
* **Actionable Insight:**
* As long as BTC remains above the \$118K support zone and trendline, **buy dips** or **hold longs**.
* A clean break and close above recent highs (\~\$121K–\$122K) could open the door toward **\$130K+** targets.

#LetsRideThePeak BTC ₿₿I checked my old BTC forecast and realized that Bitcoin has been following it loosely.
There's a clear pattern emerging that might surprise everyone very soon. In the coming days, I’ll post a long-term BTC analysis and add it to the toolkit.

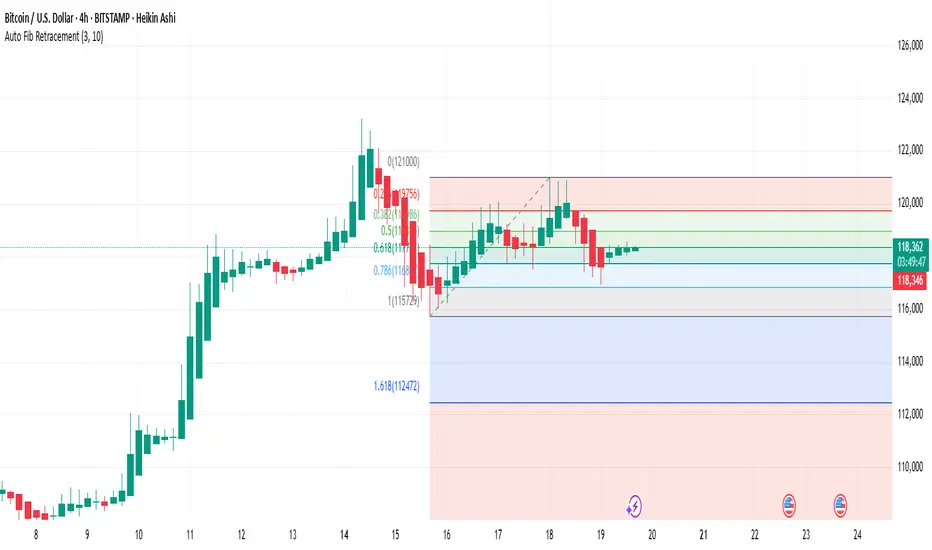
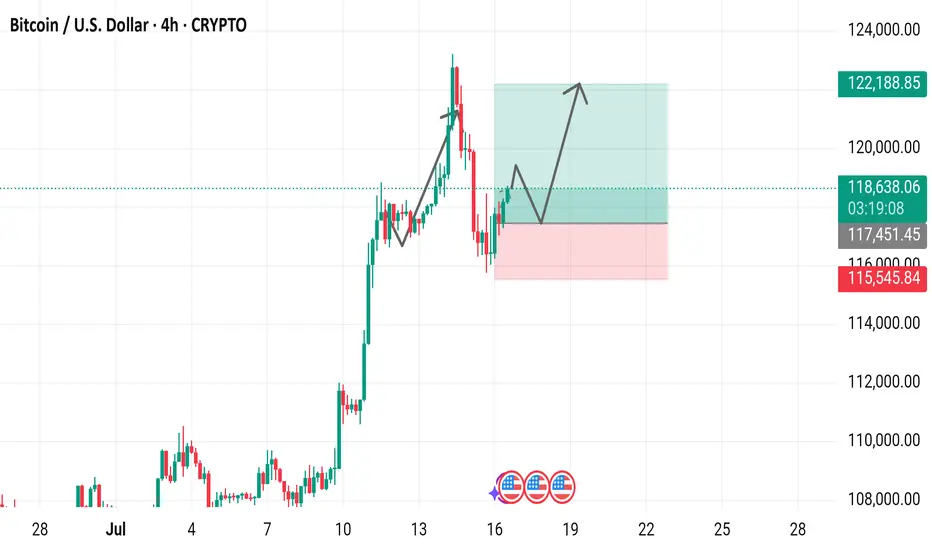
Bitcoin / U.S. Dollar 4-Hour Chart (July 2025)4-hour price movement of Bitcoin (BTC) against the U.S. Dollar (USD). The price has risen from 118,714.64 to 118,714.64 (+937.9 or +0.80%) over the period. Key levels include a support zone around 115,451.45 to 117,451.45 and a resistance zone near 120,000.00 to 122,188.85,
BITCOIN BREAKOUT IMMINENT (120K)The Trend is your Friend. Bitcoin’s current action is the kind of bull‐market digestion you want to see before the next big surge. We’ve powered up from roughly $50 K on the Trump‐election narrative to flirt with all‐time‐high territory around $112 K, and now we’re simply consolidating in a tight $100 K–$110 K range. What really grabs my attention is how volume has dried up inside that band: fewer sellers stepping up means less fuel for a deep pullback, and an ebb in liquidity often precedes the kind of compressed buildup that launches a sharp move. That liquidity squeeze tells me smart money is biding its time rather than panicking out, and that sets the stage for a clean breakout once a new catalyst arrives.
Technically, the setup could hardly be neater. The 10-, 21- and 50-period moving averages have converged, running almost in lockstep. When those averages come together like train tracks, it signals a market in “healthy pause” — neither exhausted by an overextended rally nor capitulating under bearish pressure. It’s the kind of feature you love to see: price has had its run, it’s caught its breath, and it’s ready to go again on fresh conviction. Meanwhile, the RSI sits squarely in the middle of its range, neither overbought nor oversold, meaning there’s plenty of room for buyers to step in without an immediate pullback risk from extreme readings. In other words, momentum indicators are calm, not frothy or fearful, which further supports the case for a measured upward thrust rather than a sudden crash.
On the macro side, fundamentals are lining up, too. Monthly passive inflows into Bitcoin ETPs and ETFs continue at a robust clip, with institutions quietly adding to their positions out of the spotlight. If the Fed pivots toward rate cuts later this year, capital that’s been chasing yield elsewhere could flow back into risk assets — and Bitcoin, with its “digital gold” narrative, stands to gain especially when you consider its roughly $2 trillion market cap versus gold’s $20 trillion. That leaves a lot of upside potential if institutional demand keeps accelerating. Even more compelling: real‐world use cases for blockchain—everything from proof‐of‐ownership to decentralized finance—continue to mature behind the scenes, reinforcing Bitcoin’s narrative as not just a speculative asset, but a foundational piece of tomorrow’s financial system.
Of course, we can’t ignore the risks. We’ve already seen Bitcoin price near $112 K once, and there’s always the chance it carves a frustrating double-top if it stalls again. External narratives—Middle‐East tensions, renewed Ukraine tensions, fresh tariff skirmishes—could throw cold water on the rally and trigger a quick sell-off. But given the current setup—low‐volume consolidation, converging moving averages, balanced RSI and steady capital flows—a 10 % push toward $120 K feels not just possible but probable. Keep your eye on $112 K as your breakout trigger, size your positions sensibly, and plan your stop-loss around the lower end of the range. If Bitcoin can clear that level on strong volume, we’re likely to see this bull market extend rather than roll over into a double-top scenario. Happy trading, stay disciplined, and let’s see where this market takes us next!
