Are we on Super Bullish Express Highway ? Elliott Waves RoadmapHello friends,
Welcome to RK_Chaarts
Today we're attempting to analyze Bitcoin's chart, specifically the BTCUSD chart, from an Elliott Wave perspective. Looking at the monthly timeframe chart, which spans the entire lifetime of Bitcoin's data since 2011, we can see the overall structure. According to Elliott Wave theory, it appears that a large Super Cycle degree Wave (I) has completed, followed by a correction in the form of Super Cycle degree Wave (II), marked in blue.
Now, friends, it's possible that we're unfolding Super Cycle degree Wave (III), which should have five sub-divisions - in red I, II, III, IV, & V. We can see that we've completed red I & II, and red III has just started. If the low we marked in red II doesn't get breached on the lower side, it can be considered our invalidation level.
Next, within red III, we should see five primary degree sub-divisions in black - ((1)), ((2)), ((3)), ((4)) & ((5)). We can see that we've completed black ((1)) & ((2)) and black ((3)) has just started. Within black ((3)), we should see five intermediate degree sub-divisions in blue - (1) to (5). Blue (1) has just started, and within blue one, we've already seen red 1 & 2 completed, and red 3 is in progress.
So, we're currently in a super bullish scenario, a third of a third of a third. Yes, the chart looks extremely bullish. We won't commit to any targets here as this is for educational purposes only. The analysis suggests potential targets could be very high, above $150,000 or $200,000, if the invalidation level of $98,240 isn't breached. But again, friends, this video is shared for educational purposes only.
Many people think that the market doesn't move according to Elliott Waves. But friends, here we've tried to analyze from the monthly time frame to the overly time frame. We've definitely aligned the multi-time frame and also aligned it with the principal rules of Elliott Waves, without violating any of its rules.
I agree that the Elliott Wave theory can be a bit difficult, and for those who don't practice it deeply, it can be challenging. But yes, the market moves according to this methodology, following this pattern. This is a significant achievement.
I am not Sebi registered analyst.
My studies are for educational purpose only.
Please Consult your financial advisor before trading or investing.
I am not responsible for any kinds of your profits and your losses.
Most investors treat trading as a hobby because they have a full-time job doing something else.
However, If you treat trading like a business, it will pay you like a business.
If you treat like a hobby, hobbies don't pay, they cost you...!
Hope this post is helpful to community
Thanks
RK💕
Disclaimer and Risk Warning.
The analysis and discussion provided on in.tradingview.com is intended for educational purposes only and should not be relied upon for trading decisions. RK_Chaarts is not an investment adviser and the information provided here should not be taken as professional investment advice. Before buying or selling any investments, securities, or precious metals, it is recommended that you conduct your own due diligence. RK_Chaarts does not share in your profits and will not take responsibility for any losses you may incur. So Please Consult your financial advisor before trading or investing.
BTCUSD.P trade ideas

BTC/USD | 2025 Top = 130k | 2026 Top = 170k+Continuing the current upwards trajectory, using Fibonacci trend analysis, we'll reach BTC's peak for 2025 @ 130-135k within the next few months.
By the end of the month / beginning of 2026, BTC will be back to 100k - this is where this strategy begins.
Enter @ 100k between the 78.6% and 100% Fibonacci levels, setting a comfortable SL down to the 61.8% Fibonacci level @ 80k. Over the course of 3-6 months we'll then reach the first peak of 2026 at the 178.6% level @ 150-160k . Close.
From this point, timelines rely purely on consistency, however considering Bitcoin's adoption and rate of growth, an upwards trend is guaranteed.
We wait for price retraction down to 120-125k near the lower 127.2% Fib level and enter. SL down at 100% Fib level @ 100-105k. Next peak for 2026 is 170k and above , possibly creating a top @ 200k.

[UPD] BTC / ETH / XRP / SOL / HYPE and other alt and mem-coins A new video update with insights on the intermediate trend structure with key support and resistance zones to keep on radar in the coming sessions
Coins discussed in the video: CRYPTOCAP:BTC / CRYPTOCAP:ETH / CRYPTOCAP:XRP / GETTEX:HYPE / CRYPTOCAP:SOL / CRYPTOCAP:LINK / CRYPTOCAP:SUI / $BRETT / SEED_DONKEYDAN_MARKET_CAP:FLOKI and others
Hope this is helpful in guiding you through the crypto market. Thank you for your attention and I wish you successful trading decisions!
If you’d like to hear my take on any other coin you’re tracking - feel free to ask in the comments (just don’t forget to boost the idea first 😉).

BITCOINBTC is showing strong bearish momentum. Price has broken below key support and is forming lower highs and lower lows, indicating continuation of the downtrend.
Until we see a clear reversal pattern or reclaim of resistance levels, I expect further downside.

Bitcoin sell now for 4h time frame trend reversal Bitcoin sell now for 4h time frame trend reversal From here

BTC/USD Today: Momentum Builds Toward the Next BreakoutBITSTAMP:BTCUSD Today: Momentum Builds Toward the Next Breakout
Previously on BTC...
1. Double Top Pattern and Target Hit
The chart shows a classic double top (early 2025), a bearish reversal pattern. Once the neckline broke, the price plunged and nailed the technical target (red arrow)—as if Bitcoin had read the textbook.
2. Trendline Break = Game Changer
After bottoming out, BTC broke through a downward sloping trendline, triggering a strong bullish move. This breakout signaled a trend reversal, and the market responded accordingly.
3. Perfect Pullback
Once the breakout played out, the price retraced back to previous resistance, now turned support. This “perfect pullback” is the kind of thing that makes technical analysts smile in their sleep.
4. Bull Trend Confirmation
The successful retest of support confirmed that Bitcoin had shifted from neutral/bearish into a full-on bull trend. Buyers stepped back in with confidence.
📊 BTC/USD – Current Outlook
Bull Flag Forming
Currently, price action is consolidating into a bull flag, a continuation pattern often seen mid-rally. If it breaks out to the upside, the projected target sits near $120,000 .
🚀 Bullish Catalysts:
- Strong structural trend: Higher highs and higher lows are still intact.
- Post-halving momentum: Historically, Bitcoin tends to go beast mode 6–12 months after each halving—and we’re right in that sweet spot.
- ETF inflows : Institutional capital continues pouring into Bitcoin ETFs, adding steady buying pressure.
- Supply crunch: With more BTC leaving exchanges, sell-side liquidity is drying up. Hodlers are hodling.
- Technical setup: A confirmed breakout from the bull flag could trigger a powerful leg higher.
⚠️ Risks and Levels to Watch:
A breakdown of the bull flag could send BTC back toward the $98k–91k range.
Macro headwinds (rate hikes, economic slowdown, dollar strength) could still rain on crypto’s parade.
🧠 Conclusion
This chart paints a textbook bullish setup for Bitcoin. The double top is in the rearview mirror, the trendline breakout gave us the green light, and now the bull flag is loading the next move.
If the breakout happens, the next destination could be $120,000.
It’s one of those “don’t blink” moments—BTC might just be stretching before its next sprint.

BitcoinBitcoin has fallen below the support area, resulting in the expected quick decline. The price is currently testing the resistance area and must reclaim this level; otherwise, we may see downward movement again. The key level to reclaim is between $106,800 and $107,000.

July 18 Bitcoin Bybit chart analysisHello
It's a Bitcoin Guide.
If you "follow"
You can receive real-time movement paths and comment notifications on major sections.
If my analysis was helpful,
Please click the booster button at the bottom.
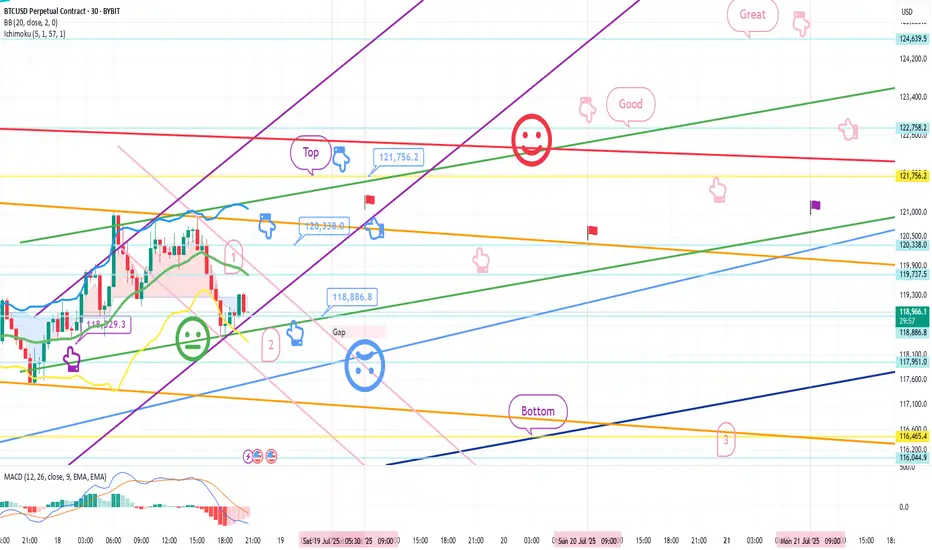
Bitcoin 30-minute chart.
There is no Nasdaq indicator announcement today.
The mid-term pattern was broken in the morning wave,
but I proceeded as safely as possible.
At the bottom left, I connected the final long position switching section in the analysis article on the 15th with a purple finger.
*When the blue finger moves,
Bidirectional neutral
Short->Long or long waiting strategy
1. Short position entry section of $120,338 / Stop loss price when orange resistance line is broken
2. Long position switching of $118,886.8 / Stop loss price when blue support line is broken
3. Long position 1st target of $121,756.2 -> Target price in the order of Good and Great
If it falls immediately from the current position or
touches the top once and falls, it is a vertical decline condition.
If it falls immediately, it is the final long waiting in section 2.
(When the sky blue support line breaks, the stop loss price is the same)
From the sky blue support line break, the 6+12 section is where the mid-term pattern is restored,
and it is roughly the bottom section.
If the strategy is successful, I have left a simulation with a pink finger on the right,
so please check the switching and profit-taking section,
and operate safely in each position, long, short, and no position, based on whether the purple support line breaks from the current position.
From the green support line break, the low point of today's daily candle is broken,
so it would not be good for a long position, right?
Up to this point, please use my analysis article only for reference and use,
and operate safely with principle trading and stop loss price.
Thank you.
BTCUSD 1H – TCB Breakout Reclaim Setup📌 BTCUSD 1H – TCB Breakout Reclaim Setup
📆 Date: July 19, 2025
🔍 Strategy: TCB (Trend–Countertrend–Breakout)
🧠 Context:
BTCUSD broke below an ascending channel, found support at ~118,000, and is now attempting a reclaim of previous structure.
This is a classic reclaim zone setup — where a clean retest of prior support-turned-resistance turns back into support again, offering a breakout entry.
✅ TCB Checklist Summary:
Trend: ✅ Uptrend prior to break
Countertrend: ✅ Clean channel breakdown
Demand Zone: ✅ Strong reaction from 118k
Breakout Zone: 🔜 Watching 118,800
Confirmation Candle: 🔄 Awaiting bullish signal
🧮 Total Score: 8/10 = 80%
🔄 Projected 100% once:
Breakout candle above 118.8k confirms
NY session volume aligns
R:R: ✅ Clean 1:2+ to 120.4k
📈 Trade Plan (If Breakout Confirms):
Entry: Above 118,800 (after bullish close)
SL: Below 117,800
TP1: 119,800
TP2: 120,400
Risk: 0.5%–1.0% depending on position sizing
🔔 Alerts Set For:
Breakout Entry (118,800+)
TP1 Hit (119,800)
TP2 Hit (120,400)
SL Hit (117,800)
🧭 Note:
This trade is not yet active — confirmation required above 118.8k with session momentum (NY or strong engulfing candle). Clean reclaim = high-quality continuation setup in TCB strategy.
📓 Using the TCB method helps filter low-quality breakouts and confirms structure before entry. Wait for the reclaim and momentum confirmation before executing.
💬 Let me know in the comments if you're watching this or trading similar setups on BTC!
#BTCUSD #Crypto #PriceAction #TradingView #TCBStrategy #Breakout #TechnicalAnalysis #ReclaimSetup #SmartTrading

BTC/USD POTENTIAL SELL OPPORTUNITY!A sell opportunity is what we envisage in this market from the H4 timeframe.
After the new high was made, the market formed a bearish flag pattern like pattern. We’re looking for to selling from the current market price. Our target profit is $111,000

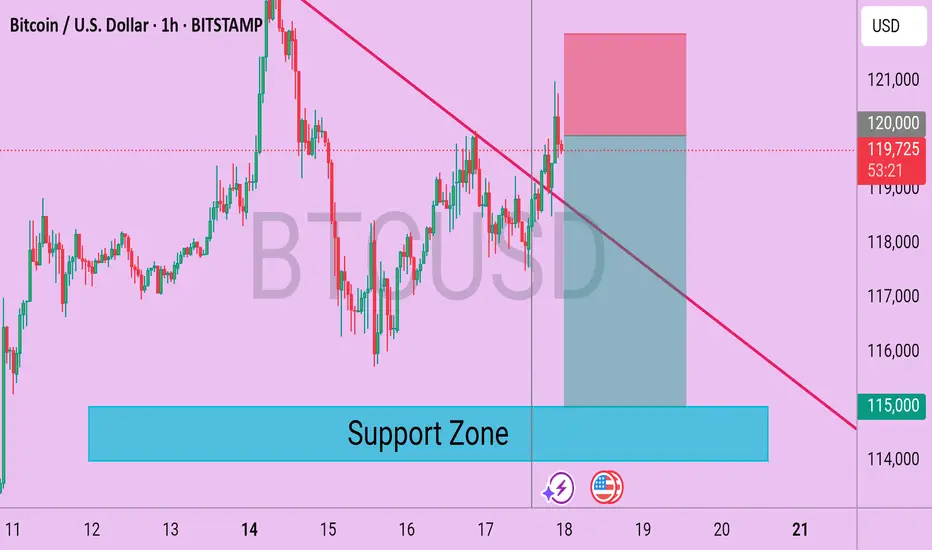
Bitcoin (BTC/USD) 1H Technical Analysis – Breakout in ProgressBitcoin is showing bullish intent after breaking above a descending trendline resistance on the 1-hour chart. The breakout occurred with decent bullish momentum, suggesting buyers are regaining control in the short term.
📈 Chart Observations:
Descending Trendline Broken: Price has successfully broken above a well-respected descending trendline, which acted as resistance over the past few sessions. This breakout may signal a shift in short-term market structure.
Support Zone: The marked support zone around $115,000 continues to act as a critical demand area. Price has rebounded multiple times from this zone, reinforcing its significance.
Current Price Action: BTC is currently trading near $119,800, just under the round-level resistance of $120,000. A clean hourly close above this level could open room for further bullish continuation.
📊 Key Levels:
Resistance: $120,000 (Psychological level)
Immediate Support: $118,000
Major Support Zone: $115,000–$114,000
📉 Bearish Scenario:
If BTC fails to hold above the broken trendline and slips back below $118,000, a revisit of the support zone near $115,000 becomes likely. Bears may step in again if the price fails to sustain higher highs.
✅ Conclusion:
BTC is showing potential for a short-term bullish reversal after breaking out of its descending pattern. Traders should monitor for confirmation through price continuation above $120,000. However, a cautious approach is advised near resistance levels, and invalidation below $118,000 could favor sellers once again.
Last chance to make profit from BTC with buying positionBullish flag
Strong resistance breakout
2 bull points
Position trade spot buying
Bitcoin completing timecycle on oct 2025 after that it would be 4th time if market again crash for around 70%
Manage your risk in both future and spot trading
Note: NO analysis would 100% profitable trading is the game of probability and risk management so follow your trading plan with proper risk reward and win rate.

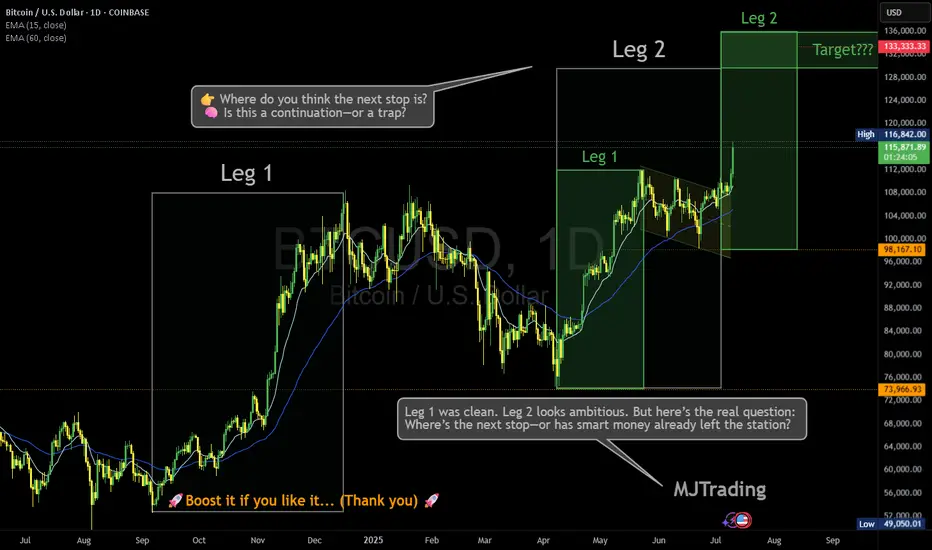
Where is the next stop? 133,333?Leg 1 was clean. Leg 2 looks ambitious. But here’s the real question: Where’s the next stop—or has smart money already left the station?
BTC just sliced through both EMAs with conviction, now hovering above $116K. Volume’s decent, sentiment’s euphoric… but is this rally genuine markup, or a cleverly disguised distribution phase?
🔍 Price targets like $133K are seductive—but what if consolidation isn’t horizontal anymore?
Vertical consolidation is real. And it’s where retail gets baited hardest.
📊 Leg 2 might still play out—but don’t ignore the possibility that this is the final markup before a liquidity sweep.
👉 Where do you think the next stop is? 🧠 Is this a continuation—or a trap?
Drop your guess...
Who has entered here:?
Who can let the winners run in this situation:
#MJTrading #ATH
#Bitcoin #BTC #CryptoTrading #SmartMoney #MarketStructure #WyckoffMethod #LiquiditySweep #DistributionPhase #TechnicalAnalysis #TradingView #CryptoChart #PriceAction #EMA #Consolidation #CryptoStrategy #TrendReversal #CryptoCommunity
BTC - HYPERBOLIC FINISH This box here where we right shit in, what it really worth? You will never understand technical analysis if you think reading words in a little box mean something. BTC , next top mid frame with a throw over of center to $164,000. Then consolidation around the core to $138,000, then the hyperbolic finish to $187,500+. Nuf said. Good luck. Volatility will be high, but mainly move in one direction. Murrey Math, ( Which trading view wont let me display because its an unpublished indicator , Elliott Wave, Kumar Wave being used for this forecast.

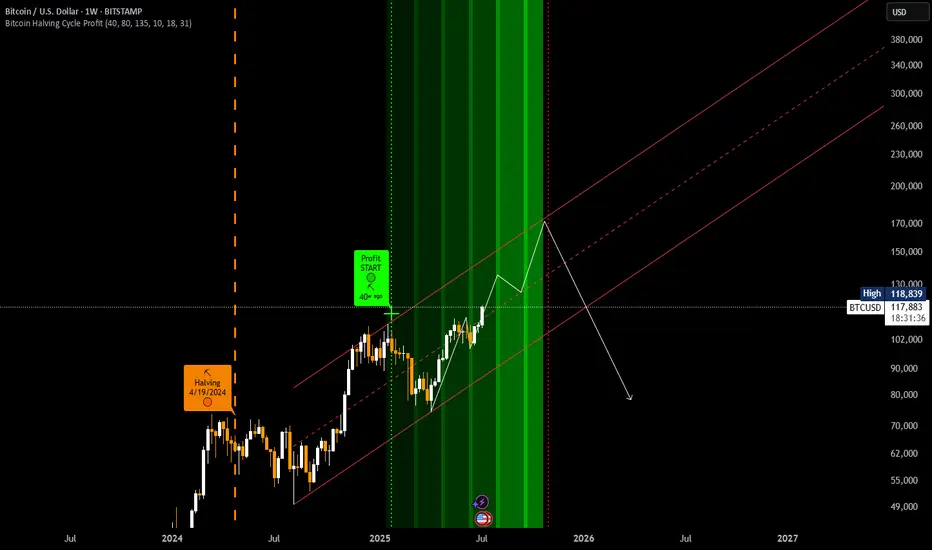
20 year long BTC analysisTaking into account the halvening and the recent bullish news of countries and big companies wanting to establish a BTC reserve. I think we can see some crazy cycles in the future.
These entities are most likely planning to hold for a minimum of 20 years. And countries won't be shy to print some extra dough for it. Some may see it as an opportunity to finally get rid of their national debt.
As long as fiat exists BTC will most likely keep going up. Its that simple.

BTCUSD Long📈 Scenario Outlook:
Bias: Bullish
Preferred Play: Long setups are favorable as long as price holds above 116,600 demand.
BTC is expected to push through the intermediate supply zones and potentially attempt a full retracement toward the previous CHOCH high at 123,231.
📌 Key Zones ("Your Borders"):
🟢 Demand Zone (Support)
Zone: 116,600 – 117,600
This is a well-marked reaccumulation zone, aligned with previous demand and the CHOCH origin. Price respected this level multiple times, showing it as a valid base for long entries.
As long as BTC holds above this zone, the bullish thesis remains valid.
🔴 Supply Zones (Resistance Targets)
First Supply: 119,000 – 120,000
Aligned with the 50% retracement level (11964.22) from the previous high to low swing.
Expect short-term reaction here; however, this level may not hold if momentum continues building.
Upper Supply Zone: 121,500 – 123,200
This is the final major resistance before revisiting the previous high at 123,231.
A sweep or rejection from here could form a double top or distribution structure, depending on macro factors and volume.

BTC Long and ShortFor chart pattern, TP1 Reahced , mostly will go TP 2.Target swing high (TP 2) and Counter for swing low,after reaching TP2. What do you think guys

SellRejection Level
Daily Volume
Market Structure Shift
London US Session
Trend Line Break
Untapped Order Point

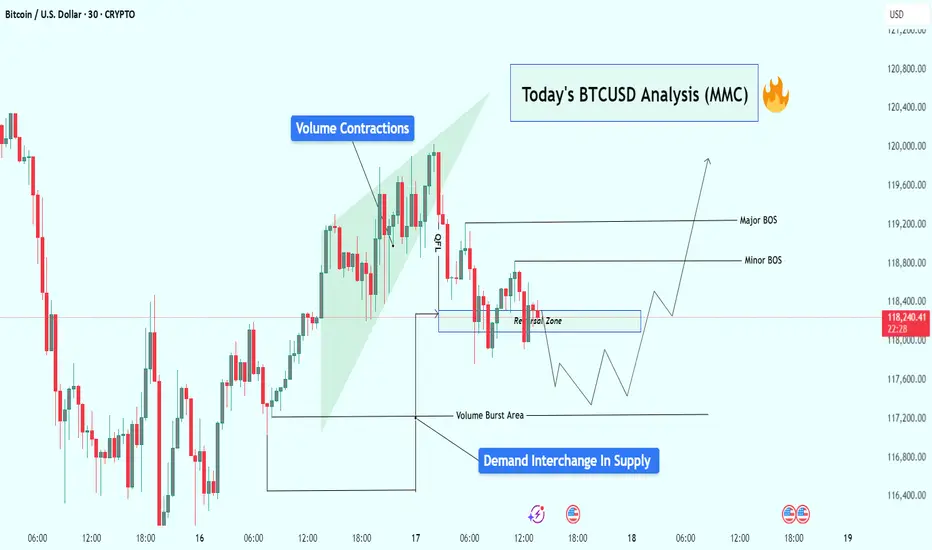
BTCUSD Analysis : Reversal Brewing from Volume Burst Demand Zone🧠 Overview:
Bitcoin is currently showing signs of a potential bullish reversal, following a classic Market Maker Cycle (MMC) pattern. The price action has been clean, respecting both volume dynamics and structural levels, setting the stage for a possible breakout above key areas of interest.
Let’s dive into the detailed breakdown:
🔍 Key Technical Elements:
1️⃣ Volume Contractions – Early Sign of Momentum Shift
At the top left of the chart, we observe a sharp upward move, followed by volume contraction within a rising wedge. This typically represents:
Absorption of orders
Reduced volatility
Market indecision
This kind of structure often precedes a reversal or aggressive breakout, depending on how price behaves near liquidity zones.
2️⃣ Fakeout/Trap Above – Classic MMC Manipulation Phase
After the rising wedge formed, BTC experienced a quick fakeout (stop hunt) just above the highs, then dropped sharply. This was the manipulation leg — a clear signal that liquidity above the wedge was taken and smart money is now repositioning.
🧠 Market makers love to trap breakout traders before moving the opposite way. The drop confirms manipulation is complete.
3️⃣ Reversal Zone + Demand Interchange into Supply
Price then entered a marked reversal zone which was previously an area of demand — now interchanging into supply. This zone is critical because:
It aligns with volume burst zones
It acted as support turned resistance
Multiple rejections confirm order flow shift
This tells us smart money is now testing this area to accumulate or trap sellers.
4️⃣ Volume Burst Area – Institutional Involvement Confirmed
We can clearly identify a Volume Burst Area, where price spiked with strong momentum — this is not retail trading. This zone is now being revisited for a potential bullish re-accumulation.
Expect reaction from this area, as it likely contains unmitigated buy orders from institutions.
5️⃣ Break of Structure (BOS) Mapping:
Minor BOS: Breaks short-term lower highs, showing early intent.
Major BOS: Breaks significant structure, confirming shift in trend direction.
A successful retest of demand and then break of both BOS levels will likely lead to a strong bullish continuation.
📈 Trade Plan & Potential Price Path:
There are two potential bullish entry strategies forming:
✅ Scenario 1: Clean Breakout Plan
Price holds the current reversal zone
Breaks Minor BOS, then Major BOS
Retest of BOS confirms continuation
📍 Target: $119,600+
✅ Scenario 2: Liquidity Sweep Entry
Price dips lower into Volume Burst Area
Sweeps liquidity below and prints a bullish reaction
Enters from discount zone
Same upside targets apply
🧠 This would be a smart money entry — entering from the lowest point of pain for retail traders.
🧵 Final Thoughts:
BTC is setting up beautifully for a reversal continuation pattern within the MMC framework. We’ve seen:
📉 Initial drop (accumulation phase)
🎭 Fake breakout (manipulation phase)
📈 Upcoming expansion (breakout phase)
All signs point to a high-probability move upward, especially if price confirms with BOS + retest. Be patient, wait for price action to align with structure and volume clues.
BUYRejection Level
Daily Volume
Market Structure Shift
London US Session
Trend Line Break
Untapped Order Point

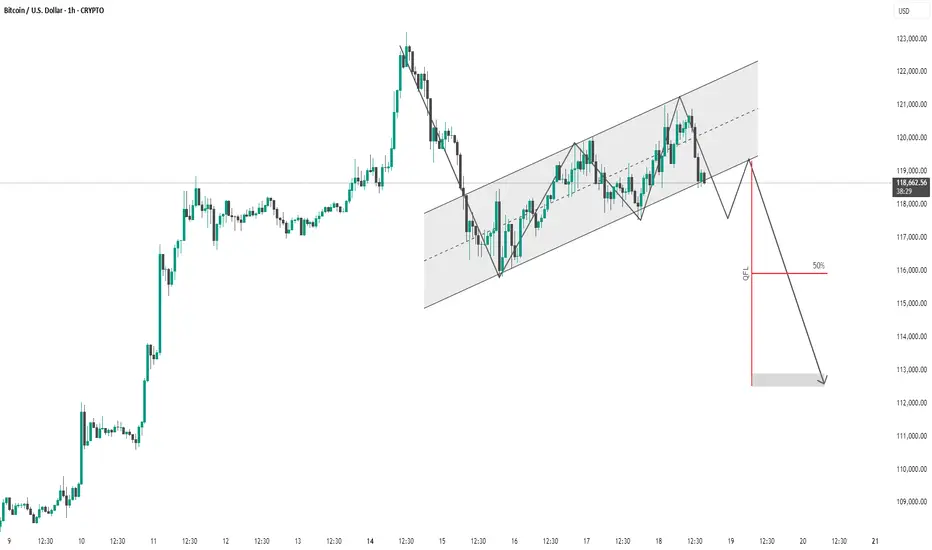
BTC #1-hour chart of Bitcoin (BTC/USD)This is a 1-hour chart of Bitcoin (BTC/USD) with a clear bearish outlook indicated by the analysis:
Key Observations:
Rising Channel:
Price has been moving inside an ascending channel.
Currently testing the lower boundary, suggesting potential for a breakdown.
Price Projection:
A sharp drop is anticipated after breaking the channel, supported by the downward black arrows.
The analyst anticipates a retest of the lower boundary followed by a rejection and continuation downward.
QFL Strategy Reference:
"QFL" (Quick Fingers Luc strategy) is marked with a red line, identifying a key support zone that price may break below.
50% level (retracement or zone midpoint) is noted for confluence.
Target Zone:
Final target appears to be in the $112,500 – $113,000 range.
Summary:
The chart presents a bearish thesis expecting BTC to break the ascending channel and fall toward a previous demand zone marked by the QFL level. The structure supports a short setup if the lower trendline fails to hold.
Risk Note: This is a speculative forecast; always confirm with volume, broader market context, or confirmation patterns.
thank u
BTC intra?
Hi
Do you know?
www.investopedia.com
If your initial plan is BUY.. whatever reasons: Fundamental/ outlook buy
We'll take this trade; reason
Two Yeses : Outlook BUY Pattern BUY
How will it react?
Answer: I don't know
High probability : Yes
Where do you enter? Your preference
wait retrace or now... just
If you wait.. might not get the ticket
If calculate between entry and stop loss: pips
And divide by what you re risking in $ to pips
All the best
