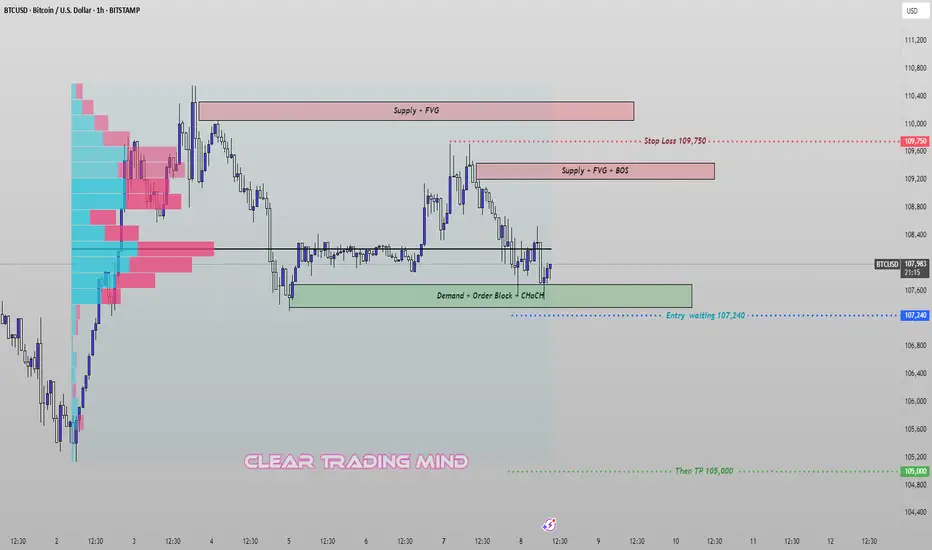
BTCUSD – Breakout Plan from Demand Zone (CHoCH + OB Setup)🔹 Current View:
I'm closely watching the 107,240 zone, where we have a strong Demand + Order Block + CHoCH (Change of Character) setup. This is a key support area that could trigger a fresh bearish move if broken.
🔹 My Plan:
I'm waiting for a clear breakout below 107,240 to enter a short position.
➡️ Entry: 107,240 (after confirmed breakout)
➡️ Stop Loss: 109,750 (above supply + BOS zone)
➡️ Target: 105,000 (previous inefficiency zone)
🔹 Supply Zones Noted:
- 109,250–109,500: Supply + FVG + BOS
- 110,000–110,500: Strong Supply + FVG
This trade is based on price breaking demand structure and retesting key supply areas above. Volume profile also shows heavy activity above, indicating possible resistance on any pullbacks.
BTCUSD.P trade ideas
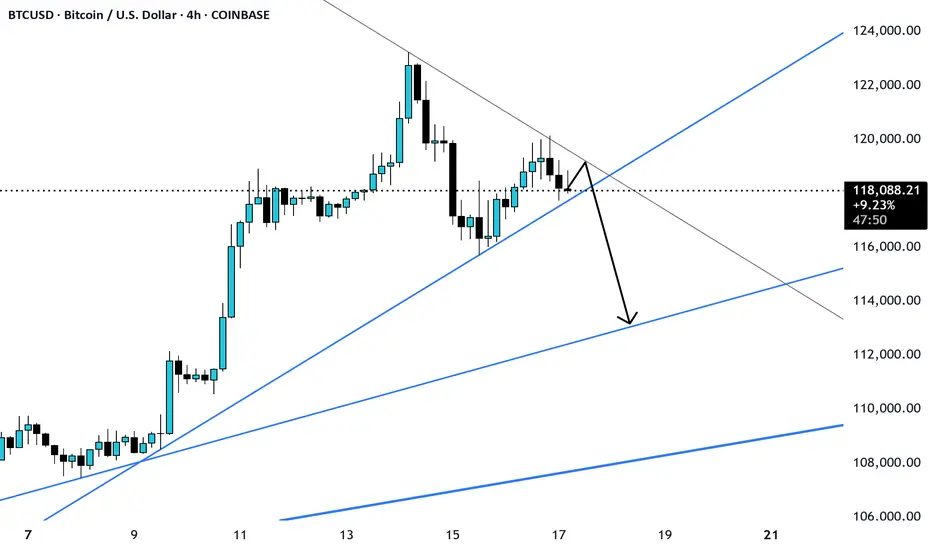
BTCUSD - Exhausted? Second time rejected, now down.BTCUSD got rejected at the Centerline the second time. This is super bearish. If it's closing below yesterdays low, that's a clear short signal to me.
Taking 50% gains off the table is never bad. Because then you still have 50% if it's going up further. Otherwise, you got 50% booked.
Don't let gree eat your brain §8-)

Shorting the Bitcoin now !Please refer to the 4H chart as shown. Good risk reward ratio.
Always have a SL in place.

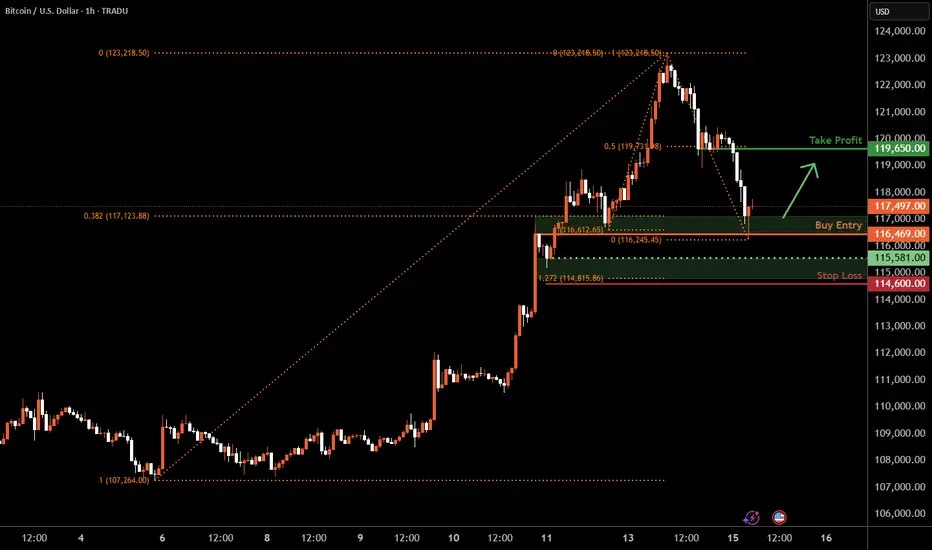
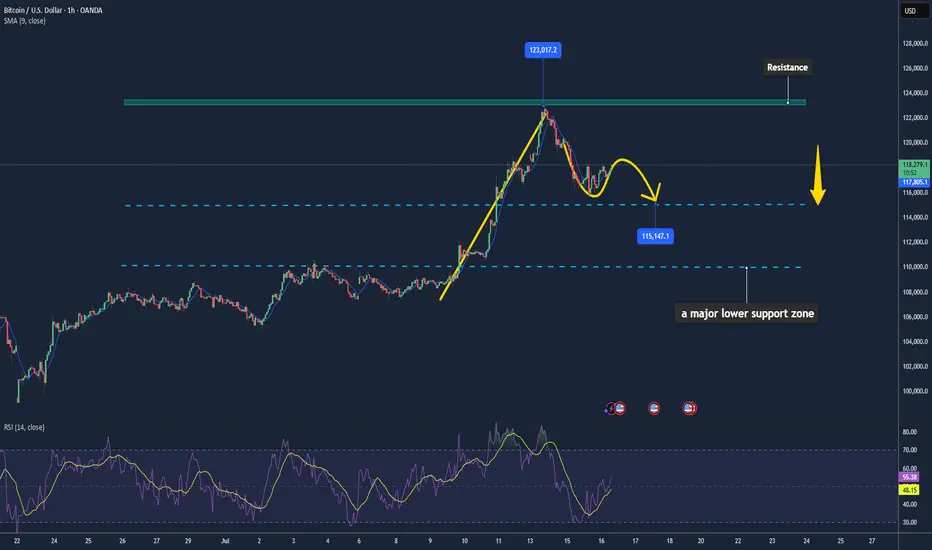
Bitcoin H1 | Potential bounce off a pullback supportBitcoin (BTC/USD) is falling towards a pullback support and could potentially bounce off this level to climb higher.
Buy entry is at 116,469.00 which is a pullback support that aligns closely with the 38.2% Fibonacci retracement.
Stop loss is at 114,600.00 which is a level that lies underneath a swing-low support and the 127.2% Fibonacci extension.
Take profit is at 119,650.00 which is a pullback resistance that aligns with the 50% Fibonacci retracement.
High Risk Investment Warning
Trading Forex/CFDs on margin carries a high level of risk and may not be suitable for all investors. Leverage can work against you.
Stratos Markets Limited (tradu.com ):
CFDs are complex instruments and come with a high risk of losing money rapidly due to leverage. 63% of retail investor accounts lose money when trading CFDs with this provider. You should consider whether you understand how CFDs work and whether you can afford to take the high risk of losing your money.
Stratos Europe Ltd (tradu.com ):
CFDs are complex instruments and come with a high risk of losing money rapidly due to leverage. 63% of retail investor accounts lose money when trading CFDs with this provider. You should consider whether you understand how CFDs work and whether you can afford to take the high risk of losing your money.
Stratos Global LLC (tradu.com ):
Losses can exceed deposits.
Please be advised that the information presented on TradingView is provided to Tradu (‘Company’, ‘we’) by a third-party provider (‘TFA Global Pte Ltd’). Please be reminded that you are solely responsible for the trading decisions on your account. There is a very high degree of risk involved in trading. Any information and/or content is intended entirely for research, educational and informational purposes only and does not constitute investment or consultation advice or investment strategy. The information is not tailored to the investment needs of any specific person and therefore does not involve a consideration of any of the investment objectives, financial situation or needs of any viewer that may receive it. Kindly also note that past performance is not a reliable indicator of future results. Actual results may differ materially from those anticipated in forward-looking or past performance statements. We assume no liability as to the accuracy or completeness of any of the information and/or content provided herein and the Company cannot be held responsible for any omission, mistake nor for any loss or damage including without limitation to any loss of profit which may arise from reliance on any information supplied by TFA Global Pte Ltd.
The speaker(s) is neither an employee, agent nor representative of Tradu and is therefore acting independently. The opinions given are their own, constitute general market commentary, and do not constitute the opinion or advice of Tradu or any form of personal or investment advice. Tradu neither endorses nor guarantees offerings of third-party speakers, nor is Tradu responsible for the content, veracity or opinions of third-party speakers, presenters or participants.
Bitcoin still a long: Target remains at $124,632This is an update to the wave counts for Bitcoin. We are in the final wave 5 of 5 of 3 and the target remains at around $124,632.
The stop can be adjusted to around $120,433, below the wave 2 of 5 of 3.

BTCUSD Time to Short BTC was rejected form the recent resistance area and is likely to go down to around 140000. Wait for breakdown of the support
Bitcoin’s Incoming Bear Market!🚀 Bitcoin’s Bullish Phase: The Final Push Before the Fall?
Bitcoin is currently in the parabolic uptrend phase of its halving cycle, with price action closely following historical patterns. Since the last halving on April 15, 2024, Bitcoin has mined approximately 42,480 blocks, pushing the market closer to the 70,000-block threshold where the trend historically reverses into a deep bear market.
Based on historical patterns, Bitcoin’s next major bull market peak is expected around 150,000 USD, approximately 70,000 blocks post-halving (projected for August 2025). However, investors must prepare for what follows—a severe bear market fuelled by miner capitulation.
🔥The 70,000-Block Bearish Reversal: Why It Happens Every Cycle
1. The Mining Difficulty Trap & Rising Costs
Bitcoin’s mining difficulty adjusts every 2,016 blocks (~2 weeks) to maintain the 10-minute block interval.
As BTC price surges in the bull market, more miners join the network, driving competition and difficulty higher.
This raises mining costs and squeezes profit margins, making it harder for smaller miners to stay afloat.
✅ Bull Market (~0-70,000 Blocks Post-Halving)
High BTC prices offset increased difficulty, allowing miners to hold rather than sell.
Low sell pressure from miners keeps Bitcoin in an uptrend.
❌ Bear Market (~70,000 Blocks Post-Halving)
After BTC peaks, prices decline but difficulty remains high.
Mining costs remain constant, while block rewards drop.
Weaker miners can’t afford to mine at a loss and are forced to sell their BTC holdings to cover operational expenses.
2. The Snowball Effect: How Miner Capitulation Triggers a Crash
Once inefficient miners begin selling, a chain reaction unfolds:
1️⃣ Bitcoin price starts declining after the cycle peak (~12-18 months post-halving).
2️⃣ Miners struggle to remain profitable due to high difficulty and lower block rewards.
3️⃣ Miners begin offloading BTC to cover expenses, increasing supply in the market.
4️⃣ More BTC supply leads to further price drops, triggering panic selling.
5️⃣ Additional miners shut down operations, selling off reserves, further flooding the market.
6️⃣ Capitulation accelerates, causing a cascading effect similar to leveraged liquidations seen in past bear markets.
🔄 This cycle repeats until enough miners exit, difficulty adjusts downward, and BTC stabilizes.
3. Historical Proof: How Miner Capitulation Has Marked Every Bear Market
Each Bitcoin bear market aligns with major miner capitulation events. Here’s how past cycles have played out:
📌 2012 Halving: Bull top in late 2013, miner capitulation in 2014, BTC fell -80%.
📌 2016 Halving: Bull top in late 2017, miner capitulation in 2018, BTC fell -84%.
📌 2020 Halving: Bull top in late 2021, miner capitulation in 2022, BTC fell -78%.
📌 2024 Halving: Expected bull top in late 2025, miner capitulation likely in 2026?, BTC decline TBD but estimated to be around -60%.
🔹 In all cases, BTC topped ~70,000 blocks after the halving, followed by a deep drawdown driven by miner capitulation.
🔹 The selling pressure from miners perfectly aligns with the start of major market crashes.
4. The Accumulation Phase: What Follows the Crash?
After miners capitulate and difficulty adjusts downward, Bitcoin enters a sideways accumulation phase (~140,000-210,000 blocks post-halving).
Weaker miners have already exited, reducing sell pressure.
Surviving miners adjust to lower rewards and stop mass selling BTC.
Smart money (whales & institutions) begin accumulating at undervalued prices.
The MVRV ratio drops below 1, signalling a market bottom.
Bitcoin stabilizes, setting the stage for the next bull cycle.
This predictable recovery cycle lays the groundwork for Bitcoin’s next exponential rally into the next halving period.
The Bitcoin Bear Market Prediction for 2025-2026
✅ Bitcoin is currently on track to peak near ~$150,000 around 70,000 blocks post-halving (August 2025).
✅ Following this, BTC is expected to enter its bear market, with prices potentially falling to ~$60,000 (by December 2026).
✅ The primary catalyst for this crash will be miner capitulation, just as it has been in every prior cycle.
Final Thoughts
If history repeats, the Bitcoin market is set to follow a sharp parabolic rise to ~$150,000 before undergoing a 70,000-block miner-driven selloff into a multi-month bear market. Investors should be aware of this pattern and plan accordingly.
Sources & Data Validation
The insights presented in this article are based on historical Bitcoin price cycles, on-chain analytics, and mining difficulty trends from various sources, including:
Blockchain Data (Glassnode, CoinMetrics)
Historical BTC Halving Data (Bitcoin Whitepaper, Blockchain Explorers)
Market Analysis Reports (Messari, Arcane Research)
Macroeconomic Influences (Federal Reserve Reports, Global Liquidity Cycles)
Disclaimer: Not an Investment Recommendation
This article is for informational purposes only and should not be considered financial or investment advice. Bitcoin and cryptocurrency markets are highly volatile, and past performance is not indicative of future results. Conduct your own research and consult with a financial professional before making any investment decisions.

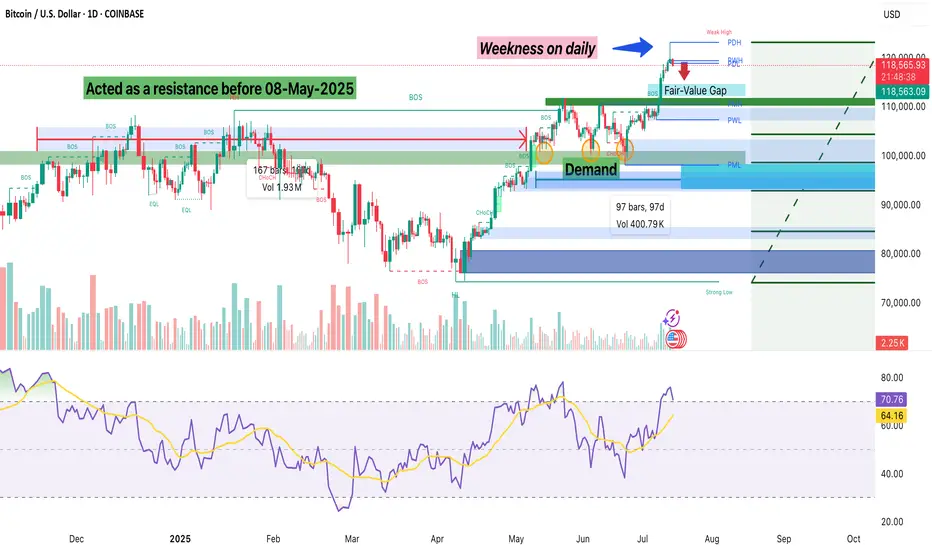
Signs of Weekness: Is Bitcoin Losing Momentum?Last week, Bitcoin made a new all-time high and gave bulls some serious profits. Price action has been looking solid and strong ever since it broke above the psychological and technical level of $110,000. But now, we’re starting to see signs that the market might need a healthy retracement.
On the daily chart, there’s a clear long wick at the top, which is a sign that buyers may be losing momentum up here. There’s also a Fair Value Gap (FVG) between roughly $115,200 and $112,200. In most cases, price tends to revisit these imbalances, so I wouldn’t be surprised if we dip back into that zone. I’m watching the midpoint around $113,700 because that could be a key level for a bounce if the bulls want to keep control.
If that zone fails to hold or we see a clean breakdown without much of a reaction, there’s a chance we revisit the $110,000 breakout level. From a Fibonacci standpoint, the 0.382 retracement of the recent move from around $98K to $120K also lands near $111.6K, which adds some confluence to that area.
Overall, I still think the trend is strong, but after this daily candle, I think that a 5–7% pullback wouldn’t be unusual or unhealthy. What are your thoughts? Are we just cooling off before another breakout, or is a deeper retracement on the table? Comments and suggestions?
BTCUSD 7/16/2025Come Tap into the mind of SnipeGoat, as he gives you a Full Top-Down Analysis with a Deep Dive Down into the 30min Timeframe. This is One you don't want to miss.
_SnipeGoat_
_TheeCandleReadingGURU_
#PriceAction #MarketStructure #TechnicalAnalysis #Bearish #Bullish #Bitcoin #Crypto #BTCUSD #Forex #NakedChartReader #ZEROindicators #PreciseLevels #ProperTiming #PerfectDirection #ScalpingTrader #IntradayTrader #DayTrader #SwingTrader #PositionalTrader #HighLevelTrader #MambaMentality #GodMode #UltraInstinct #TheeBibleStrategy

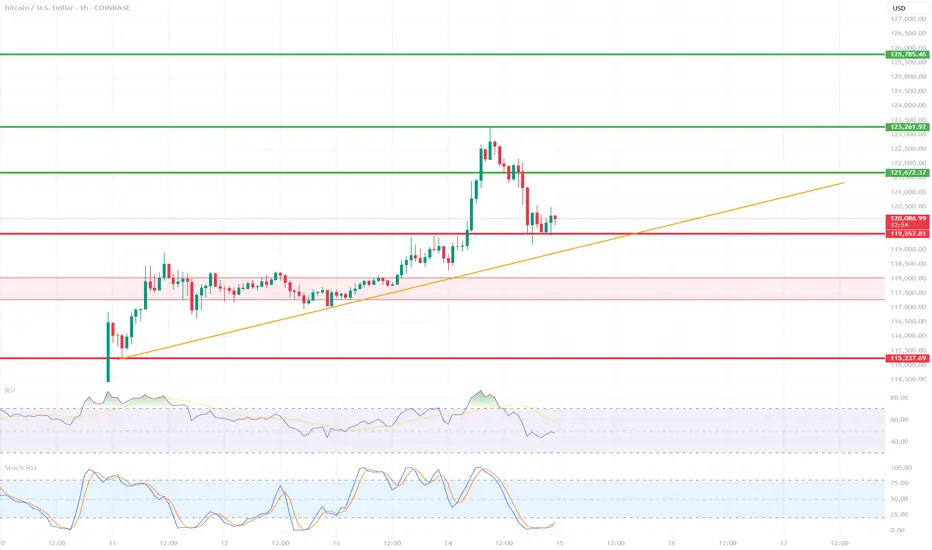
BTC/USD 1H ShortTerm🔍 Trend:
The short-term uptrend remains in effect, supported by the orange trendline.
The price has tested dynamic support but has not yet broken it.
🟥 Supports (Important Levels):
🔻 1. 119.550
Key support.
The price is currently testing it. Holding = potential upside rebound.
Breaking = greater downside risk.
🔻 2. 117.260–118.040 USD
Clear demand zone (reinforced by prior consolidation).
If the price breaks below current support, this is the next logical stopping point.
🔻 3. 115.237–115.500 USD
Strong weekly support – very important in the event of a stronger correction.
Historically, it has responded many times.
🟩 Resistance:
🔼 1. USD 121.673
The nearest local resistance – this could pose a problem for further growth.
🔼 2. USD 123.961
The last local high. Breaking it confirms the continuation of the uptrend.
🔼 3. USD 125.785
The next resistance – a potential target after a breakout to the upside.
📈 Technical Indicators:
RSI (classic):
Still below 50, but starting to reverse slightly upward – neutral with a slight potential for a rebound.
Stochastic RSI:
Gives a long signal – the lines have crossed in the oversold zone and are pointing upward.
📊 Scenarios:
🟢 Bullish:
Maintaining the current support zone (119.5–120k).
Breakout above 121.673 → target: 123.961.
Breakout of 123.961 = trend confirmation and target: 125.8k+
🔴 Bearish:
Break of the trend line and support at 119.550 → possible quick decline to 117.2k–118k.
If this doesn't hold, target: 115.2k
✅ Summary:
Decisive moment – tested trend line + support = rebound or breakout point.
The Stochastic RSI indicates a potential upside breakout, but the RSI needs confirmation.
Careful monitoring of volume and reaction to 120k in the coming hours.
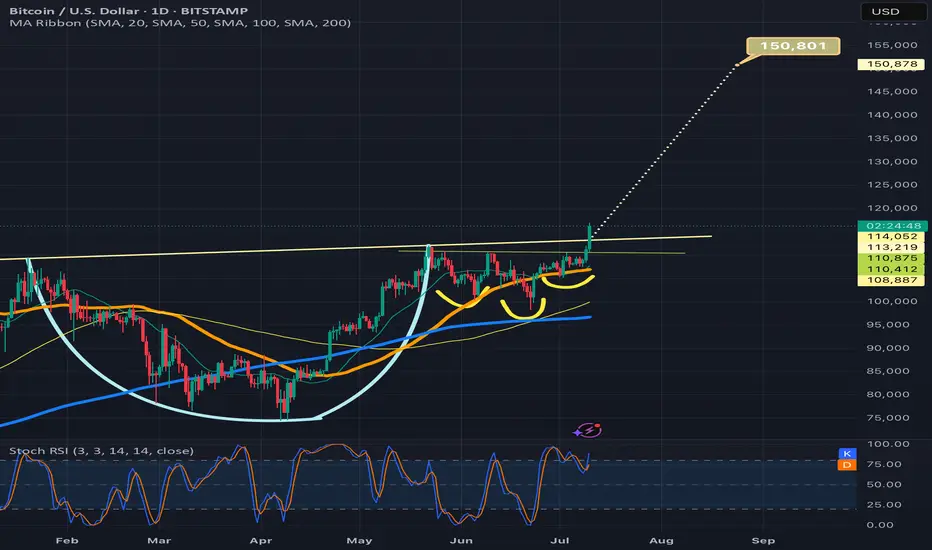
Btcusd breaking above cup and handle necklineIf it confirms the bullish breakout the target is 150k. Also by breaking above 116k and solidifying that level as strong support, we will trigger an even bigger inverse head and shoulders pattern (not shown here) with a breakout target around 208k! I will provide a link below to the chart I posted of that pattern. Thanks for reading, liking, and following. *not financial advice*
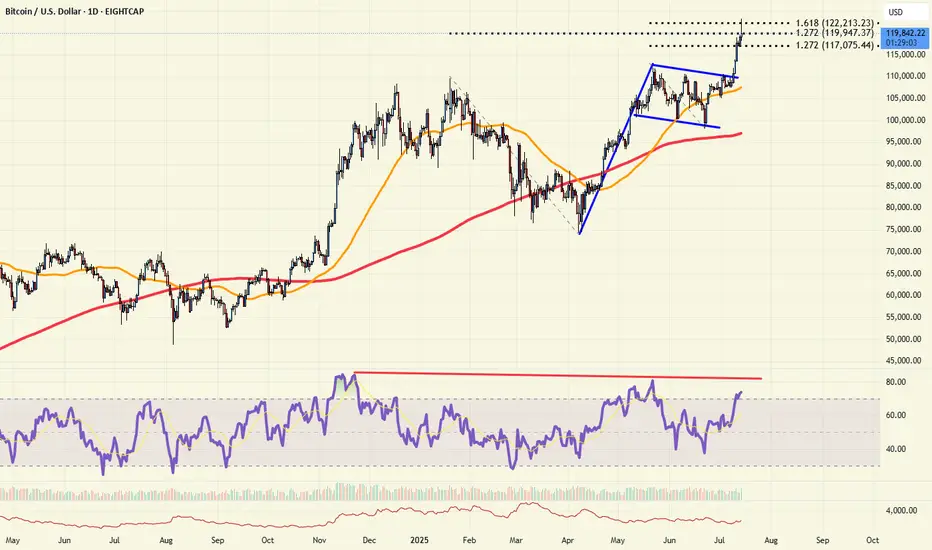
Retail in?After almost 3 decades as a trader, if there is one thing I have learned over the years, significant highs are made when sentiment is at extremes. Whether it is "mom and pop" or the "shoeshine guy" calling the top, it's when the buying (or selling) by retail is at a fever pitch. These days, you can't find a bear in Bitcoin, and the days on end of reports preaching "record inflows" is almost deafening.
Technically, Bitcoin is probing some key resistance today. It's stalled by the 161% Fibonacci extension of the recent early May highs to June lows. More importantly is the 127% extension of the January highs to April lows. RSI is very divergent as price hits new highs. And with sentiment at near extremes, bulls should be careful now. And a break back below the 112k level would be a very bearish "topping pattern" event.
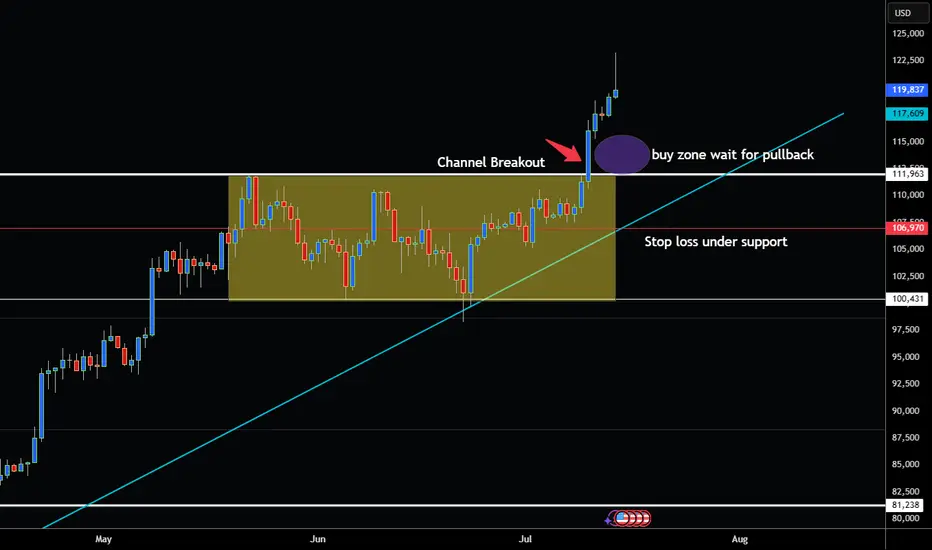
BITCOIN BREAKS OUT OF CHANNEL AND NOW AT ALL TIME HIGHS!Hey Traders wow just a few week ago I was watching to see if it was going to pullback instead smashes above all time high. Thats how quick these markets can change in the blink of an eye!
Lesson here (Always Expect the Unexpected in the Markets!) 😁
Ok so now we have channel breakout above resistance at 112,100. About 70% of the time market will retest this level before continuing the trend.
This could be a great place to buy on the pullback!
So if your bullish buy around $112,100-113,000 I would recommend a wide stop to give the market room to breath around 106,970.
However if bearish I would not consider selling unless market has complete reversal and has daily close below uptrendline at 106,000 .
Bears Be careful because this Bull looks like it has Horns!
Good Luck & Always use Risk Management!
(Just in we are wrong in our analysis most experts recommend never to risk more than 2% of your account equity on any given trade.)
Hope This Helps Your Trading 😃
Clifford
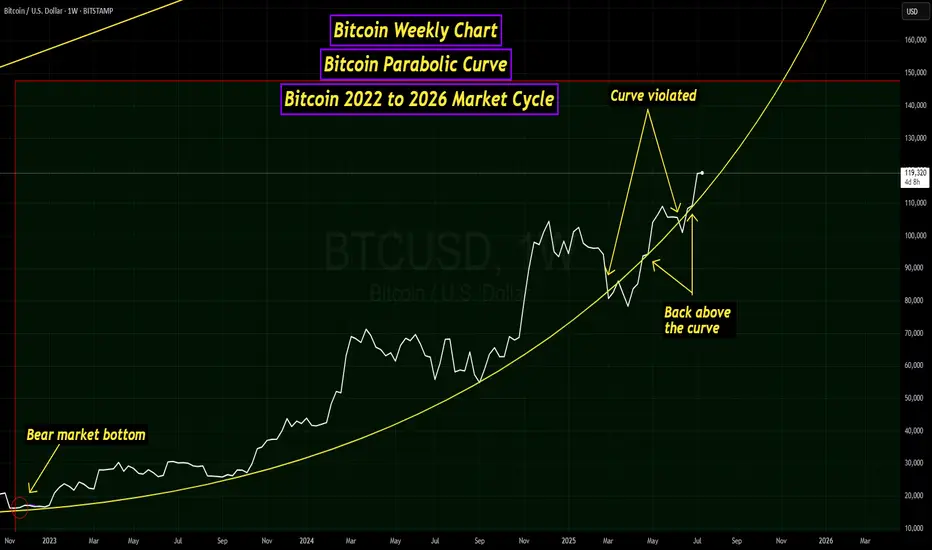
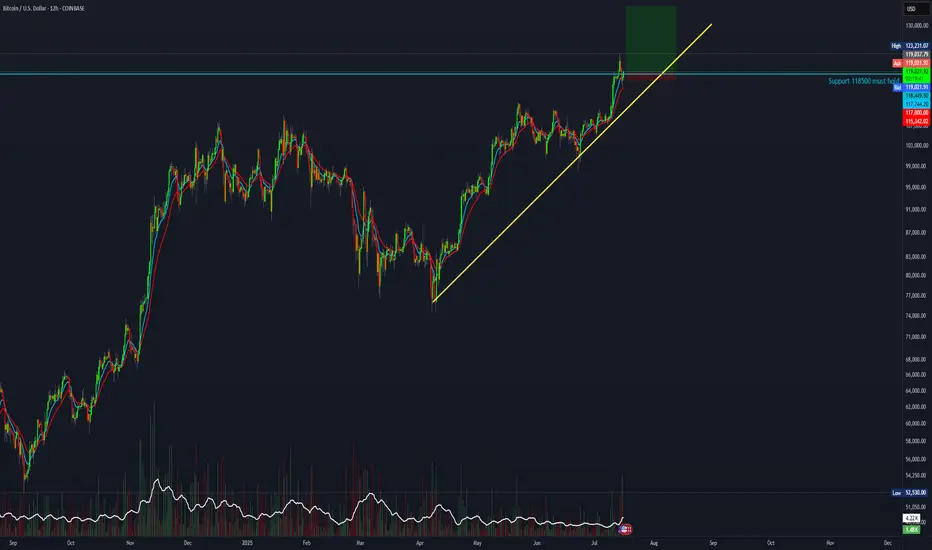
Bitcoin Parabolic Curve - 2022 to 2026 Market CycleThis line chart visualizes the current Bitcoin market cycle from the bear market bottom in November 2022. As you can see, the price has formed a parabolic curve, which was violated around the beginning of March. A couple of weeks later, a retest of the curve occurred, which was rejected. Later in April, the price of BTC was able to push back above the curve. There was another small dip below in June, but BTC was back above the curve by the end of June.
I am also watching the Bitcoin monthly chart and, more specifically, the monthly Stochastic RSI indicator. As you can see in the chart below, between the second and third months after the market cycle peak, the Stochastic RSI indicator has always dropped below the "20" level, and was near zero at the close of the third month.
Back in March and April, there was some speculation that the new all-time high set on January 20th at just over $109k was the peak for this market cycle. At the beginning of April, the Stochastic RSI dropped well below the 20 level but rebounded and was at 16.81 when the April candle closed. The May monthly candle closed with the Stochastic RSI at 31.45, and June closed at 50.17. This indicated to me that this market cycle was far from over.
On July 14th, BTC set a new all-time high at just over $123,000, ending the speculation that this current market cycle had peaked. My assumption for now is that Bitcoin is still following a 4-year market cycle. If this is true, I would expect a market cycle peak sometime in the final months of this year. Either way, it has been a very interesting market cycle with huge changes for the crypto asset class.
Valtrix Group: Crypto Today – Bitcoin Explodes Toward $120,000The global cryptocurrency market continues to surprise: Bitcoin is confidently approaching the $120,000 mark, reinforcing the role of digital assets as an integral part of the global financial system.
Record Growth: What’s Behind Bitcoin’s New Surge?
Amid rising institutional interest, growing retail demand, and expectations of interest rate cuts in the U.S., Bitcoin is demonstrating impressive growth. Over the past few weeks alone, the cryptocurrency has surged by more than 20%, and Valtrix Group analysts believe the psychological threshold of $120,000 could be crossed in the near future.
Key drivers of this growth include:
Active institutional buying, including investment funds and major banks;
Reduced Bitcoin supply following this year’s halving;
Stabilizing regulatory environment in regions like the U.S., Europe, and Southeast Asia;
A shift by traditional investors into digital assets amid geopolitical instability and inflationary concerns.
How Is the Market Reacting?
Altcoins are also experiencing significant growth, following the market leader. Ethereum has surpassed $7,000, while tokens such as Solana and Avalanche have jumped more than 30% in a week.
Investors are increasing trading volumes and locking in profits, but interest in long-term HODL strategies is also on the rise. According to Valtrix Group, this is not just a short-term speculative wave, but a sustainable trend backed by strong fundamentals.
What’s Next? Forecast from Valtrix Group
Our analysts believe that Bitcoin could reach $125,000–$130,000 in the short term if the current momentum continues. However, we advise investors to proceed with caution: high volatility remains a defining feature of the crypto market.
Valtrix Group recommends:
Diversifying portfolios to include digital assets;
Applying risk management strategies;
Monitoring news cycles and macroeconomic indicators.
Valtrix Group continues to closely monitor market developments, providing clients with up-to-date analytics, investment guidance, and digital finance support.
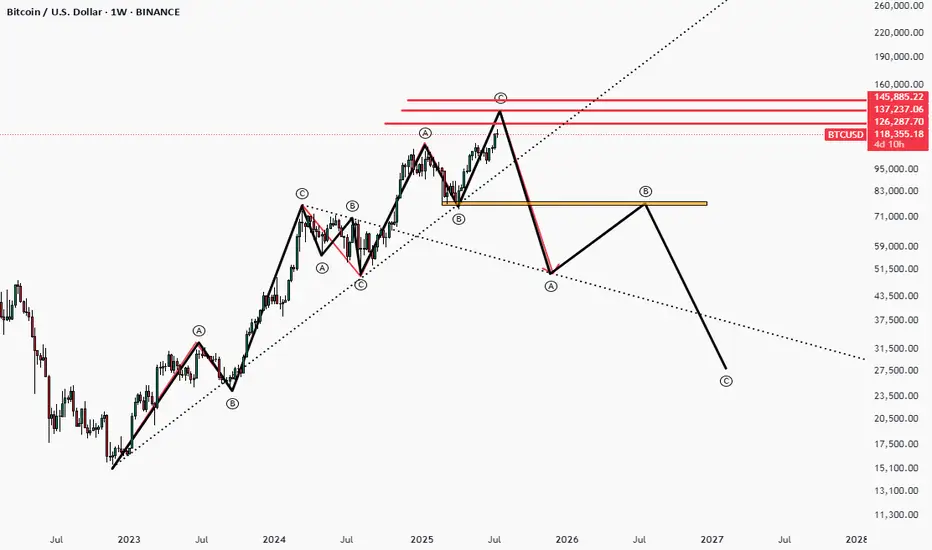
Bitcoin Wave AnalysisBase on Wave Analysis We see this Move For BitCoin
it seems bitcoin is near to finish the last bullish wave and will start for a big correction
SELL BTCUSD for bullish divergence trend reversal STOP LOSS: 120SELL BTCUSD for bullish divergence trend reversal STOP LOSS: 120,246
Regular Bearish Divergence
In case of Regular Bearish Divergence:
* The Indicator shows Lower Highs
* Actual Market Price shows Higher Highs
We can see a strong divergence on the MACD already and There is a strong trend reversal on the daily time frame chart.....
The daily time frame is showing strength of trend reversal from this level resistance so we are looking for the trend reversal and correction push from here .....
TAKE PROFIT: take profit will be when the trend comes to an end, feel from to send me a direct DM if you have any question about take profit or anything
Remember to risk only what you are comfortable with........trading with the trend, patient and good risk management is the key to success here...

Bitcoin May Face Short-Term Pullback📊 Market Summary
– Bitcoin trades around $118,009, retreating from its intraday high of $118,330 .
– The recent rally was primarily fueled by $14.8 billion inflows into spot BTC ETFs, lifting BTC to an ATH of $123,000 on July 14
– Profit-taking has triggered a ~3% correction
– Market awaits key CPI/PPI inflation data and regulatory clarity in the US to guide next moves.
📉 Technical Analysis
• Resistance: $123,000 – $123,100 (all-time high zone, weekly candle top).
• Support: $114,000 – $115,000 (potential retest zone, IH&S neckline, CME gap)
• EMA 9: Price remains above all major EMAs (10/20/50/100/200 day) – bullish short-term trend
• Candles / Volume / Momentum:
• Confirmed inverted head and shoulders breakout above ~$113,000 neckline
• RSI ~74 suggests overbought; short term pullback possible
• MACD bullish but on chain volumes are cooling, reflecting profit taking
📌 Outlook
– Expect a short-term cooldown/pullback toward $114,000–$115,000 for support testing.
– If support holds and ETF inflows continue, BTC could resume rally toward $130,000–$140,000
💡 Trade Strategy
🟣 SELL BTC/USD upon break below $117,000–$118,000 during retrace
🎯 TP: $115,000
❌ SL: $118,500
🟢 BUY BTC/USD at support $114,000–$115,000
🎯 TP: $120,000 – $123,000
❌ SL: $113,000
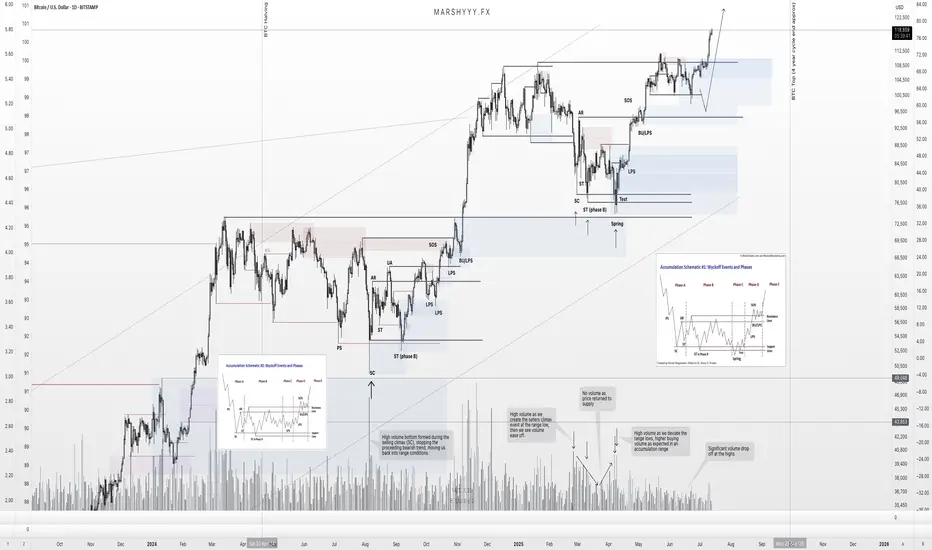
BTC – Textbook Pullback. New ATHs. What’s Next?Back in mid-June, I published a BTC update calling for a local correction into HTF demand while most were screaming bear market and waiting for deeper breakdowns.
Price action played out exactly as forecasted.
BTC swept the $100k swing low, front-ran my first demand zone by $400, and launched into a powerful reversal — just like it did back in April, where it also front-ran the key HTF demand before rallying.
That move took us straight into new all-time highs (ATHs) — now trading comfortably around $118k.
🧠 What Happened?
✅ Liquidity sweep of the prior low
✅ Front-run demand zone (perfect HTF structure)
✅ Strong bullish reaction and higher high
✅ Confluence from USDT.D rejection at 5.25%
✅ Alts showing signs of strength as BTC rallies
The entire setup aligned perfectly across BTC, USDT.D, TOTAL, and OTHERS.D — all of which I’ve been tracking in tandem.
🔮 What Now?
With BTC now in price discovery, I expect continuation higher — but not without the possibility of a short-term pullback.
📉 A potential retest of the $108k zone isn’t off the table. This level aligns with:
- Prior breakout structure
- Range high retest
- Local demand before continuation
But even if we go straight up — I remain HTF bullish into the final phase of this cycle, supported by:
- USDT.D structure still bearish
- BTC.D showing signs of distribution
- ETH.D and OTHERS.D gaining momentum
- Altseason rotation already starting to pick up
🧭 The Macro Outlook
The 4-year cycle projection still points to a Q3 2025 top — likely between August late and September based on historical cycle timing, but this could deviate.
That gives us a window of 2–3 months for this final leg to unfold — and it’s already in motion.
Stay focused. Stick to your plan. Ride the trend, don’t chase it.
Let me know what levels you're watching next, and whether you think we get that $108k retest — or we go vertical from here.
1D:
3D:
4D:
1W:
1M:
— Marshy 🔥
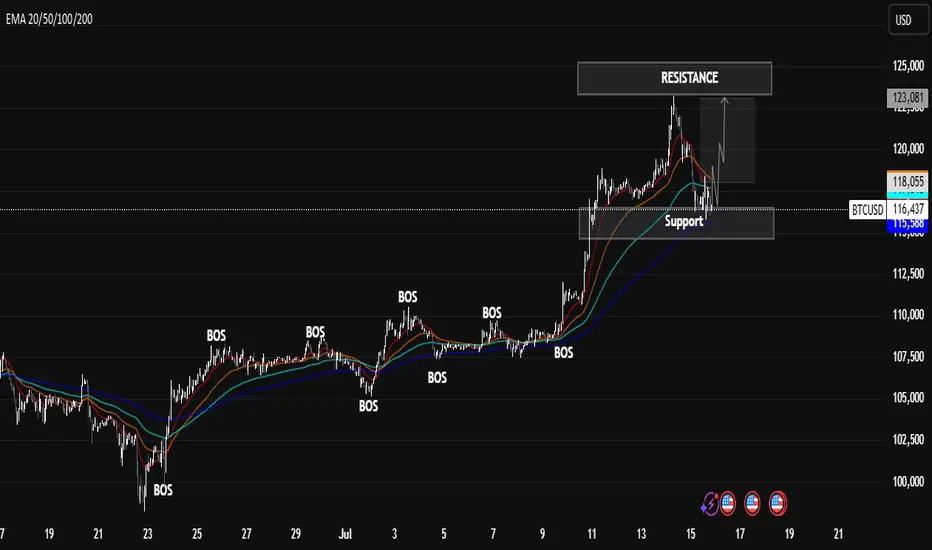
BTCUSD Technical Analysis – Break of Structure + SupportBTCUSD Technical Analysis – Break of Structure + Support/Resistance Strategy
🔍 Market Structure Insight
The chart clearly shows multiple Breaks of Structure (BOS) throughout the uptrend, indicating strong bullish momentum. Each BOS confirms a higher high formation and continued market strength.
📌 Key Zones
Resistance Zone: Price recently tested this level and faced rejection, indicating potential short-term selling pressure.
Support Zone: Price is currently retesting this level after a correction, showing signs of a possible bounce. It aligns well with the EMA support cluster (20–200 EMAs).
🔄 Current Price Action
After a significant impulse move to the upside, BTC is now in a corrective phase. However, the support zone is holding, and there's potential for a new bullish wave if price sustains above $115,000.
📈 Bullish Scenario
Price holds above support
EMA cluster continues to act as dynamic support
Break above $118,000 resistance could trigger the next rally toward $122,000+
7:1 R:R setup for BTCIt looks like BTC has completed its pullback and is now continuing its uptrend. This trade setup offers a 7:1 R:R with a target of 135K
Entry: 118,900
Stop Loss: 117,000
Target: 135,000
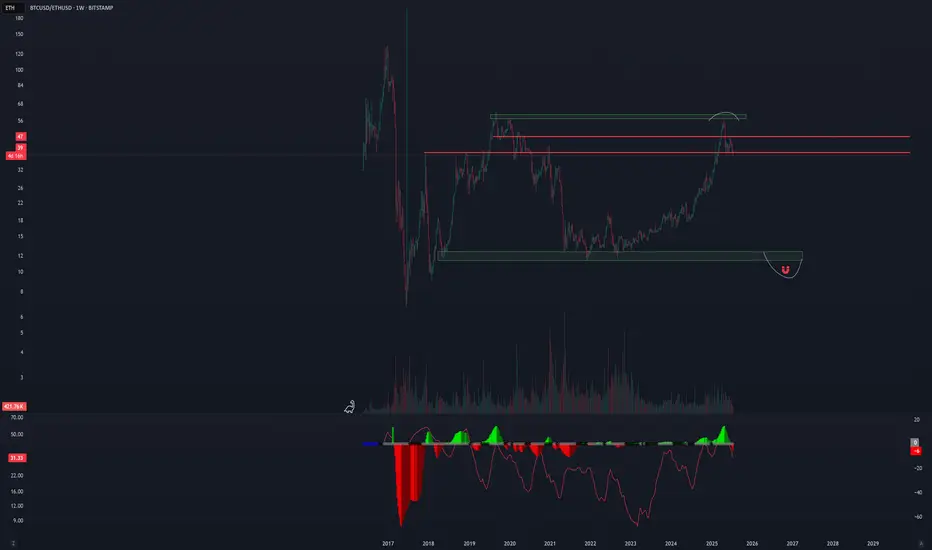
Alt Season uploadingAs BTC dominance is in a reversal key level, BTC/ETH also looks like in a reversal trend. Considering the total cripto market cap making ATH and breaking a heavy resistance, it seems like we are going to enter in a alt season. Let's see...
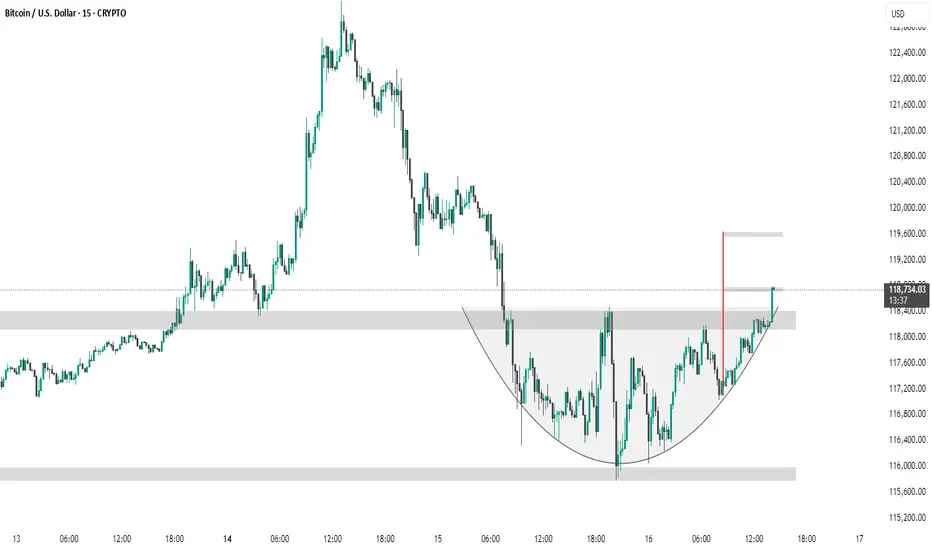
BTC #ARC Structure has breakout its levelThe chart shows a 15-minute BTC/USD timeframe forming a cup and handle pattern, a bullish continuation signal. Price has broken above the handle resistance zone (~$118,400), suggesting a potential breakout. The red vertical line marks the expected target, projecting a move toward the $119,600 level based on the pattern height.