BTC setup looks good for 5R.Looks like BTC is about to make another leg up toward 135K. Playing a 5:1 R:R on this setup
Entry: 119,000
Stop Loss: 116,000
Target: 135,000
BTCUSD.P trade ideas

BITCOIN RESULTS Bitcoin has respected the analysis and held very well it’s been following the trend and can partial close some positions and wait for a nice pullback to buy the dip
Bitcoin Beneath the Arc of Silence - Structural Faith, Tactical?⊢
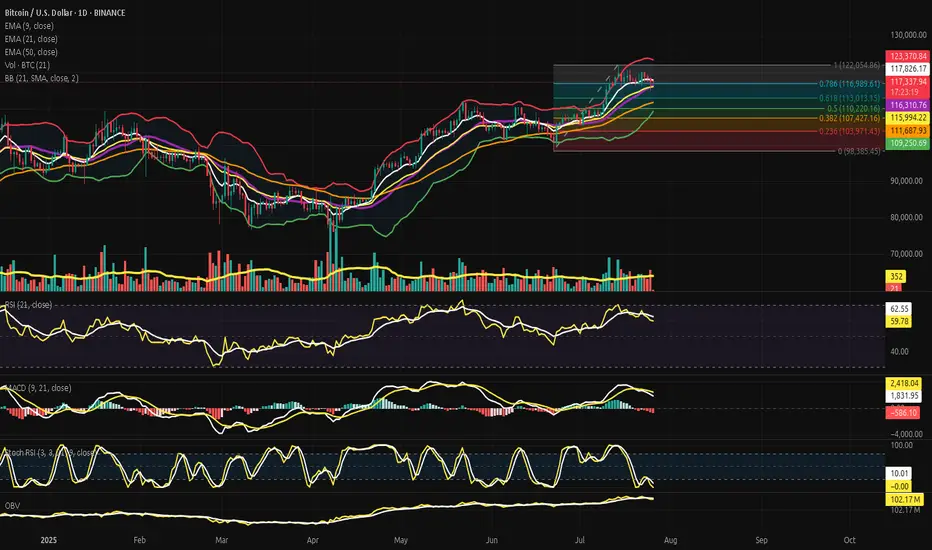
⟁ BTC/USD - BINANCE - (CHART: 1D) - (July 26, 2025).
◇ Analysis Price: $117,421.02.
⊣
⨀ I. Temporal Axis - Strategic Interval - (1D):
▦ EMA9 - ($117,842.79):
∴ The EMA9)is currently positioned at $117,842.79, slightly above the price ($117,421.02), acting as immediate dynamic resistance;
∴ Price has closed below EMA9 for multiple sessions, indicating a fading short-term momentum arc;
∴ The slope of the EMA9 is flattening, signaling an inflection zone rather than active thrust.
✴️ Conclusion: The short-term control line has been lost tactically; a sign of momentum exhaustion but not structural breakdown.
⊢
▦ EMA21 - ($116,001.77):
∴ EMA21 stands at $116,001.77, serving as an intermediate-range support below current price;
∴ The slope remains positive, providing a second-layer bullish structure after the loss of EMA9;
∴ Price has not tested EMA21 since early July - proximity implies possible gravitational pull.
✴️ Conclusion: EMA21 is the next defense line in a suspended structure, acting as the center of tactical compression.
⊢
▦ EMA50 - ($111,691.19):
∴ EMA50 sits at $111,691.19, aligned closely with the (0.236 Fibonacci) and historical cluster zone;
∴ Price has remained well above this level for over 30 sessions;
∴ The slope is clearly positive, marking macro structural support.
✴️ Conclusion: EMA50 represents the last reliable arc before macro invalidation. Its integrity maintains the long-term bullish thesis.
⊢
▦ Fibonacci Retracement:
∴ Retracement is correctly anchored: 1.0 = $122,054.86 (ATH) / 0.0 = $98,385.45 - (June 22 low);
∴ Price currently oscillates within the 0.618–0.5 zone ($113k–$110k), the classical golden pocket;
∴ The golden pocket aligns closely with EMA21 and the Bollinger mean, forming a triple confluence zone.
✴️ Conclusion: Price is inside the Fibonacci heart of reaccumulation - ideal for breakout setups or breakdown invalidation.
⊢
▦ Bollinger Bands (21, 2.0):
∴ The upper band is at $123,377.19, while the middle band rests at $116,314.72;
∴ Price is between the middle and upper bands, consolidating after rejection from the upper line;
∴ The bands are narrowing, indicating a volatility contraction cycle.
✴️ Conclusion: Bollinger geometry confirms volatility suppression, aligning with RSI and MACD flattening - a signal of impending release.
⊢
▦ RSI (21) + EMA9:
∴ RSI is at (59.99), slightly under its EMA9 - (62.59), showing momentum erosion without collapse;
∴ The RSI has declined from the high 70s in late June, signaling tactical cooling;
∴ Remaining above 50 preserves structural bullish bias.
✴️ Conclusion: RSI is in tactical descent, but not structurally bearish - neutral-to-bullish compression.
⊢
▦ MACD (9,21):
∴ MACD line is below signal line, currently at (1,841.01) vs (2,419.86), confirming a bearish cross;
∴ Histogram prints red for several sessions, with fading amplitude;
∴ Despite the crossover, MACD remains in positive territory, indicating soft correction, not trend reversal.
✴️ Conclusion: MACD confirms a tactical retracement, aligned with RSI weakness, yet within bullish context.
⊢
▦ Stochastic RSI (3, 3, 21, 9):
∴ Current value is 0.00, denoting extreme oversold conditions;
∴ Multiple sessions have closed at this level without relief;
∴ Historically, flatlines at 0.00 often precede upward jolts.
✴️ Conclusion: Stoch RSI indicates exhaustion of momentum - potential for rebound or failed bounce.
⊢
▦ Volume + EMA21:
∴ Volume on current sessions is below the 21-period EMA, confirming absence of strong sell-side dominance;
∴ No abnormal spikes or climaxes are visible - neither panic nor breakout yet;
∴ Volume profile aligns with Bollinger contraction.
✴️ Conclusion: Quiet volume supports the thesis of controlled tactical consolidation, not distribution.
⊢
▦ OBV + EMA9:
∴ OBV stands at 102.17M, flatlined with EMA9;
∴ No divergence detected relative to price;
∴ Momentum of accumulation remains static but not deteriorating.
✴️ Conclusion: OBV is in neutral stance, neither confirming breakout nor selloff - favors tactical patience.
⊢
🜎 Strategic Insight - Technical Oracle:
∴ Bitcoin is suspended in a compressed volatility range beneath its local high, resting upon layered support zones defined by EMA21, Bollinger median, and the Fibonacci golden pocket (0.618–0.5);
∴ Momentum indicators (RSI, MACD, Stoch RSI) are all in tactical decline, yet no structure has been broken - price still floats above all macro EMA's (21, 50) with OBV unshaken;
∴ The short-term weakness is absorbed within a higher-order structural integrity, suggesting latent potential awaiting a fundamental catalyst.
✴️ Conclusion: The oracle observes a coiled market, technically restrained but not structurally broken - an archetype of Strategic Suspension Beneath the Arc of Silence.
⊢
∫ II. On-Chain Intelligence - (Source: CryptoQuant):
▦ Exchange Netflow Total + 9EMA - (All Exchanges):
∴ The current netflow is (-864.6 BTC), remaining firmly below its EMA9 baseline;
∴ The 9-day moving average of netflows is flat-to-negative, signaling persistent withdrawal pressure from exchanges;
∴ Sustained negative netflows in conjunction with a stable price floor indicate non-speculative cold storage behavior.
✴️ Conclusion: Netflow structure is bearish for exchanges, but bullish for long-term price, as BTC flows into private custody.
⊢
▦ Miner to Exchange Flow + 9EMA - (All Miners):
∴ Current flow from miners hovers near 1.2K BTC/day, well below the EMA9 which trends above 3K;
∴ The flow has not pierced its EMA9 in recent weeks, despite BTC testing local highs - a strong non-distribution signal;
∴ The divergence between low miner outflows and high price resilience confirms supply-side discipline.
✴️ Conclusion: Miner flows remain suppressed beneath EMA9 - a structurally bullish posture amid local consolidation.
⊢
▦ Funding Rate + 9EMA - (All Exchanges):
∴ The funding rate is (+0.012), sitting above its EMA9, indicating a minor long bias across derivatives markets;
∴ There is no spike or deviation suggesting leveraged imbalance - the slope of the EMA9 remains shallow;
∴ Funding above EMA9, with RSI and MACD fading, implies a passively bullish positioning without euphoria.
✴️ Conclusion: Funding is technically constructive, aligned with healthy sentiment - not overheated, nor bearish.
⊢
▦ Spent Output Profit Ratio - (SOPR) + 9EMA - (Adjusted):
∴ The SOPR stands at 1.016, maintaining a position above its 9-day EMA;
∴ No dip below 1.0 has occurred in recent sessions, showing that BTC is being transacted in profit;
∴ EMA(9) acts as a median around 1.0 - a psychological pivot between profit realization and capitulation.
✴️ Conclusion: SOPR above EMA9 confirms a healthy trend, with profits being realized in harmony - not desperation.
⊢
🜎 Strategic Insight - On-Chain Oracle:
∴ All four on-chain pillars - Exchange Netflow, Miner Flow, Funding, SOPR - operate in favor of structural continuation, with none indicating exhaustion or distribution;
∴ The alignment of each indicator above or below EMA9 in the appropriate direction (accumulation vs euphoria) forms a cohesive bullish framework;
∴ The lack of pressure from miners, and the smooth funding environment, give room for technical consolidation to mature without triggering panic.
✴️ Conclusion: The oracle discerns a hidden current of strength, buried beneath the tactical mist. Structural forces remain aligned with continuation - though the flame is dimmed, it is not extinguished.
⊢
⧉ III. Contextvs Macro-Geopoliticvs - (July 25, 2025):
▦ 10:00 AM - Core Capital Goods Orders - (Durable Goods excl. Defense & Aircraft):
∴ The index, a proxy for business investment, contracted by (-0.7%) in June - the sharpest monthly decline of the year;
∴ This marks a decisive loss of momentum in private-sector expansion;
∴ While shipments rose slightly (+0.4%), the delta is attributed to inflation, not demand.
✴️ Conclusion: The business sector shows signs of hesitation, reinforcing the case for policy accommodation.
⊢
▦ 14:30 PM - Trump's Visit to the Federal Reserve - (Rare Executive Intervention):
∴ President Trump visited Powell directly, urging him to cut interest rates to "save the American engine";
∴ Powell responded with a carefully chosen phrase: “The country is doing really well” - read by markets as passive affirmation;
∴ This act marks a rare intrusion into Fed independence, adding political volatility to monetary policy expectations.
✴️ Conclusion: The Fed is now politically cornered, caught between inflation resilience and political coercion.
⊢
▦ 16:00 PM - Market Response & Euphoria Spike:
∴ U.S. indices - S&P 500, Nasdaq, Dow Jones - all reached all-time highs on the back of Powell's phrase and Trump’s pressure;
∴ Approximately 80% of S&P companies beat earnings expectations, providing fuel to the narrative;
∴ Market interpreted silence as assent, reactivating the “Fed put” theory.
✴️ Conclusion: Markets responded as if Powell had already signaled rate cuts, despite no formal commitment.
⊢
▦ 18:00 PM - Rate Cut Probability Assessment - (CME/FedWatch):
∴ Probability of a rate cut in September rose to (61.8%), precisely echoing the Fibonacci retracement now governing Bitcoin price;
∴ This alignment signals macro-on-chain-temporal resonance;
∴ Powell reiterates data dependency - no promises, but full optionality.
✴️ Conclusion: The macro veil is thin - policy pivot is anticipated, but not yet manifest. Tactical patience is vital.
⊢
🜎 Strategic Insight - Macro Oracle:
∴ Economic data weakens subtly;
∴ Political pressure intensifies;
∴ Market euphoria resurfaces on whispers, not substance.
∴ The silence of Powell is being interpreted, not spoken - a dangerous act of collective projection.
✴️ Conclusion: The Fed speaks in veils - and markets trade in illusions. The macro climate is now psychologically unstable, but not yet structurally broken.
⊢
𓂀 Stoic-Structural Interpretation:
▦ Structurally Bullish - Tactically Suspended:
∴ Price action remains well supported above all macro EMA's (21, 50), the OBV is intact, and no distribution signals are present;
∴ Momentum indicators (RSI, MACD, Stoch RSI) confirm a tactical cooldown, not collapse;
∴ On-chain fundamentals (Netflows, Miner Behavior, SOPR, Funding) remain constructively aligned.
✴️ Conclusion: Structurally, the market preserves a bullish foundation, while tactically locked in volatility suppression and directional indecision.
⊢
▦ Tactical Range Caution:
∴ Resistance: $123,377.19 (Upper BB), then $126,000 (local expansion);
∴ Pivot: $117,800 (EMA9) / $116,000 (EMA21);
∴ Support: $113,013.15 (Fibonacci 0.618), $111,691.19 (EMA50), then $107,400 (macro reversal threshold).
✴️ Conclusion: Tactical range is compressed within a ($116K-$123K) gate. Below $111K triggers macro risk.
⊢
◩ Codicillus Silentii - Strategic Note:
∴ In the breath between policy and projection, the markets chant futures yet unspoken.
BTC rests not in fear, nor in hope - but in silence.
✴️ Final Seal: The arc is intact. The veil has not fallen. Patience is power.
⊢
⧉
· Cryptorvm Dominvs · MAGISTER ARCANVM · Vox Primordialis ·
⚜️ ⌬ - Silence precedes the next force. Structure is sacred - ⌬ ⚜️
⧉
⊢
BTC USD LONG SETUPHI
IN THE LAST FORCAST WE WAS bulish on BTC
after hiting the weekly BISI and giving us a 4 h CISD
i put my entry on market at the open on the 4h CANDLE
sl swing low
target 1/2-1/3

BTC LONG SWING ENTRY OFF PREVIOUS LOW AREASWe are looking to make a BTC long entry on previously supported levels using just chart analysis. Looking at a rebound on a daily actual range trade where add on possible reversal and scale out into the a new local high.
In short, buying the gold, adding in the blue, scaling out into the green.
As you can see been a while so playing this small, getting back into the action

Why Bitcoin's Bull Run Hits a WallBitcoin's Bull Run Hits a Wall: A Deep Dive into the $115K Correction, Record Leverage, and the Battle for Market Control
A sudden and violent tremor has shaken the cryptocurrency market to its core. After a period of quiet range-bound trading, Bitcoin has decisively moved from consolidation to a sharp correction, plunging below the critical $116,000 support level and briefly touching $115,000. The abrupt downturn triggered a "bloodbath for crypto longs," liquidating hundreds of thousands of traders and wiping out nearly $600 million in leveraged positions. Yet, as the dust settles, a complex and contradictory picture emerges. While institutional sell-offs and cascading liquidations paint a grim short-term picture, record-high open interest, significant liquidity grabs, and bullish on-chain signals suggest the long-term uptrend may be far from over. This article delves into the anatomy of the crash, the forces that fueled it, and the fierce battle between bearish catalysts and bullish undercurrents that will define Bitcoin's next move.
Part 1: The Anatomy of the Correction - From Sideways to Sell-Off
For weeks, Bitcoin's price action was characterized by consolidation, a phase where an asset trades within a defined range, reflecting market indecisiveness. After a strong upward trend that pushed Bitcoin to new highs above $120,000, this period of sideways movement was seen by many as a healthy pause before the next leg up. However, this placid surface masked building pressure. The transition from this consolidation phase to a full-blown correction was swift and brutal.
A market correction is defined as a rapid price change, often a decline of at least 10% but less severe than a crash, that disrupts an asset's prevailing trend. The recent tumble below $116,000 fits this description perfectly. The sell-off was not a gradual slide but a violent dislocation, breaking through established support levels and triggering a wave of panic.
This dramatic shift was exacerbated by several key factors. On-chain data revealed that a significant institutional player, Galaxy Digital, unleashed a massive sell-off, reportedly moving billions in Bitcoin to exchanges. This sudden injection of supply into the market acted as a powerful catalyst, overwhelming buy-side pressure and initiating the downward price spiral. The market's reaction was immediate, with the price slicing through the psychological support at $116,000 and heading towards the next major liquidity zone around $115,000.
Part 2: The Cascade - A $600 Million Bloodbath for Leveraged Traders
The speed of the price drop had a devastating impact on the derivatives market, a space where traders use borrowed funds to amplify their bets on price movements. The sudden downturn resulted in one of the most significant liquidation events in recent memory, with 213,729 traders liquidated for a total of nearly $600 million over a 24-hour period.
What is a Liquidation?
In crypto futures trading, liquidation is the forced closure of a trader's position by an exchange. This happens when a trader can no longer meet the margin requirements for their leveraged position, meaning their collateral is insufficient to cover their mounting losses. For example, a trader using 20x leverage on a $1,000 position controls $20,000 worth of Bitcoin. However, a mere 5% price move against them can wipe out their entire initial capital, triggering a liquidation.
The recent event was a "bloodbath for crypto longs," meaning traders who had bet on the price of Bitcoin increasing were the primary victims. As the price fell, these long positions became unprofitable, and once they crossed their liquidation price, exchanges automatically sold the collateral on the open market to cover the losses.
This process created a deadly feedback loop known as a liquidation cascade. The first wave of forced selling from liquidated longs added more downward pressure on the price. This, in turn, pushed the price down further, triggering the liquidation of another set of long positions whose liquidation prices were slightly lower. This domino effect—where liquidations cause lower prices, which in turn cause more liquidations—is what transforms a standard price dip into a violent market crash. This automated, rapid chain reaction is a hallmark of the highly leveraged and volatile crypto markets.
Part 3: The Fuel for the Fire - Open Interest Reaches a Record $44 Billion
Underpinning this massive liquidation event was an unprecedented buildup of leverage in the market, best measured by a metric called Open Interest (OI). Open Interest represents the total number of active or unsettled futures contracts in the market. It’s a measure of the total capital and number of positions committed to the derivatives market, distinct from trading volume, which counts both opened and closed positions. An increase in OI signifies that new money and new positions are entering the market, often leading to higher volatility.
In a stunning development, as Bitcoin's price began to plunge, the total Open Interest surged to a new all-time high of $44 billion. This unusual divergence—where price falls while open interest rises—suggested that a significant number of new short positions were being opened to bet against the market, while many longs remained trapped, hoping for a reversal. This created a powder keg of leverage.
Further fueling this was a notable surge on the world's largest crypto exchange. On-chain data showed that traders added 10,000 Bitcoin worth of open interest to the BTCUSDT perpetual contract on Binance alone. This single-day surge in open interest on a key trading pair signaled a massive influx of speculative capital.
High open interest acts as fuel for volatility. With so many leveraged contracts open, any sharp price movement can trigger the kind of cascading liquidations that were just witnessed. The record-breaking $44 billion in open positions meant the market was more susceptible than ever to a violent deleveraging event.
Part 4: The Big Players - A Tale of Two Whales
The recent market turmoil cannot be fully understood without examining the actions of its largest participants: the whales and institutions. Their movements often create the initial waves that retail traders are forced to navigate.
On the bearish side, the primary catalyst for the sell-off appears to be Galaxy Digital. The digital asset financial services firm was observed moving tens of thousands of Bitcoin, worth billions of dollars, to centralized exchanges. These flows were reportedly part of a larger liquidation of holdings from a dormant "Satoshi-era" whale, with Galaxy acting as the intermediary to facilitate the sale. By strategically offloading such a massive amount, even if through over-the-counter (OTC) desks to minimize initial impact, the sheer volume of sell pressure eventually spilled into the public markets, triggering the correction. The firm's subsequent withdrawal of over a billion dollars in stablecoins from exchanges further suggests a large-scale profit-taking or strategic de-risking maneuver.
However, this institutional selling pressure is contrasted by a powerful bullish undercurrent. Even as the market reeled, other large players were making bold, long-term bets. Reports surfaced of a significant whale bet on Bitcoin reaching a staggering $200,000 by the end of the year. This dichotomy highlights the deep division in market sentiment. While some large entities are taking profits or repositioning, others view this correction as a prime accumulation opportunity, demonstrating unwavering conviction in Bitcoin's long-term trajectory.
This clash of titans—the institutional seller and the long-term bullish whale—defines the current market structure. The price is caught in a tug-of-war between immediate, heavy supply and deep-pocketed, long-term demand.
Part 5: Reading the Tea Leaves - A Healthy Reset or the Start of a Bear Market?
While the headlines scream "bloodbath" and "crash," a deeper analysis of market mechanics and on-chain data offers a more nuanced perspective. Several key indicators suggest that this brutal pullback, while painful, may be a healthy reset rather than the beginning of a sustained bear market.
Argument 1: The Pullback Remains Within Normal Volatility Range
Bitcoin is notoriously volatile, and sharp corrections are a historical feature of its bull markets. Drawdowns of 30-40% have been common pit stops during previous bull runs. While a drop from over $120,000 to $115,000 is significant, analysts point out that such moves are not out of character for the asset. Historically, major cycle-ending bear markets have seen drawdowns exceeding 75-80%. In contrast, mid-cycle corrections serve to wipe out excess leverage, shake out weak hands, and build a more sustainable foundation for future growth. This event, though severe for leveraged traders, may fall into the category of a standard, albeit sharp, bull market correction.
Argument 2: A Necessary Liquidity Grab
Sophisticated market analysis suggests the plunge below $115,000 was a textbook liquidity grab. This is a maneuver, often initiated by large players or "smart money," where the price is intentionally pushed to a level where a high concentration of stop-loss and liquidation orders are known to exist. By triggering these sell orders, large buyers can absorb the resulting liquidity to fill their own large positions at more favorable prices before reversing the market direction. The area just below a key psychological level like $115,000 is a prime location for such a maneuver. The rapid dip followed by a stabilization could indicate that this was not a panic-driven crash, but a calculated move to hunt liquidity before the next leg up.
Argument 3: Bullish Signals from Spot Markets and On-Chain Data
While the derivatives market was in turmoil, other indicators flashed bullish signals. One analyst pointed to a strong correlation between surges in Binance's spot trading volume and subsequent price upswings. Recently, Binance's share of the spot market volume surged significantly, a move that has historically preceded rallies. High spot volume indicates genuine buying and selling activity, as opposed to the paper bets of the futures market, and can signal strong underlying demand.
Furthermore, key on-chain metrics suggest the long-term bullish scenario remains intact. Analysts highlighted that Bitcoin's price found support near the "Realized Price" for short-term holders, indicating that recent buyers were not panic-selling in large numbers. Other metrics, such as those showing that major long-term holders are retaining their assets despite record prices, paint a picture of underlying market strength that contrasts with the short-term speculative chaos.
Conclusion: A Market at a Crossroads
The dramatic plunge to $115,000 was a multifaceted event, a perfect storm of institutional profit-taking, extreme leverage, and the brutal mechanics of the crypto derivatives market. For the over-leveraged trader, it was a catastrophe. For the long-term investor, it may have been a fleeting opportunity.
The market now stands at a critical juncture, defined by conflicting forces. On one hand, the specter of institutional selling, exemplified by the Galaxy Digital offload, looms large. The record-high open interest, though slightly diminished after the liquidations, still represents a significant amount of leverage that could fuel further volatility.
On the other hand, the arguments for a bullish continuation are compelling. The idea that the crash was a calculated liquidity grab, the historical precedent for sharp bull market corrections, the strength in spot market volumes, and the conviction of long-term holders all suggest that the core uptrend is resilient. The whale betting on a $200,000 price by year-end serves as a potent symbol of this underlying confidence.
The coming weeks will be crucial in determining which of these forces will prevail. The battle between the short-term pressures of deleveraging and the long-term thesis of accumulation will be fought in the charts and on the blockchain. While the bloodbath for longs served as a stark reminder of the perils of leverage, it may have also been the violent, necessary purge required to cleanse the market and pave the way for a more sustainable ascent.
Bull trapIn my last post I spoke about a spike throught the short liquidation levels.
We hit the top of what I thought a trend resistance would be.
Since then we have a clear reversal with strenght.
Bitcoin has been maintaining a strong longterm upwards trend, I believe 95-97k is a good reversal point, but personally im betting on 91k, as many technicals point to this zone and theres a FVG to be filled.
Trade safe, market is choppy since institutions entered the game.

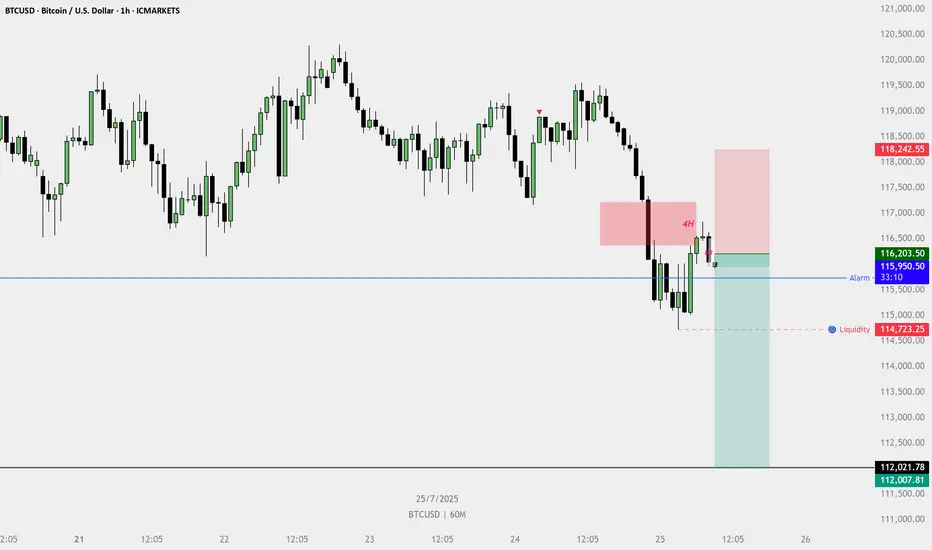
Trade Idea: SELL BTCUSD (1H)🔍 Trade Idea: SELL BTCUSD (1H)
🔴 Context:
Price reacted from a 4H bearish Fair Value Gap (FVG).
Formed a lower high after retracement.
Price is now respecting the FVG and showing signs of rejection.
🔽 Entry Confirmation:
Bearish candle formed inside the 1H structure resistance.
Price rejected the 4H FVG and failed to break above.
Entry near 116,203.50 (marked).
🎯 Target:
First liquidity pool near 114,723.25.
Final target marked around 112,007.81 (solid R:R setup).
🛑 Stop Loss:
Just above 4H FVG around 118,242.55.
✅ Supporting Confluences:
Price swept local highs before reversing.
Rejection candle formed within lower timeframe premium zone.
1H structure broke down after hitting 4H imbalance.
Short-Market price has broken the consolidation support level.
-Market has tested is testing the new resistance in anticipation of a short.
-Wait for bearish confirmation candle.
-Early entry for sniper entry is open for brave traders.

BTC/USD IDEAADO YOUR OWN RESEARCH!
BTC/USD in the top resistance price, in the July 14th hit 122.838 USD per BTC. The weekly Candlestick make a shooting star. Potentially down and the target bottom Price is around $45.000 USD per BTC.

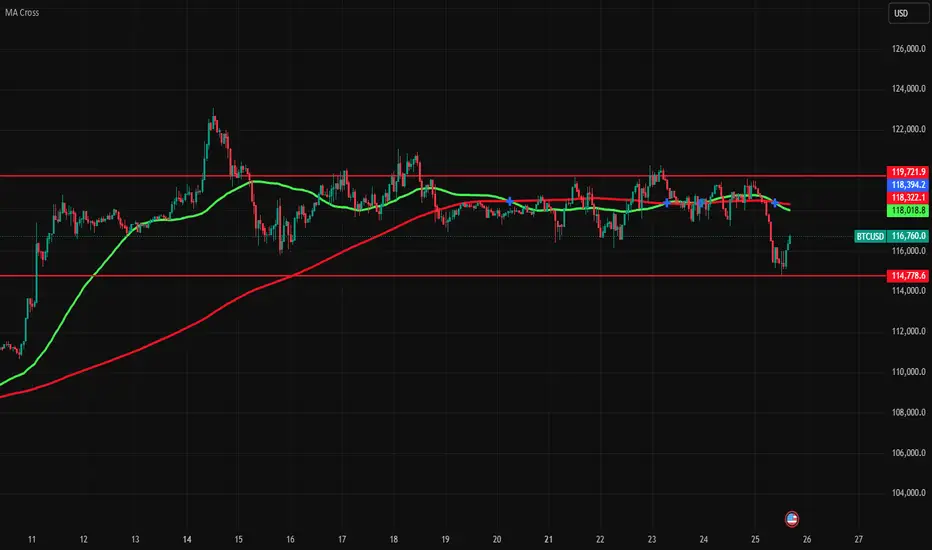
BTC zoneThis is BTC zone where it is moving since few days. It is below golden cross on hourly chart. It could be cross this zone after crossing golden cross.
Bitcoin's Bearish DivergenceBitcoin has slipped to $116,605, down 1.5% on the day, and the daily chart is beginning to show signs of weakness following a period of sideways consolidation below key resistance.
The most notable development is a clear bearish divergence on the RSI. While price pushed to a higher high around $122K earlier this month, the Relative Strength Index (RSI) made a lower high, signaling that momentum was fading even as price climbed. This kind of divergence – particularly when it appears after an extended run – often foreshadows a correction or at least a short-term pullback.
Adding to the caution, RSI was deep in overbought territory before beginning its retreat, further supporting the case for a cooldown. Volume also looks unconvincing, and we’re seeing a potential drop in demand as Bitcoin tests support.
Immediate support sits near $112K, and a break below that would likely open the door for a move toward the $105,787 zone. On the upside, bulls would need to reclaim $122K with conviction to invalidate the bearish signal and reignite momentum.
Overall, the chart is tilting slightly bearish in the short term, and traders should watch closely for whether support holds or if this divergence marks the beginning of a deeper correction.

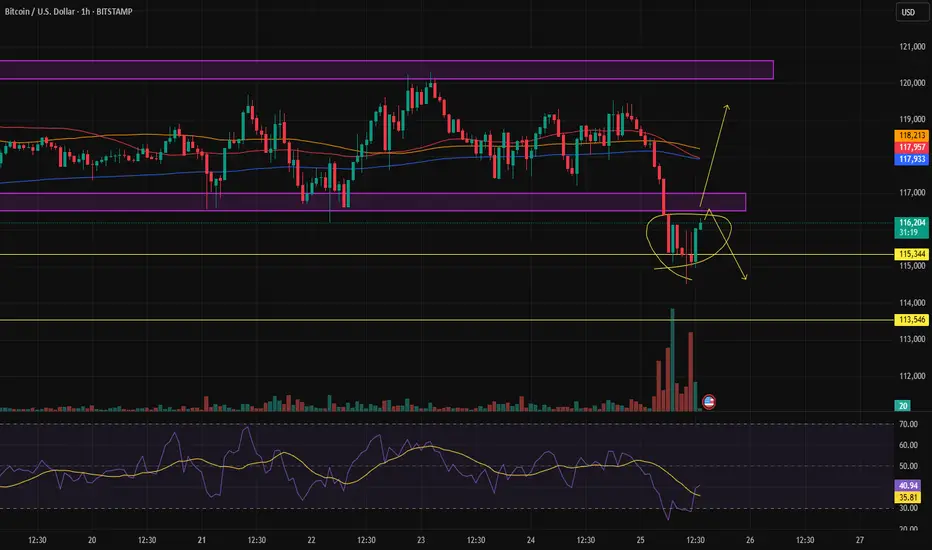
Fakeout or pullback?In my opinion, even though the trend is bullish, short positions are easier to take right now. That’s because on the way up, the price keeps hitting the EMAs, which makes upward movement harder — but on the way down, there’s nothing in its path.
Bitcoin & 150k TOPBitcoin has been trading within a rising channel for a long time, with resistance at $150,000. The middle support/resistance line also indicates $150,000, suggesting a potential significant rejection at this level.

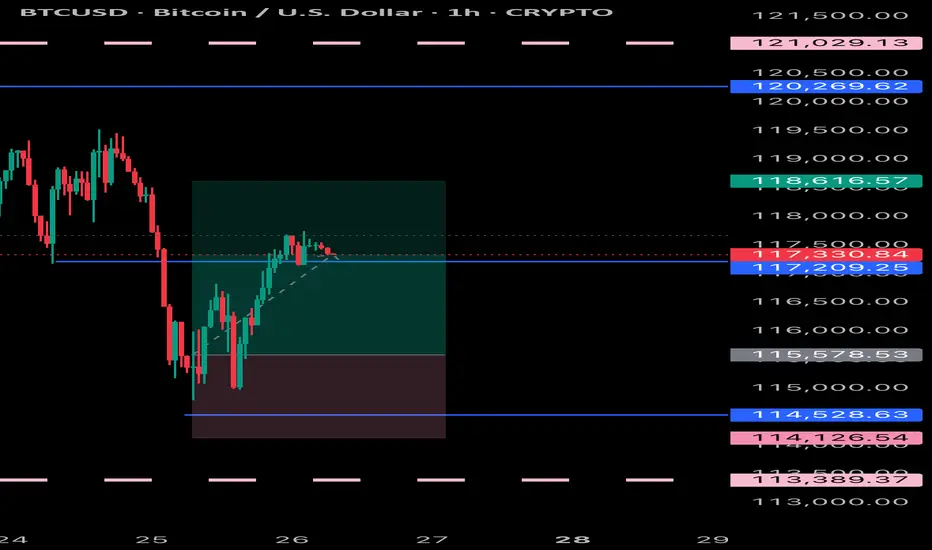
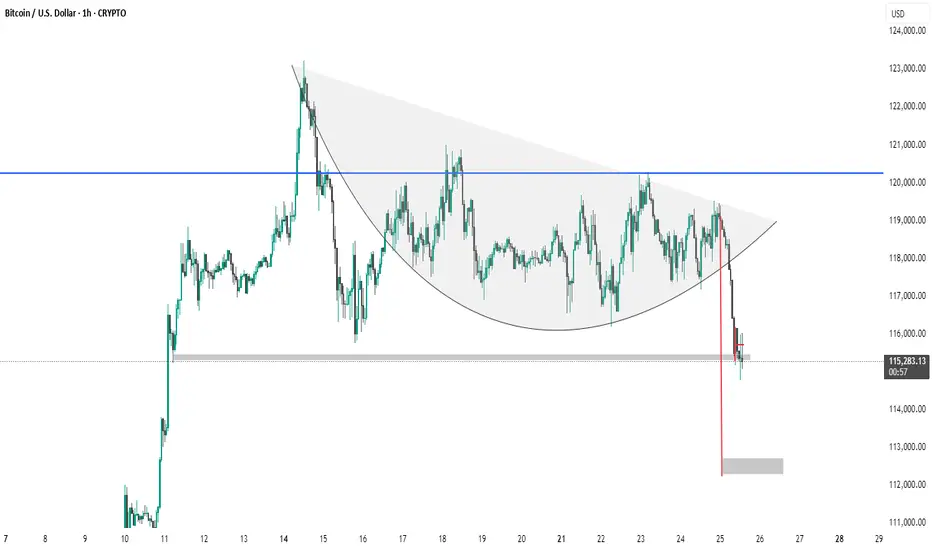
BTC #Bitcoin (BTC/USD) on the 1-hour timeframe.The chart shows a bearish breakdown from a rounded top formation, indicating a shift from an uptrend to a downtrend in Bitcoin (BTC/USD) on the 1-hour timeframe. Price broke below a key support zone ($116,000), confirmed by a sharp red candle. The shaded area below ($112,500) suggests the next potential support or target zone. This pattern reflects weakening bullish momentum and possible further downside.
Buy BTCUSD now up trendBuy BTCUSD now up trend and now third swing going on, so expected slow move. but target will reach surely

No title!Strong sells on Bitcoin. I want to see price fill more of the 1W BISI. There's a lot of selling pressure on the 4-hour chart.

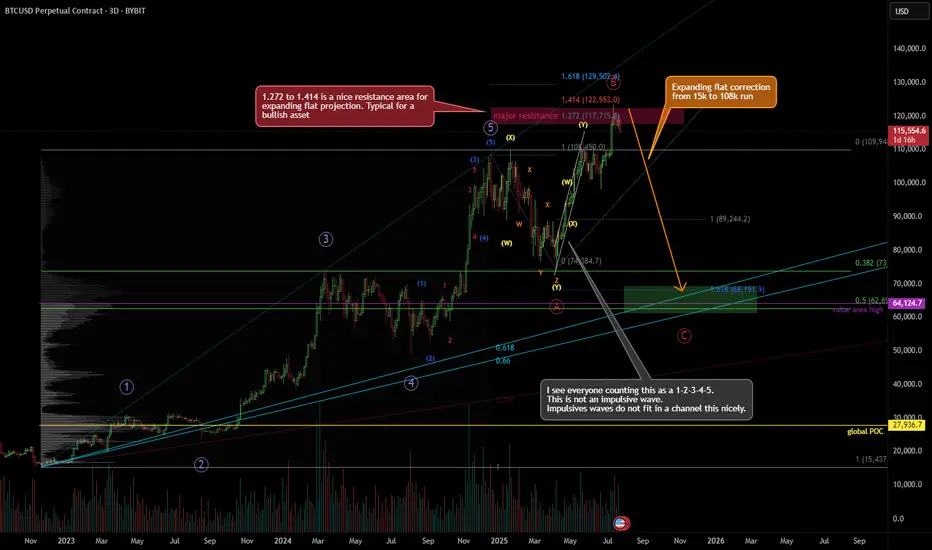
Looking for a correction, bearish Elliott Wave countThere's a probability that the Jan 25' high was the true 5-wave top, and not the Dec 24' top shown here, but because the price difference is barely 1%, the projections don't differ much.
I've long counted the April 25' to June 25' run as a very nice looking WXY. Almost perfect channel correction. A very bullish correction, sure, but still a correction.
And, we're forming an expanding flat from 109k region, down to 74k, then to 123k, and likely down to around 68k.
There's just too many confluences around 67-68k region.
(1) Huge volume node
(2) 1.618 fib projection
(3) 0.5 retracement from 15k to 109k run (2022-2025 run)
(4) Fib fan 0.618 to 0.66 (golden zone)
(5) Value area high of the 15k to 109k run
It's 7/25/25 as of posting this. Locally, in a 15min time-frame, I don't actually see this coming down right away. It's likely to spend few more weeks up here before it starts to make its movement.
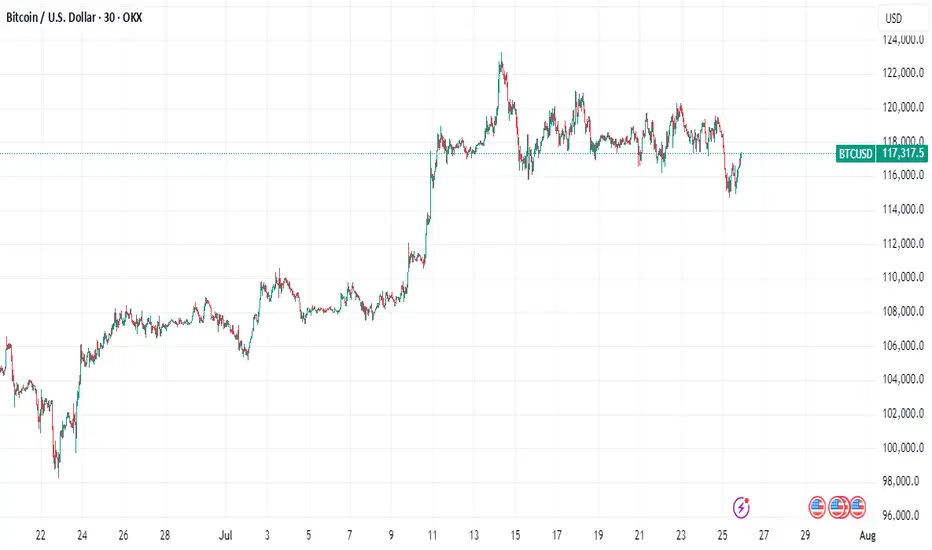
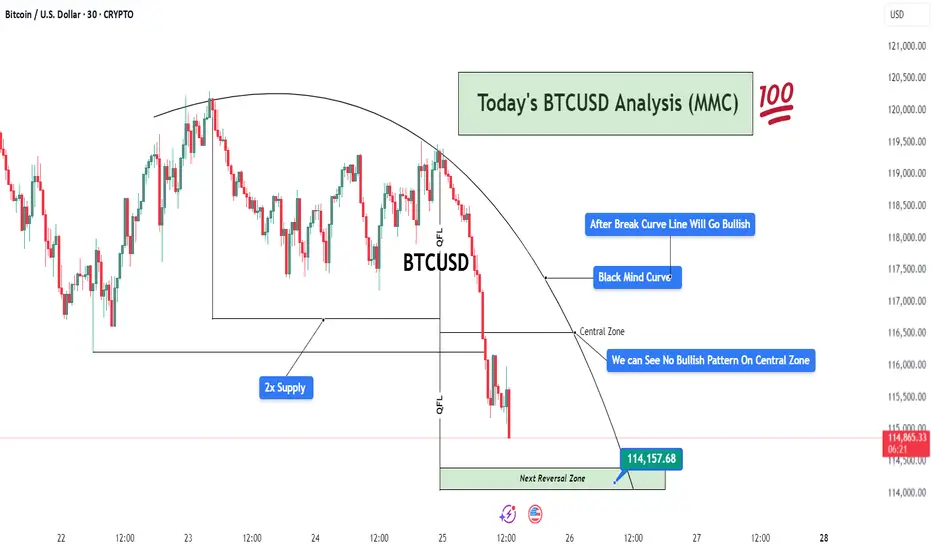
BTCUSD Analysis (MMC) – Bearish Flow Toward Reversal ZoneThis 30-minute BTCUSD chart highlights a well-structured bearish movement following the MMC (Mirror Market Concepts) framework. The analysis centers around the Black Mind Curve, multiple QFL drops, and supply/demand imbalances, presenting a professional outlook on current price action and potential reversals.
🧠 Black Mind Curve – Mapping Market Psychology
The Black Mind Curve is a visual representation of the market’s psychological behavior and serves as a dynamic resistance throughout this structure. Price respected the curvature, slowly losing bullish strength while forming lower highs.
This curve mirrors a distribution phase, where smart money unloads long positions before initiating a downside move.
Your annotation: “After Break Curve Line Will Go Bullish” implies that unless the curve is cleanly broken with strong bullish conviction, the bias remains bearish.
So far, the price is respecting the curve, reinforcing sellers’ control.
🔵 2x Supply Zone – Aggressive Selling Region
The supply zone is tested twice, confirming the presence of institutional-level sellers. This zone becomes critical because:
First touch: Minor reaction, but no follow-through.
Second touch: Strong rejection with extended downside move.
The double rejection clearly shows that buyers are trapped, fueling bearish momentum.
From an MMC view, this confirms the beginning of the “Mirror Market Shift” — where smart money rotates out of longs and traps retail longs near resistance.
📉 QFL (Quick Flip Liquidity) Events – Momentum Crashes
Two major QFL-based breakdowns appear in the chart after price consolidated within ranges. These drops are essential to understand:
QFL reflects market structure breaks where liquidity is engineered, and a sharp sell-off follows.
The first QFL drop occurs after the curve-resistance rejection, and the second confirms continuation.
These are liquidity runs, used to clear stop-losses and maintain bearish pressure.
This creates a domino effect — each QFL level becomes a signal of deeper imbalance.
⚠️ Central Zone – No Bullish Pattern Detected
The Central Zone marks a temporary support or midpoint level — a place where price might find footing if buyers show up.
However, as you noted:
“We Can See No Bullish Pattern On Central Zone”
No bullish engulfing candle.
No pin bar rejection.
No spike in volume.
No market structure shift.
This confirms that buyers are either weak or absent in this zone. MMC traders use this info to stay with the dominant trend (bearish) until proven otherwise.
🟩 Next Reversal Zone – 114,157.68 (Critical Demand Zone)
The green zone marked as “Next Reversal Zone” is a key level to monitor:
This area aligns with historical demand, where BTC previously reversed or slowed down.
Price is likely to hunt liquidity below recent lows before a potential bullish reaction.
It’s a Smart Money zone — designed to trap breakout sellers and absorb volume for a reversal.
Traders should watch for:
Bullish engulfing patterns
Break of structure to the upside
Divergence with RSI/volume
Sweep and reclaim setup
Once the price enters this zone, MMC reversal tactics come into play — buyers may step in aggressively here.
📅 Fundamentals & Timing
At the bottom of the chart, we see upcoming U.S. economic news events, which can act as volatility catalysts. Price could reach the reversal zone just before or during high-impact news, which aligns perfectly with smart money manipulation.
Be cautious of fakeouts around news time.
Confirmation is key before entry.
🧭 Final Outlook & MMC Strategy
Trend Direction: Bearish until 114,157.68 zone is hit.
Momentum Drivers: QFL drops, strong rejection from 2x supply, absence of bullish signals.
Key Watch Level: 114,157.68 – wait for MMC reversal pattern here.
Invalidation: If price breaks and closes above the Black Mind Curve with volume.
📌 Trade Idea Summary (For Caption Use):
BTCUSD respecting MMC Black Mind Curve. 2x Supply Zone triggered QFL breakdowns. No bullish confirmation at Central Zone. Eyes on Next Reversal Block near 114,157.68. Watch for reaction and potential reversal setup. #SmartMoneyMoves
CHECK BTCUSD SIGNAL READ THE CAPTAINEntry Point: Around 115950 115650
Stop Loss: Around 114800
🎯 Target Levels
Take Profit 1:
116650
Take Profit 2:
117850
last target
119150

BTCUSD Sell Plan – 1H Chart📉 BTCUSD Sell Plan – 1H Chart
Previous Day High (PDH) has been swept.
A Bearish Fair Value Gap (FVG) has already formed on the H4 timeframe, signaling potential reversal.
Price has been struggling to push higher for several days, indicating exhaustion in bullish momentum.
A Weekly Bullish FVG lies below, acting as a strong magnet—drawing price toward it.
If a pullback occurs, there’s no need to panic. It’s just the market seeking fresh liquidity.
Liquidity is sitting below, making it a high-probability area for the next move down.
🧲 Let the magnet do its job.

BTCUSD: Who caught the bottom of the previous wave?BTCUSD: Who caught the bottom of the previous wave?
.
I’ve said it before, the market only has a few familiar patterns, repeating them over and over to the point of boredom.
.
US STOCKS- WALL STREET DREAM- LET'S THE MARKET SPEAK!
