BITCOIN - Price can correct to support area and then start riseHi guys, this is my overview for BTCUSD, feel free to check it and write your feedback in comments👊
For a significant period, the price of Bitcoin was trading upwards within the confines of a rising channel.
Strong buying pressure led to a breakout above the channel's upper boundary, signaling an acceleration of the uptrend.
After this breakout, the upward momentum stalled, and the price entered a new phase of horizontal consolidation, forming a wide flat range.
The price recently tested the upper resistance of this range near $122800 and was rejected.
As a result, the asset is currently in a corrective move downwards, approaching the key support area located between $114000 and $115000
I expect that the price will find support at the bottom of this flat range, reverse its course, and begin a new rally back towards the top of the range at $122800
If this post is useful to you, you can support me with like/boost and advice in comments❤️
Disclaimer: As part of ThinkMarkets’ Influencer Program, I am sponsored to share and publish their charts in my analysis.
BTCUSD.P trade ideas

BUY BTCUSD now for 4h time frame bullish trend continuation BUY BTCUSD now for 4h time frame bullish trend continuation ...............
STOP LOSS: 115,836
This buy trade setup is based on hidden bullish divergence trend continuation trading pattern ...
Always remember, the trend is your friend, so whenever you can get a signal that the trend will continue, then good for you to be part of it
TAKE PROFIT : take profit will be when the trend comes to an end, feel from to send me a direct DM if you have any question about take profit or anything...
Remember to risk only what you are comfortable with... trading with the trend, patient and good risk management is the key to success here

Bitcoin is set to experience a decline.After hitting a new all-time high at 123,256.49, Bitcoin, the world’s leading cryptocurrency, pulled back this week, closing on the 4-hour chart below the 115,714 level. This indicates a shift in trend from bullish to bearish and increases the likelihood of a short-to-medium-term decline.
The recent price rise appears to be corrective, and the 121,427 level is considered important and carries downside pressure, as it represents the 78% level of the Fibonacci retracement tool when measured from the recent high to the latest low. Holding below the 123,256 mark and failing to break above it would support the bearish scenario for Bitcoin.

Bitcoin - The cycles are playing out!⚔️Bitcoin ( CRYPTO:BTCUSD ) just repeats another cycle:
🔎Analysis summary:
Following all of the previous all time high breakouts, Bitcoin will now further extend the rally. After some simple calculation, we can see that Bitcoin will rally another +50% in order to reach the overall price target. However there will be volatility along the way so make sure to remain calm.
📝Levels to watch:
$200.000
SwingTraderPhil
SwingTrading.Simplified. | Investing.Simplified. | #LONGTERMVISION

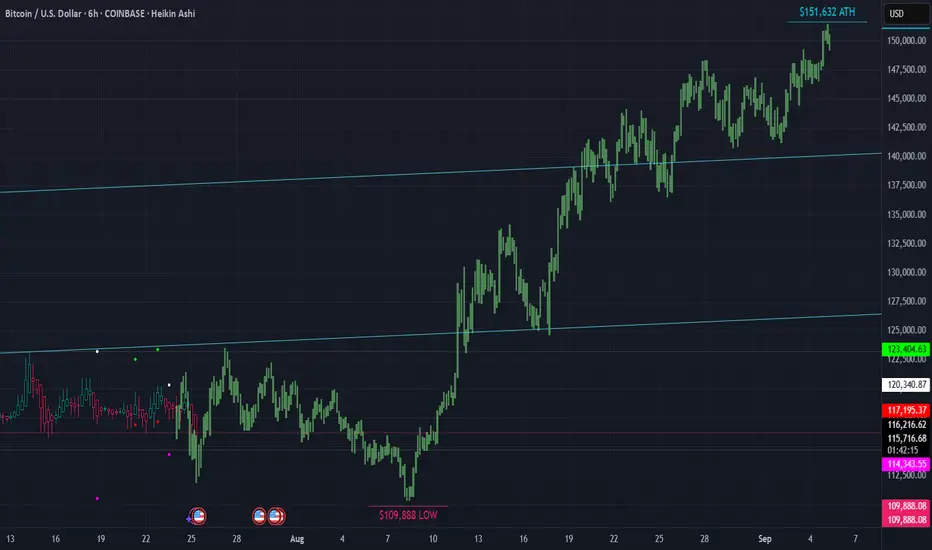
▒₿▒ BITCOIN FORECAST | 6HR ▒₿▒Hello @everyone. Long time. . . I was on a 3 year spiritual journey. I am back now and have many good things in the works. Who took my (non-financial) advice 3 years ago when I called the low of $15K a year in advance? And who believed me that it would go to $150K once we hit that $15K low? Who believes me now? Are you still thinking we've topped? Or do you think we have our $150K target in sight?
Have a look at this 6 HR Forecast. We have a low coming around AUG 8TH at $108K. And the most notable ATH of $151K around SEPT 5TH.
This is it. The playbook years in advance. I have never asked for anything or tried to sell you anything. It's all been done from a position of "paying it forward". Please, if you've taken my advice do the same.
I first bought Bitcoin in 2011. Was part of the MT GOX hack. And have had many ups and downs since then. One thing has never changed. . . And that is that Bitcoin is King. It's an asset class and a hedge against inflation. We're seeing this happen more now than ever. It's only got inflation as the halvings continue. The inflation rate of Bitcoin since/after this last halving is 0.84%. Bitcoin is up over 120-Million percent since 2011. Look at the BTC 6 MONTH candle chart and you'll see what Crypto asset you want to be in. Bitcoin is the only crypto asset.
When I first bought BTC it wasn't possible to purchase on an exchange with a debit card. I had to buy Linden Dollars from "Second Life" (which didn't always work because I had to deal with International Payment Processors due to US restrictions), then convert them to BTC on Mt Gox. Hardware wallets were not a thing. Now you can setup your bank account to auto buy on Coinbase and others. It's easier than ever. Store your coins on a hardware wallet and stay protected from the next FTX or hack.
This is the asset of the future. The "Digital Gold". I've seen the future and it runs on Blockchain and digital/virtual currency. A Super Artificial Intelligence will run and optimize all of our systems. Voting, assets, deeds, ownership and more will all be on a public blockchain ledger.
DEMATERIALIZATION/VIRTUALIZATION
INFORMATION & MEDIA
Music
We had music being played using metal, tin and wax in the 1800's, then mid 1900's we went to Vinyl and later in the late 1900's we went to plastic cassettes. And in 1990 - 2000 we had the CD which used laser optics to play the music. Effectively digitizing it. Then of course the MP3 player which was the next evolution in digitization. But where are we now? We are still in a type of digitization however it's evolved also. We are in a virtualization, where the music is not stored on the device itself, it's stored on servers which host the data to be accessed in the cloud/virtually.
You see the progression?
Metal/Wood > Vinyl/Plastic > Plastic/Digital > Metal/Digital > Virtual
(Or even further simplified on a higher level it would be Thoughts > Things > Digital > Virtual >)
What else has taken this path?
Movies
Metal/Wood - Film Projectors & Metal Reels
Plastic - Video Cassettes
Plastic/Digital - Optical Discs
Metal/Digital - Personal Digital Devices
Virtual - Cloud-Based Streaming
Books & The Written Word
Metal/Wood - The Printing Press
Paper/Plastic - Paperback Books
Plastic/Digital - Digital Archives on Discs
Metal/Digital - Handheld E-readers
Virtual - Cloud Libraries & Audiobooks
Money & Finance
Metal/Wood - Gold & Silver Coins (and even wooden coins)
Plastic - Payment Cards
Plastic/Digital - Secure Chip Cards
Metal/Digital - Mobile & Digital Wallets
Virtual - Digital/Crypto Currencies
This is the natural progression path. Are you the one still listening to cassette tapes while the MP3 player exists? Are you still using a physical thing while the virtual exists? (Nostalgia aside.)
NOW IS THE TIME!
Gold has been virtualized and it's called Bitcoin. While trading at 1,200,000 times more than it was 14 years ago it still has not yet realized it maximum value. In the past Gold and Silver were taken and bank/promissory notes were given in exchange. In fact it became illegal to not exchange your Gold and Silver for Dollars in the US. (1933 with the issuance of Executive Order 6102 by President Franklin D. Roosevelt.) The Dollar has no cap and is no different than Doge in that sense. BTC has a cap and a proof of work concept just like Gold. If you need to pay for things convert your BTC when you need to but holding or planning on making money off any other crypto currency that does not provide a base layer for our new virtualized financial infostructure it will not happen.
BITCOIN IS FINANCIAL LIBERATION FOR YOU, YOUR FAMILY, FRIENDS AND LEGACY.
BTC is up 3,000% in the past five and half years alone.
That's a 5.45 X Multiple per year. 545% growth rate compared to the unlimited and inflationary Dollar. Why not setup a reoccurring dollar cost average automatic purchase? We live in a day of virtualized programable currency, why not convert vapor currency to digital gold with the few clicks?
I am not a financial advisor. I am a Bitcoin Maximalist. Trade at your own risk. Assume your own responsibilities.
I have a big project I'm working on right now but also working on some TV Indicators in the background. I will share them with you all once I'm done testing them.
DISCLAIMER
I AM NOT A FINACIAL ADVISOR, NOR AM I YOURS. THIS IS NOT FINANCIAL ADVICE. MEARLY DOODLINGS ON A MATHMATICALLY DRIVEN GRAPHICAL INTERFACE, TRACKING AN INVISIBLE 256BIT MILITARY-GRADE ENCRYPTED ASSET. . . FOR ENTERTAINMENT/AMUSEMENT PUROSES ONLY. ENJOY!
LAST BTC PUSH? Dear Community,
in order to expand my skills analysis, I will regularly share my analyses and ideas here on TradingView. I still consider myself a beginner in the “stock market” and “crypto” area and am therefore very much looking forward to your comments and input!
My primary assumption is that we are still in a final upward move. However, I am also pursuing alternative scenarios that could lead to significantly higher levels.
BTC analysis - 1H chart
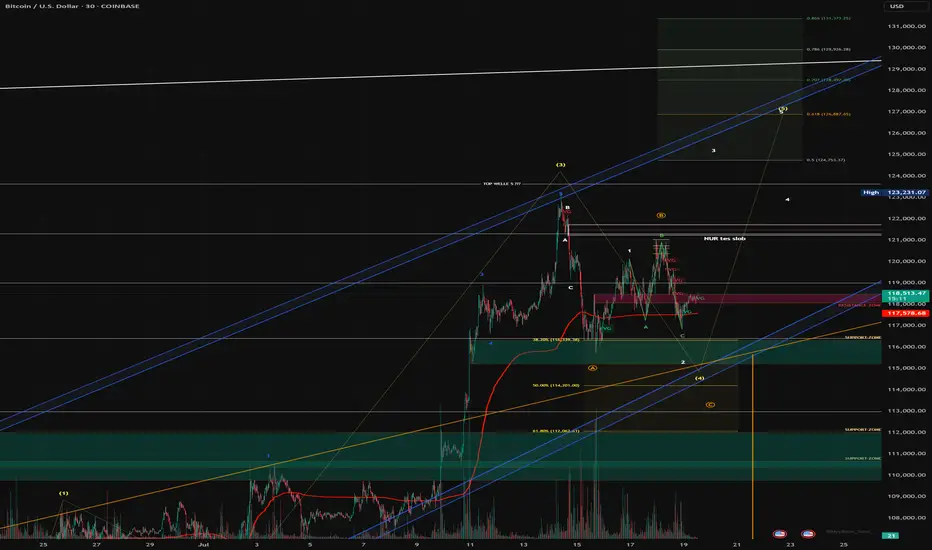
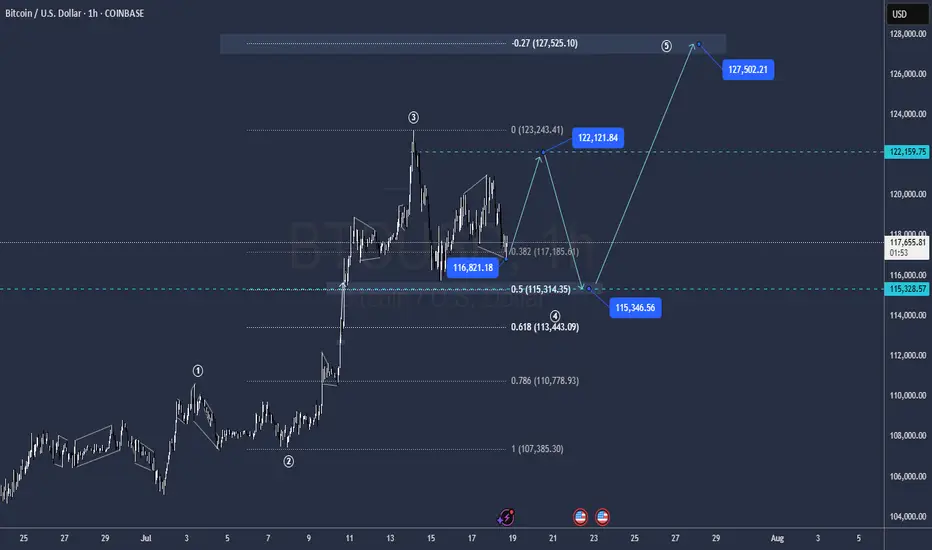
In my analysis, wave (3) in yellow is complete and we are currently in wave (4) correction, which may not be complete yet.
My guess:
- Wave B (yellow) has been completed, wave C has extended and could still reach USD 113 679, where the Fibonacci 100 level is located. There is also an FVG in the 1H chart.
- A retest of the blue trend channel would be quite possible in order to pick up liquidity at this level before wave 5 (yellow) is completed between USD 126,887 and USD 130,000.
- My risk management is down to USD 107,326 (Fibonacci 1.866).
- We have already tested the Fibonacci 0.5 level (pullback level) and seen a positive reaction. However, we currently lack volume in the market.
- If the blue channel and the Fibonacci 100% level break, I have to assume an alternative count.
In this case, wave 4 would still have scope to reach the Fibonacci 61.8% level in the yellow box at USD 112,062.
If my current forecast does not materialize, I assume that we have already completed wave A and are in the correction to wave B, which will be followed by wave C - with a target of around USD 130,000 for the final impulse.
This scenario also fits in well with risk management up to the Fibonacci level of 1.866. There are also high liquidity areas (long) at this level, which are very attractive for market makers.
What do you think?
BTCUSD Bullish energy buildup supported at 114,850The BTCUSD remains in a bullish trend, with recent price action showing signs of a corrective pullback within the broader uptrend.
Support Zone: 114,850 – a key level from previous consolidation. Price is currently testing or approaching this level.
A bullish rebound from 114,850 would confirm ongoing upside momentum, with potential targets at:
122,900 – initial resistance
124,420 – psychological and structural level
126,250 – extended resistance on the longer-term chart
Bearish Scenario:
A confirmed break and daily close below 114,850 would weaken the bullish outlook and suggest deeper downside risk toward:
112,860 – minor support
110,825 – stronger support and potential demand zone
Outlook:
Bullish bias remains intact while the BTCUSD holds above 114,850. A sustained break below this level could shift momentum to the downside in the short term.
This communication is for informational purposes only and should not be viewed as any form of recommendation as to a particular course of action or as investment advice. It is not intended as an offer or solicitation for the purchase or sale of any financial instrument or as an official confirmation of any transaction. Opinions, estimates and assumptions expressed herein are made as of the date of this communication and are subject to change without notice. This communication has been prepared based upon information, including market prices, data and other information, believed to be reliable; however, Trade Nation does not warrant its completeness or accuracy. All market prices and market data contained in or attached to this communication are indicative and subject to change without notice.

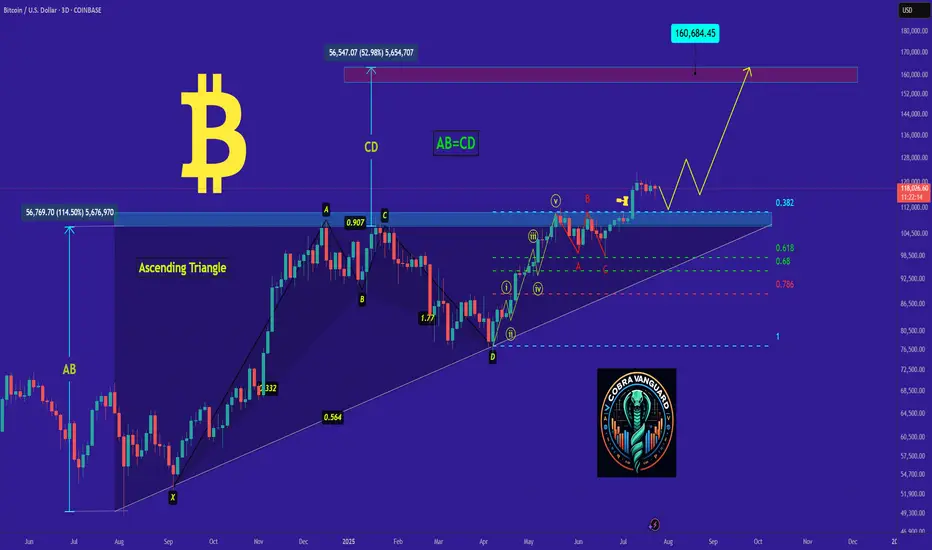
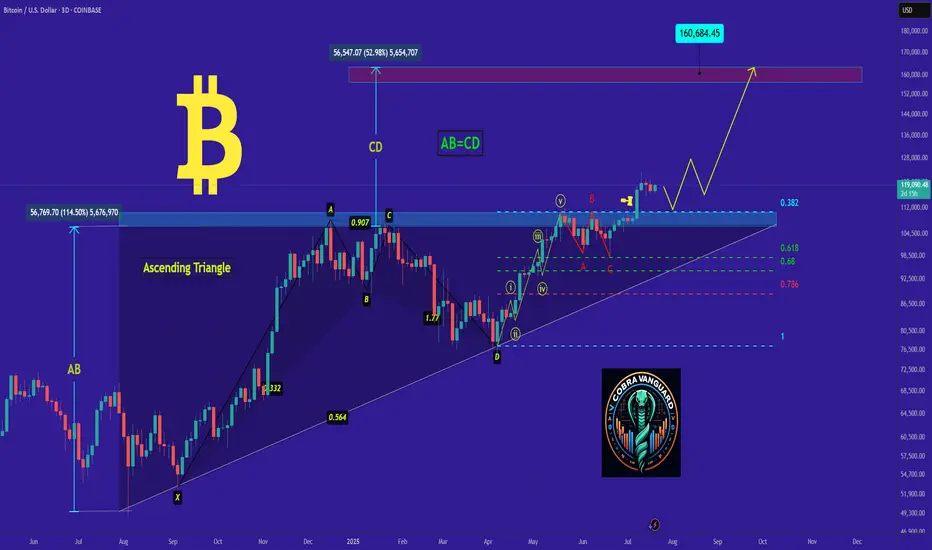
bitcoin- Time to buy again! (Update)As I said, Bitcoin broke the triangle, and now with a slight price correction, it could surge to $160,000, and you still think I'm joking!!
Previous analysis
BTC SHORT TP:113,500 25-07-2025We’re looking for a clean short from 116,200 to 116,600, aiming for targets between 113,200 and 113,600.
This move offers an average 3.5 RR on the 2-hour timeframe, and we expect it to play out within 24 hours.
Technical context: This looks like a simple bearish continuation after recent price action. Momentum has shifted and this setup offers a clean entry post-manipulation.
Manage your stop-loss according to your strategy and stay updated for the next move.
We don’t use indicators, we’re not out here drawing lines or cute little shapes — I just give you a clean trade.
If price doesn’t move within the expected time, the trade becomes invalid.

𝐛𝐢𝐭𝐜𝐨𝐢𝐧's Situation, A Comprehensive Analysis !!!As I said, Bitcoin broke the triangle, and now with a slight price correction, it could surge to $160,000, and you still think I'm joking!!
Previous analysis
BITCPINS"S WEEKLTY TRAJECTORY AND LEVELS TO WATCH Bitcoin is currently trading at $118,209, demonstrating continued strong bullish momentum in the market. This aligns with broader market sentiment, which has seen significant institutional inflows, particularly through spot Bitcoin ETFs, driving BTC to new all-time highs in July 2025. The transformation of Bitcoin from a speculative asset to a macro asset, coupled with factors like global liquidity and capital reallocation, are providing substantial tailwinds.
Given this robust backdrop and your weekly target of $126,000, the market appears poised for further upside. However, it's crucial to acknowledge the possibility of short-term volatility and technical corrections after such significant gains.
Key Resistance Level:
The immediate key resistance level to watch is around the $12O,000 - $122,500 range. A sustained break above this zone, ideally with strong volume, would reinforce the bullish outlook and open the path towards your $126,000 target and potentially higher. The next significant resistance beyond that is around $130,000 - $136,000.
Key Support Area:
On the downside, a crucial support area to monitor for potential pullbacks is around $110,000 - $112,000. This area has acted as a strong accumulation zone recently and aligns with key moving averages. A deeper correction could see price test the $100,000 psychological support level. As long as Bitcoin holds above the $110,000 - $112,000 range, the bullish structure remains intact for a push towards OUR weekly target."

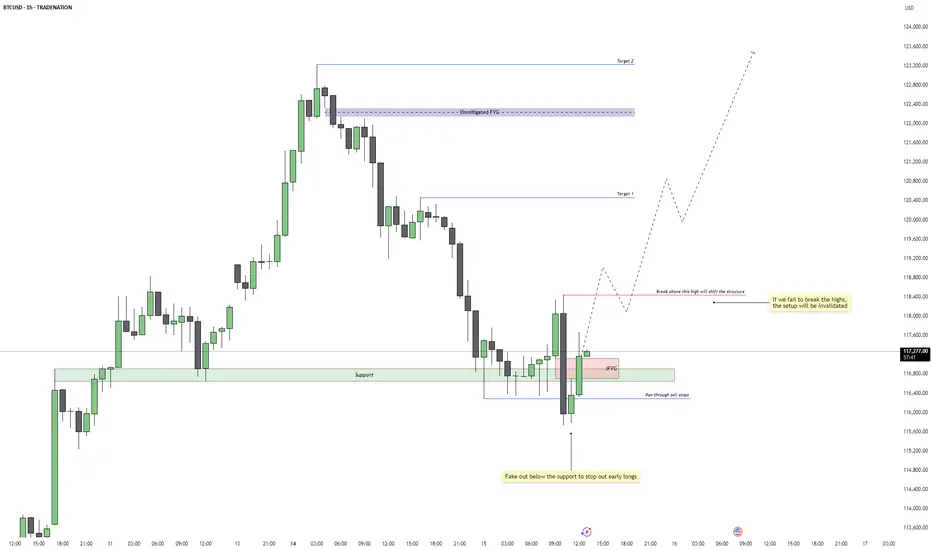
Bitcoin - Reversal Setup or Just a Trap Reset?Price faked below the 1H support zone around 115,800, triggering a clean run through resting sell stops. This classic liquidity sweep flushed out early long positions before immediately reclaiming the range. The move aggressively filled a prior imbalance and flipped sentiment just when it seemed the trend might break lower. The quick rejection and recovery from this level suggests smart money accumulation beneath support.
Formation of a 1H Inversion Fair Value Gap
The rebound from the liquidity grab printed a bullish 1H inversion FVG, now acting as a potential launchpad for continuation. This FVG coincides with the same zone that was previously support, now carrying added confluence. As long as price remains above this gap, the reaction shows bullish intent, with buyers reclaiming initiative after a shakeout.
Trend Shift Trigger and Invalidation Level
The current structure remains technically bearish until we break above the marked 1H high at 118,400. That level is the structure shift trigger. A decisive close above it would confirm a market structure shift and open the door to a broader bullish continuation. However, failure to close above this high would invalidate the setup and suggest that the move from support was just a temporary retracement rather than a full reversal.
Upside Targets and Continuation Outlook
If we get the bullish break above 118,400, I’m looking for price to reach Target 1 near 120,400, followed by Target 2 around the unmitigated FVG at 122,200. These levels align with clean inefficiencies that are likely to get filled if the market gains momentum. With enough volume behind the breakout, BTC could push into ATH territory above 123K as part of a larger macro expansion.
Volume and Higher Timeframe Context
Volume is the final key piece. We need strong follow-through above 118,400 for the setup to remain valid. Weak rejection or consolidation below that red line would signal distribution and potential failure. On the higher timeframes, BTC still looks constructive, but the 1H structure must confirm by breaking higher, or the broader bullish case will need to be re-evaluated.
Conclusion
BTC swept 1H support, ran stops, and printed a bullish inversion FVG. A break and close above 118,400 would confirm trend reversal and initiate a move toward 120,400 and 122,200. If we fail to close above that level, this setup is invalidated and the range could continue or break lower.
Disclosure: I am part of Trade Nation's Influencer program and receive a monthly fee for using their TradingView charts in my analysis.
___________________________________
Thanks for your support!
If you found this idea helpful or learned something new, drop a like 👍 and leave a comment, I’d love to hear your thoughts! 🚀
BTC Ready for the new impulse ? Elliott wave analysis 20/7/2025In my view, Bitcoin (BTC) has completed its micro correction and is now poised to move toward the $135,000–$139,000 target zone. This expectation is supported by the following factors:
1. Completion of the Sub-Waves in Wave (4)
My analysis of wave (4) indicates that it consists of an ABC correction, where wave B formed a WXYXZ pattern.
Additionally, I have counted the sub-waves within wave C of wave (4) and observed a complete 5-wave structure, suggesting that the fifth wave of wave C has ended, confirming the completion of wave (4).
2. Cypher Harmonic Pattern Pivot Point
I have identified a Cypher harmonic pattern with a pivot point around $116,600.
The termination of wave (4) occurred close to this pivot level, followed by a new impulsive move that made a higher high and formed a clear 5-wave structure—further confirming that wave (4) has likely ended.
3. Hidden Bullish Divergence on the 4-Hour Timeframe
A hidden bullish divergence can be observed on the 4-hour chart, particularly at the end of wave (a) and wave (c).
Historically, 4-hour hidden bullish divergences have often preceded strong bullish impulses. For instance, a similar setup occurred during the bullish rally from April 9, 2025, to May 22, 2025.
4. Failure to Make a New Low After Resistance Retest
The new impulse wave that emerged after the end of wave (4) has met resistance but failed to make a new low, suggesting that a fresh upward impulse is underway.
How Far Could Wave (5) Extend?
It is important to note that the wave (5) (blue) impulse is a sub-wave of wave (5) (purple).
The lengths of wave (3) (purple) and wave (5) (purple) are currently similar, which is unlikely because both are part of the major wave V (green), where typically only one wave should extend.
Since wave (3) has already completed, wave (5) is likely to be the extended wave, with a target length between 1.272 and 1.618 times the length of wave (3).
Interestingly, two Gann fan projections point to resistance levels in the $135,000–$139,000 range, which perfectly aligns with this 1.272–1.618 extension zone.
Invalidation Point
The invalidation level is around $117,000, as the micro correction within the new impulse should not drop this low.
If BTC falls below $117,000, it could imply that wave (4) has not yet completed and may be taking another corrective form.
For example, the wave (c) we currently see might only be wave 1 of a larger wave (c), or the correction in wave (b) may still be ongoing.
However, this scenario seems unlikely given the weight of evidence suggesting that wave (4) has already ended.

Bitcoin Weekend ForecastIts in the middel of wave 4 correction, impulses are tradeable
Levels Highlighted in the chart
Revsiting $150k - $200k Bitcoin (AND Next Bear Market Bottom)In this video I revisit my 2-year old study showing the potential path for Bitcoin to $150k to $200k and not only how we might get there, but the 11 reasons WHY we can this cycle.
This is the same Fibonacci series that predicted the 2021 cycle high at the 3.618 (Log chart) and used the same way this cycle, with some interesting 2025 forecasts of:
1.618 - $100k
2.618 - $150k
3.618 - $200k
There are quite a few confluences that we get to $150k like the measured moves from both the recent mini bull flag, but also the larger one from earlier this year.
** Also I touch on revisiting my study from 2 years ago where I may have discovered the retracemebnt multiple that correctlty predicted and held the 2022 lowes around $16k. **
It's a VERY interesting number you all will recognize (buy may not agree with).
Let me know what you think.

BTCUSDBUY Call retest must
Quick trade setup 30min
Risk free your trade once reach point metioned
Looks bullish move

BTCUSDBTCUSD needs some more correction before we continue the same trend.
Disclosure: We are part of Trade Nation's Influencer program and receive a monthly fee for using their TradingView charts in our analysis.

"BTC/USD Breakout Strategy: Identifying Bullish Momentum BTC/USD Technical Analysis – July 22, 2025
📈 Market Structure Overview:
The chart illustrates a recent Break of Structure (BOS) both to the upside and downside, indicating volatility and a shift in market sentiment. The price action formed a descending channel, followed by a breakout with strong bullish candles, suggesting a momentum reversal.
🧱 Support Zone (Demand Area):
Key Level: $116,400 – $116,900
This zone has acted as a strong demand level, with clear evidence of buying pressure pushing BTC higher after testing this area. The volume profile (VRVP) supports this, showing heightened trading activity at this price.
🔄 Bullish Breakout Confirmation:
A bullish breakout from the descending channel occurred just above the support zone, aligning with the label "Bullish Momentum".
The breakout candle has closed above minor resistance, which increases the probability of a trend reversal.
📍 Price Target:
The projection points toward $120,000, aligning with previous resistance and psychological round-number resistance.
This target is highlighted by an expected bullish leg after a possible retest of the breakout zone around $117,500 – $117,800.
🧭 Key Levels to Watch:
Support: $116,400 – $116,900
Retest Zone (Buy Opportunity): $117,500 – $117,800
Immediate Resistance: $118,400
Major Resistance / Target: $120,000
📊 Summary:
BTC/USD has shown a bullish reversal signal from a well-respected support zone after a descending correction phase. The current price structure, volume buildup, and breakout momentum suggest a high probability of continued upside movement toward the $120,000 mark. A successful retest of the breakout zone would provide a strategic entry for long positions with tight risk management.

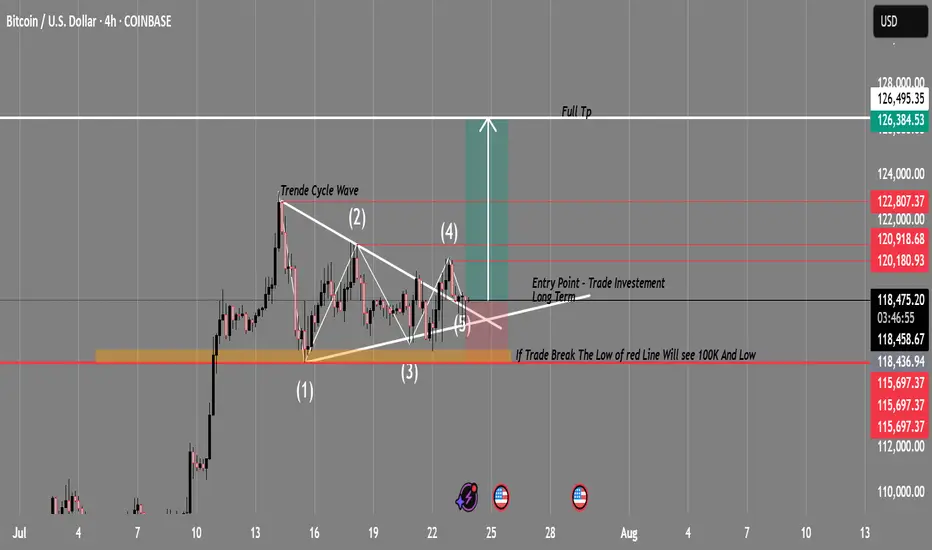
BTC/USD Swing Trade Setup | Breakout Imminent?Timeframe: 4H
Exchange: Coinbase
Strategy: Triangle Breakout + Wave Cycle Analysis
🔍 Technical Overview:
BTC is currently compressing within a symmetrical triangle pattern after completing a 5-wave cycle, suggesting a potential breakout is near. This structure indicates indecision — but also builds up momentum for a major move.
🔹 Wave Analysis: Complete cycle (1-5) within triangle
🔹 Support Zone: 115,697 (critical level — demand zone)
🔹 Resistance Breakout Target: 127,594 (measured move from triangle breakout)
🔹 Entry Point: Confirmed breakout above the triangle resistance (~118,500)
🔹 Invalidation: Strong 4H close below 115,697 = setup invalid
🔹 Risk/Reward: Favorable — breakout above resistance could trigger a strong bullish wave
🟢 Bullish Plan:
Entry: Break + Retest of upper trendline (~118,500)
Stop Loss: Below 115,697
Target 1: 122,800
Target 2: 126,384
Full TP: 127,594
🔴 Bearish Warning:
⚠️ “If price breaks the red support zone (115,697), BTC could drop sharply — possibly toward the 100K level and beyond.”
— a key invalidation level to monitor closely.
🧠 Conclusion:
This is a classic consolidation-to-breakout setup. Monitor volume and breakout confirmation before entering. If bullish momentum holds, this swing trade has great long-term potential.
💬 What do you think? Will BTC break bullish or drop to 100K? Drop your thoughts 👇
📌 Follow for real-time updates and future chart ideas!
BTCUSDT pauses before the next big moveAfter a strong breakout in early July, BTCUSDT is now consolidating within a clear range between 116,000 and 120,000 USD. The price has repeatedly bounced from the bottom and faced rejection at the top, forming a well-defined sideways pattern on the H4 chart.
The EMA34 and EMA89 are providing solid support to this accumulation phase. If the 116,000 support zone holds and volume confirms, Bitcoin could resume its previous uptrend and aim for the 124,000 level.
At the moment, this looks like a “breather” zone before the market picks its next direction.
Personally, I’m still expecting another bullish leg—how about you?

BTC/USD Technical Analysis — Educational BreakdownBTC/USD Technical Analysis — Educational Breakdown
🧠 Key Observations:
🔹 Market Structure: Break of Structure (BOS) Confirmations
The chart highlights multiple BOS points, showing clear transitions in market structure – a strong indication of bullish momentum building up after prior consolidation and retracements.
🔹 Support Zone (Demand Area): 115,355 – 117,403
This area has acted as a liquidity pool where buyers previously stepped in, forming the base for new BOS formations. A retest of this level could offer a high-probability long entry.
🔹 Resistance Zone (Supply Area): 123,375 Region
This marked level is a prior high and expected profit-taking or potential short-trigger zone. Price is likely to target this level if bullish momentum continues.
⸻
📈 EMA Analysis (20/50/100/200)
• Stacked Bullishly: EMAs are layered with the shorter-term EMAs (20/50) above the longer-term ones (100/200), suggesting trend continuation to the upside.
• Price reclaiming above all EMAs signals momentum is shifting from accumulation to expansion.
⸻
🔮 Potential Scenario:
1. Bullish Retest Play
A pullback toward the demand/support zone (116k–117.4k) can present a high-RR entry.
2. Continuation Toward Resistance
If price holds above the EMAs and structure, we could see a push toward 123,375, where profit booking may occur.
⸻
📌 Market Sentiment Bias: Bullish
• Structure: Bullish BOS
• Momentum: Above all EMAs
• Volume Profile: High acceptance near

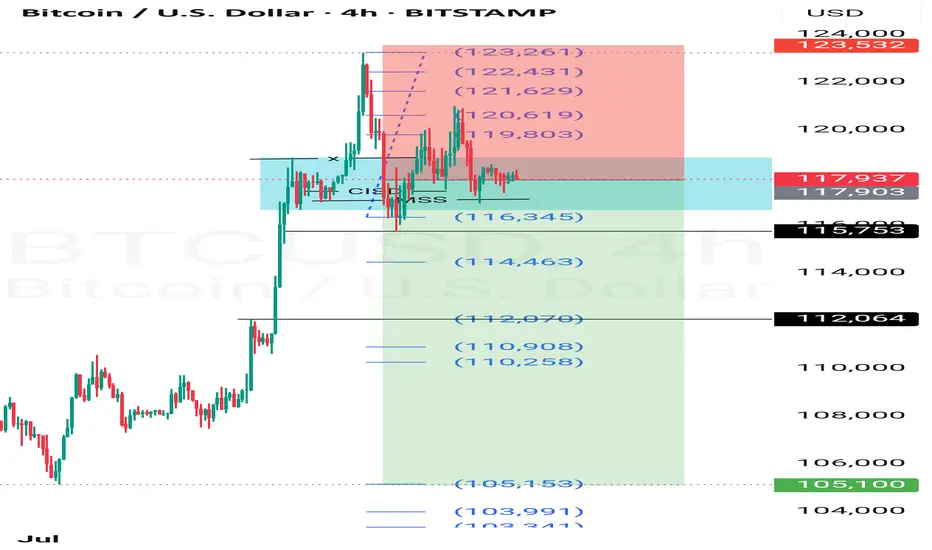
Sell BTCUSDPrice had taken liquidity and broke cisd and mss. Trump also swears to make america great again...usd should grow stronger.
What say you?
BTC wait for entryBTC has broken above the long-term weekly resistance (dating back to 2021) and is now consolidating above that key level.
On the 4H timeframe, price action is forming a descending wedge, a structure often associated with potential bullish breakouts. Two primary scenarios are unfolding:
Scenario A: Price continues to decline within the wedge, potentially reaching the high-liquidity demand zone (highlighted in yellow). A strong bounce is expected from this area.
Scenario B: A breakout occurs before liquidity is swept—suggesting stronger buyer momentum and early bullish confirmation.
Trade entries will be aligned with whichever scenario plays out, with confirmation signals provided in the accompanying chart.
Disclaimer:
This analysis is based on my personnal views and is not a financial advice. Risk is under your control.
