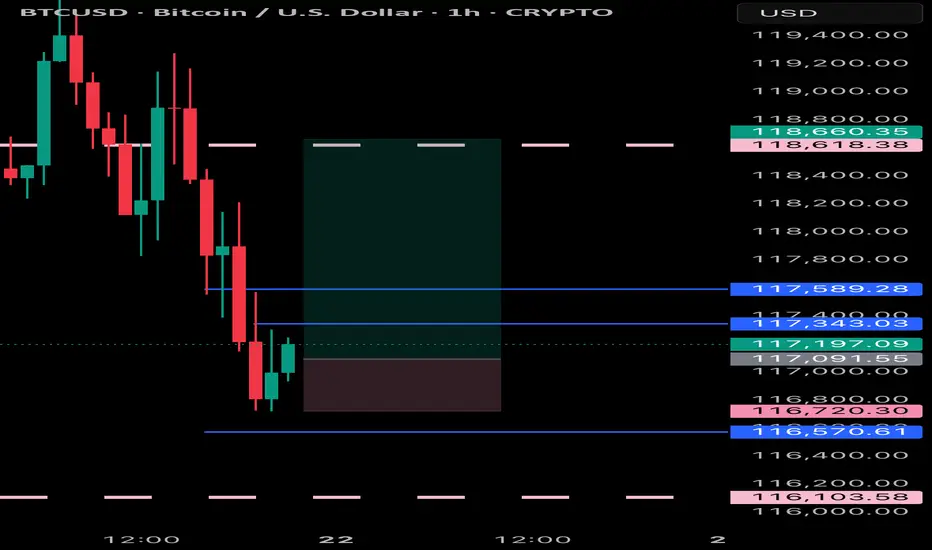
BTCUSD H1 - 22/7/2025BTCUSD H1
As shown, we are in wave 4 with 2 scenarios:
1- Wave 4 is triangle.
2- Wave 4 is Zigzag.
Thanks
BTCUSD.P trade ideas

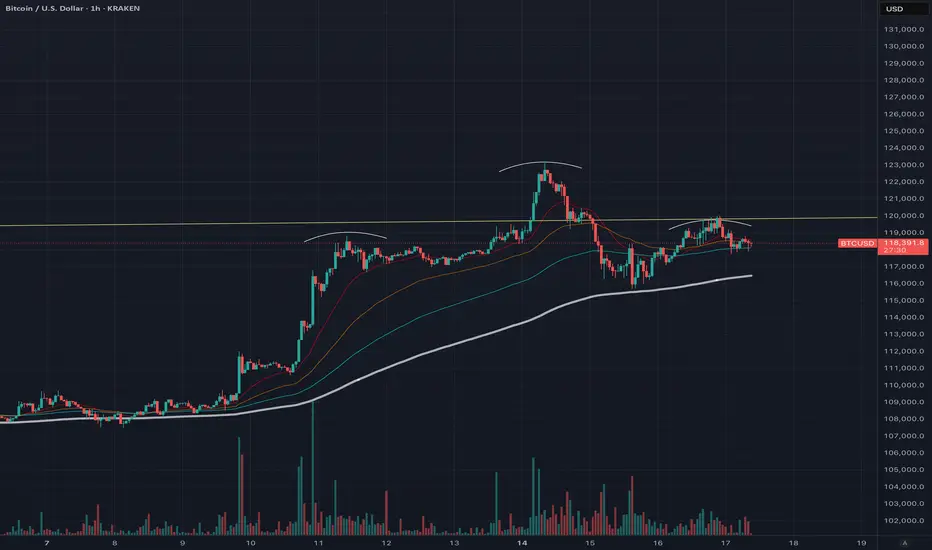
Comparison to 2021
I think the structure so far is quite similar to that of 2021.
1. Massive run up, piercing the upper BB and quickly falling down to the lower bound.
2. Double bottom on the lower BB.
3. Second run up, touching upper BB with a retracement to the midline.
4. Another run up higher, this time it seems it couldn't pierce the upper BB, but we already have some divergences and MACD is about to cross over, too.
If history rhymes, we should see next a drop to the midline, potentially overshooting it. The midline will then serve as an upper bound to the PA, before it drops to the lower bound and the ride continues.
Of course, it could also try to pierce the upper BB first, because of the sheer amount of trade deals (🌮)...

btc live or dieOne more leg up is what we re waiting for now so far . 130k+ is the main target for us after holding 118k for days. as long as 112k holds we re not in the end of cycle.

BTCUSDThe market general trends sideways we haven't seen a major breakout to the upside or downside, so for this morning we will be favoring the upside b targeting 1:3, then we wait to see how price playout

BTC 130 Minor pullback to regression channel bottom then attempt at HH. Bottom of daily regression channel is centerline of weekly regression. If channel support fails, 100 maybe.

BTCUSD BULLYING Bitcoin is still respecting price and is buying can expect some nice moves (New Highs)
vision paintingthis is sort of a game, i would like to play with anyone interested in chart riddles. i'm being very specific with my inputs, and coloring, painting a picture of what i need to see and when. painting whats there, guiding to where itll be. wondering if i could actually create art pieces here. hypothetically the 'paintings' would need to be back checked, to artificialy create any worth to it. market involvement is day/week trades. *no advice whatsoever. so, i think ill give it a go. from here onwards, these posts are the only ill post, with updates, within the comments of such post. happy trading
ballino

WEEKLY CLSBTC has formed a generous weekly range, I can already see a few candles closing inside of the range signaling a further downside to the 114K range where I will take most profit.
I will look for manipulation tommorow on wednesday and see if I can find more precise entries, if anything ask me in the comments and I will happily reply!
Good luck and do not over-leverage and remember be PATIENT!

Head and shoulder pattern on hourly.
A reversal seems likely, so we should anticipate a pullback. The trading volume is decreasing while exchange volume is increasing, which suggests a potential market top based on previous trends. Greed is also on the rise. Although history doesn’t repeat itself, it certainly shows similarities. The BTC/GBP chart is indicating a double top pattern on the daily timeframe. An altcoin season may be approaching based on the ETH/BTC pair, signaling that the end of Bitcoin’s dominance could be near.
$BTC / Bitcoin Elliot Wave Analysis Update - 7/21Hello fellow degenerates,
Price reached our Wave 3 target and is now inside a consolidation pattern, wave 4. If we have a break above the pattern, my next target is at 126k - 132k range.
- We need price to stay above 116k for a bullish continuation
- A break below 116k could take us towards 110k
- Key levels to watch: 116k, 110k

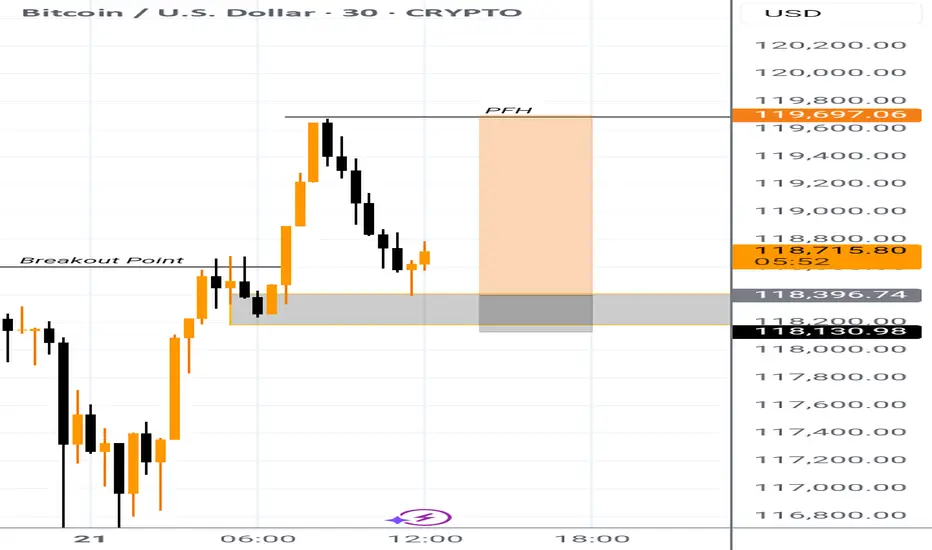
Check the trend Given the price behavior within the current resistance range, possible scenarios have been identified. If the price breaks through the resistance range, a continuation of the upward trend is likely.

Where is the discount?In the wake of the past two week's impulsive price action, imbalances have emerged on multiple time frames. With these imbalances leaving volume gaps behind, if 116 doesn't hold, 110-112 is likely the discount zone, where institutions step up their buying. I'm inclined to believe that, with the lower highs, we're headed there. COINBASE:BTCUSD

BTC/USD Long setupPrice has brokenout from previous swing point which gives a confirmation for long position and currently making retracement into support zone which gives a better entry for a 1:5 RR
BTCUSD CONSOLIDATES BEFORE NEXT HIKE
BTCUSD CONSOLIDATES BEFORE NEXT HIKE📈
Bitcoin has been under buying pressure since the beginning of July 9. Since July 14 the price has been consolidating. Now the graph represents the bullish pennant.
I expect the price to continue trading sideways for some time, then rebound from the trendline and move towards first major liquidation level at 127,400.00.
What is a liquidation Level?
The price at which a crypto exchange forcibly closes a leveraged position when margin falls below the required level, recovering borrowed funds.

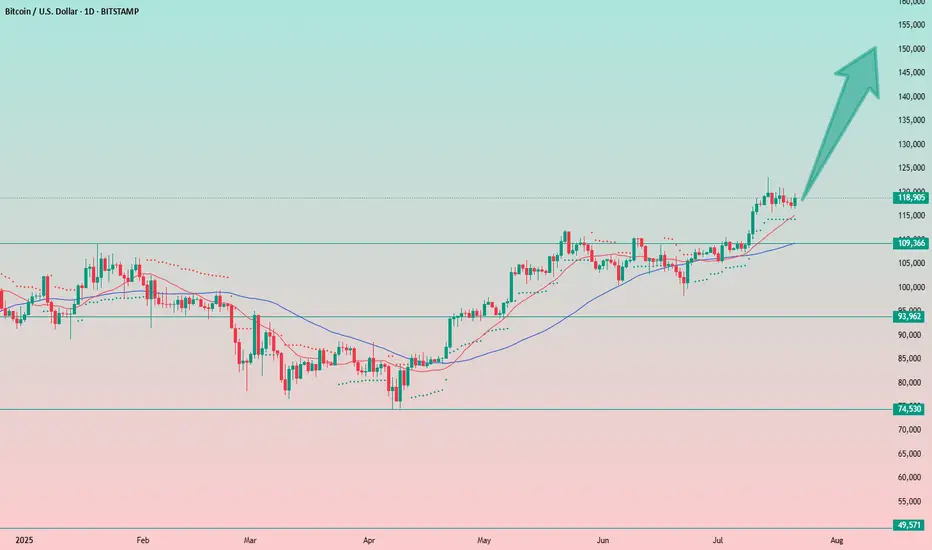
Bitcoin Keeps Charging AheadBitcoin doesn't seem to be slowing down and continues its bullish momentum.
Overall, I believe the chart shows a solid setup for further growth. I'm not exactly sure how high we’ll go, so in this case, I’ll be trading with a clear stop-loss strategy.
📝Trading Plan
Entry: I’m building a position from current levels.
Stop Loss: Stop-loss set at $115,000 (4%).
Target: Target is around $150.000. I'll be trailing stop-loss as price moves higher.
One more thought on Bitcoin:
I don’t expect to see crypto winters like we had in the past. Liquidity in the system has increased significantly, and institutional players are now involved. As a result, we should see fewer long, painful drawdowns and overall reduced volatility.
Bitcoin - Will Bitcoin reach its previous ATH?!Bitcoin is above the EMA50 and EMA200 on the four-hour timeframe and is in its ascending channel. Bitcoin’s current upward momentum has the potential to reach its previous ATH. If it corrects, we can look for Bitcoin buying positions from the specified support area, which is also at the intersection of the bottom of the ascending channel.
If this support is lost, the decline will continue to around $113,000, where we can again buy Bitcoin with a better risk-reward ratio.
It should be noted that there is a possibility of heavy fluctuations and shadows due to the movement of whales in the market, and capital management in the cryptocurrency market will be more important. If the downward trend continues, we can buy within the demand area.
Last week, the U.S. House of Representatives passed the CLARITY Act (Crypto-Asset National Regulatory Transparency for Investors and Consumers Act) with 294 votes in favor and 134 against, including support from 78 Democrats. The bill represents the first comprehensive legislative effort to regulate the cryptocurrency industry and is considered a major regulatory win for digital asset proponents.
Key features of the legislation include:
• Clearly defining the regulatory roles of agencies like the SEC and CFTC
• Establishing a new category for registered digital assets
• Facilitating broader integration of cryptocurrencies into traditional financial systems
Status in the Senate: Despite bipartisan approval in the House, the bill’s future in the Senate remains uncertain. Senators are still in the early stages of drafting their own version, and significant revisions are expected. Some Senate Democrats insist that the bill must explicitly address President Trump’s and his family’s cryptocurrency holdings.
The CLARITY Act is part of a broader Republican-led legislative initiative dubbed “Crypto Week,” which includes two additional major digital asset bills aimed at modernizing blockchain regulation and the broader digital finance ecosystem.
Meanwhile, Donald Trump is preparing to issue an executive order that would open up U.S. retirement markets to cryptocurrencies, gold, and private equity. This order would allow 401(k) fund managers to incorporate alternative assets into retirement portfolios.
The move follows the rollback of Biden-era restrictions and the recent passage of three crypto-related bills in the House. While major investment firms have welcomed the proposal, critics warn that alternative assets may expose retail investors to greater financial risks.
Also last week, Bitcoin reached a new all-time high, pushing its market capitalization to $2.43 trillion. It has now surpassed Amazon, Google, and even silver, becoming the fifth-largest asset globally by market value.
Looking ahead, one of the key events on the economic calendar is Federal Reserve Chair Jerome Powell’s upcoming speech at an official central bank-hosted conference on Tuesday. This event comes just before the release of the preliminary S&P Global Purchasing Managers’ Indexes (PMIs) on Thursday. Given Trump’s escalating verbal attacks on Powell, a central question is whether this political pressure has influenced the Fed Chair’s stance.
Trump has repeatedly urged Powell to lower interest rates. This week, reports emerged suggesting that the President had discussed with some Republicans the possibility of removing Powell from his position. However, Trump was quick to downplay the reports, stating that the likelihood of Powell being dismissed was “very low.”
In this context, if Powell uses his speech to reassert the Fed’s independence and calls for patience to assess the impact of tariffs more thoroughly, the U.S. dollar may continue its recent upward trend. Still, it’s too early to confirm a definitive bullish reversal for the dollar. While the global reserve currency has responded positively to headlines fueling tariff concerns, markets could mirror April’s behavior—when fears of recession led investors to sell the dollar instead of buying it—should those concerns intensify again.

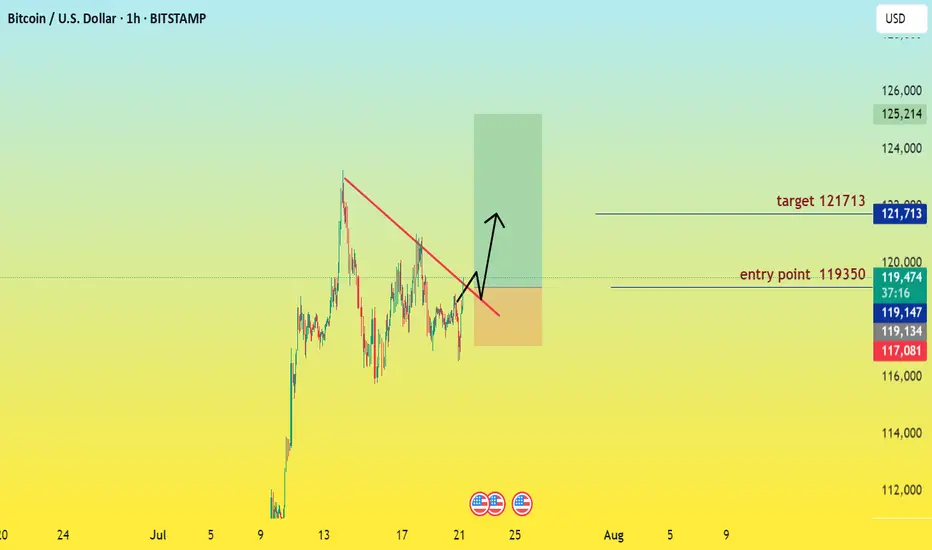
BWith Bitcoin currently trading at $119,425 and our buy signals extending confidently to $121,700, the landscape for BTC presents a compelling bullish narrative. The confluence of sustained institutional demand, evident in robust ETF inflows, and the ever-present scarcity driven by the recent halving, creates a powerful upward momentum. Furthermore, the maturing crypto infrastructure and a more predictable global macroeconomic outlook contribute to a fertile ground for Bitcoin's continued ascent. We are observing supportive technical indicators, including rising trend channels and the potential for bullish candlestick formations like Hammer patterns or Bullish Engulfing patterns, reinforcing our positive outlook. However, in a market as dynamic as cryptocurrency, even the strongest signals require a disciplined approach to risk. To capitalize on this potential upside while safeguarding your capital, consider the following integrated risk management strategies.
Strategic Stop-Loss Placement – Your Safety Net:
Identify Key Support Levels: Based on our technical analysis, identify logical support levels where you expect buying interest to emerge. Your stop-loss should be placed just below these critical support zones. For example, if a strong support level is identified at $117,000, you might set your stop-loss at $116,900.
Consider Volatility: Bitcoin is highly volatile. Avoid setting stop-losses too tight, as normal market fluctuations could trigger them prematurely. Conversely, don't set them so wide that potential losses become unmanageable.
Take-Profit Orders – Securing Your Gains:
Set Realistic Price Targets: Based on your buy signals up to $121,700, consider setting take-profit orders at strategic intervals leading up to or around that level.
Partial Profit Taking: Instead of selling your entire position at one price, consider taking partial profits as BTC moves in your favor. For example, you might sell 30% at $120,500, another 30% at $121,500, and leave the remaining 40% to ride further if the momentum continues. This locks in gains and reduces risk.
Risk-Reward Ratio: Always ensure your potential profit outweighs your potential loss. A common target is a 1:2 or 1:3 risk-reward ratio, meaning for every $1 you risk, you aim to make $2 or $3.
Stay Informed: Keep abreast of market news, regulatory developments, and technological advancements in the crypto space. However, filter out the noise and focus on credible sources.
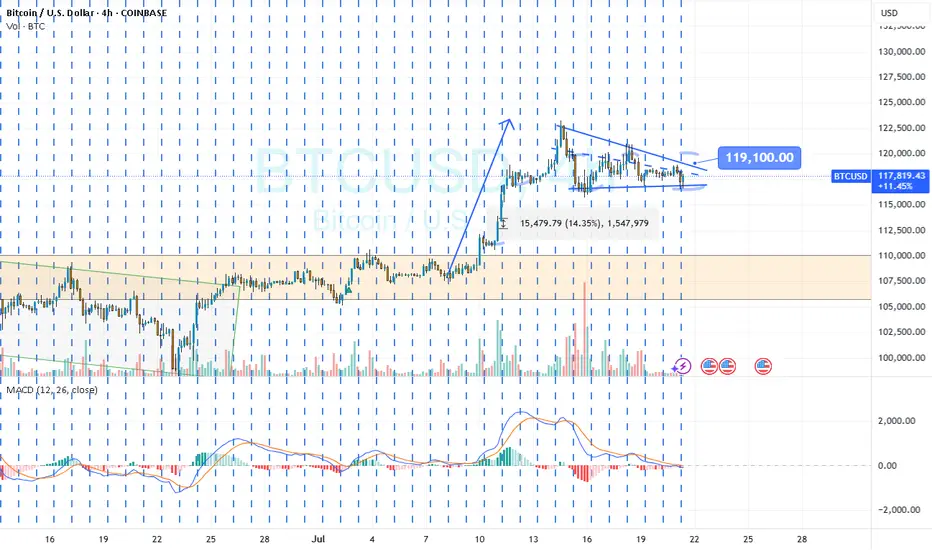
BTC – Symmetrical Triangle Tightens the Market CoilCRYPTOCAP:BTC is navigating a symmetrical triangle on the 4-hour timeframe 📊. This pattern typically signals a build-up of pressure before a decisive move.
As price action compresses toward the apex, the market is setting the stage for either a breakout surge or a breakdown slip ⚡️.
Patience is key here—traders are watching closely to catch the next wave of momentum.
Eyes on the chart 👀

FIBO EXTENTION TARGET 1.618We have a big breakdown here and the next target based on the Fibonacci extention is 160,000.

Btcusd techinical analysis.Btcusd techinical analysis next move posibale at h1 time frame.not finchinal advice.

BTC? Longterm view
Hi
Although 1st half on July we saw nearly 15% of move.
NOW: a pennant/flag is forming.
It's like a sleeping tiger.. accumulation is going on
I would not be in a bearish mood.
Hope it shed some light.
Action:
Option I: May entry small because the pennant isn't broken. Once it breaks consider adding position.
Option II: Wait for a clear break
I hope you'll always be in profit.
Not a guru
BTCUSDWe are favoring more of the sell sides to give us a better risk to reward while the buy side we will be risking a little on it.

$BTC Is moving alongBTC‑USD | 2‑Week Chart – Quick Read
Structure & Trendlines
* Price continues to respect the 2019‑2025 rising green channel and has flipped the 2017‑2021 orange trendline from resistance to support.
* A fresh break‑of‑structure above the 2021 ATH confirms continuation. Invalidation sits near the channel base / 65‑70 k demand zone.
Fib Road‑Map
* 1.618 extension (\~90 k) was reclaimed and back‑tested.
* Next confluence levels are the 2.618 (\~180 k) and 4.236 (\~240 k) extensions, matching thin volume nodes on the VPVR.
Momentum
* Multi‑time‑frame RSIs have broken their downtrends and pushed firmly bullish, echoing the 2020 breakout posture.
* The 2‑week MACD histogram has flipped positive with a higher‑low signal—momentum rebuilding.
Volume Profile
* Highest historical volume sits 15‑35 k; above 120 k liquidity thins sharply until ~160 k.
Near‑term downside risk
* The last episode of aggressive Fed rate cuts (March 2020) triggered a sharp washout before the subsequent melt‑up.
* Cuts keep getting deferred because unemployment remains low and jobs data solid; if a sudden pivot arrives on weakening data, a risk‑off flush toward the mid‑channel zone (≈ 80‑90 k) is possible before higher targets re‑engage.
Macro uptrend intact; pullbacks to the channel centre are buy‑the‑dip territory while momentum and structure favour an eventual 161.8 → 261.8 push, but stay nimble for policy‑driven volatility.
