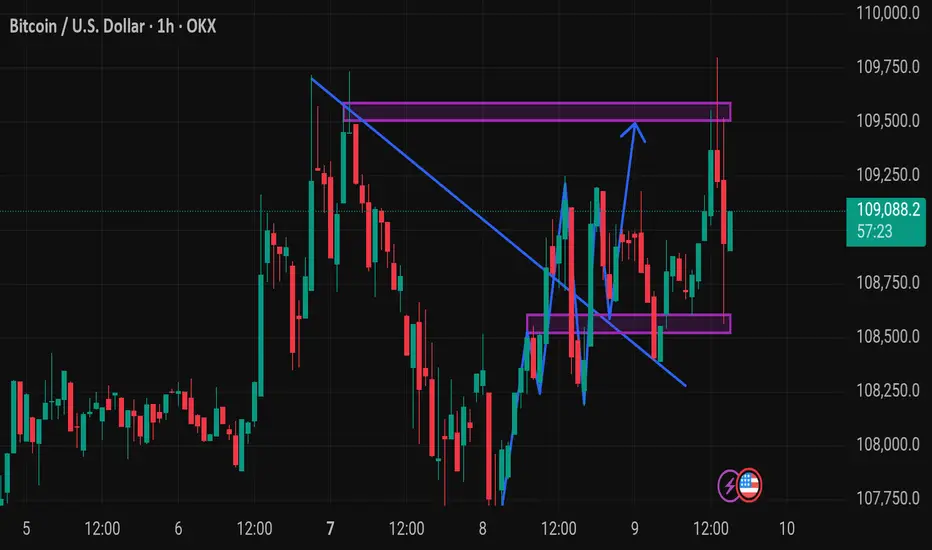
Bitcoin Smashes Records, Hits $117,000Bitcoin has climbed to a new all-time high of approximately $117,000, gaining further credibility as an institutional asset class. Strong demand from ETFs, growing mainstream adoption, and a favourable stance from President Trump regarding crypto regulation are all contributing to this momentum.
As Bitcoin grows in market cap and adoption, its volatility has been slightly dampened, but it remains highly reactive at technical pivot points.
Technical View (BTC/USD):
The next resistance sits at $118,000, which also coincides with the 161% Fibonacci extension level. If price stalls here, expect potential pullbacks toward $114,000 or even down to $110,000. However, a confirmed breakout above $118,000 could re-establish a new bullish leg.
BTCUSD.P trade ideas

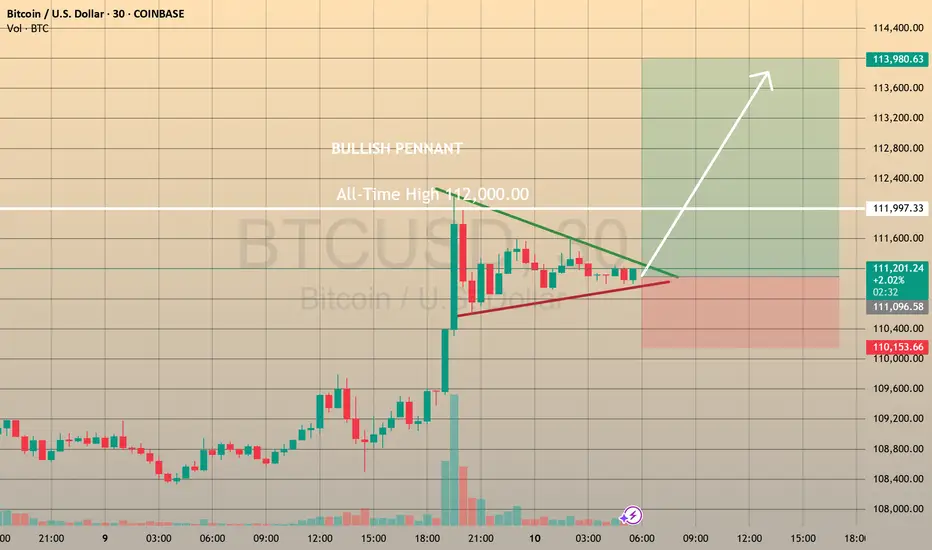
QUICK TRADE - GOING LONG IN BTCUSDCOINBASE:BTCUSD QUICK TRADE - GOING LONG IN BTCUSD📈
Yesterday bitcoin unexpectedly hit the all-time high 112,000.00 level. Since after that the asset has been shaping the pennant chart pattern, which may be just a consolidation before next bullish impulse. In this case I consider openning
🔼 a buy stop order at 111458.95 with
💰a take profit at 113984.10 and
❌a stop loss at 110591.05
If this happens and we break the resistance level of 112,000.00, we may expect the bullish impulse climb towards 114,000.00 level (my take profit in this case is just below it). Let's see.
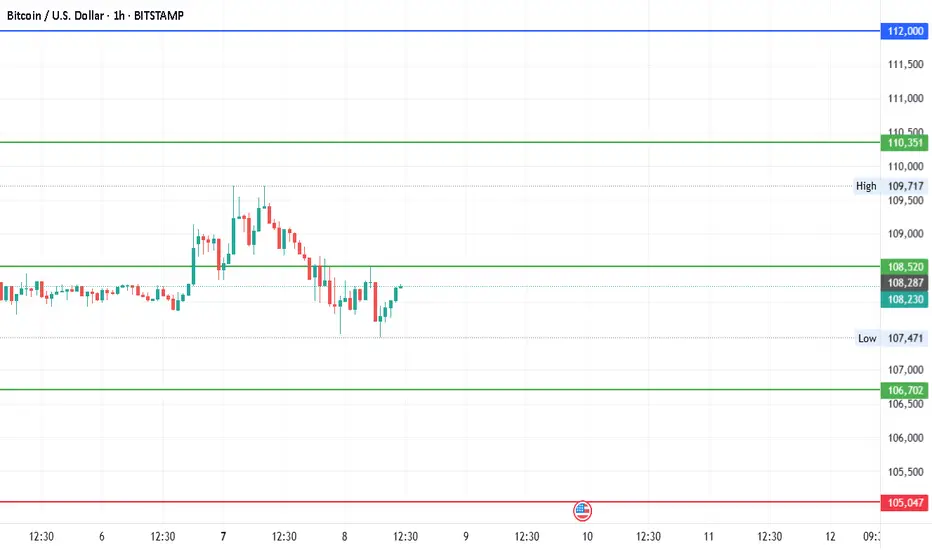
#Bitcoin - WeeklyDate: 08-07-2025
#Bitcoin - Current Price: 108235
Pivot Point: 108520.00 Support: 106701.81 Resistance: 110351.01
Upside Targets:
Target 1: 111999.51
Target 2: 113648.00
Target 3: 115571.00
Downside Targets:
Target 1: 105046.91
Target 2: 103392.00
Target 3: 101469.00
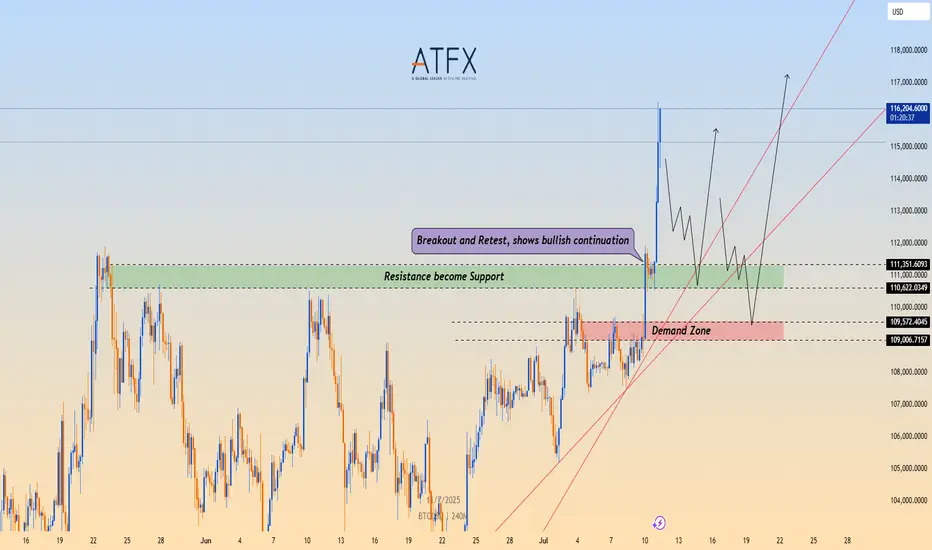
BTC/USD Breaks Out, Eyes Fresh Highs Above $116,000📉 Technical Structure
BITSTAMP:BTCUSD BTC/USD confirmed a bullish breakout above the $111,000–$111,350 resistance zone, which has now flipped into support. Price action shows a clean retest and bounce from this level, indicating a bullish continuation. Key support lies at the $110,600–$109,000 demand zone. If the price clears $116,800, bulls may target $118,000–$120,000 next.
📈 Long Trade Setup
Entry: $111,350
Stop Loss: $109,000
Take Profit 1: $116,800
Take Profit 2: $118,000
Invalidation: Break below $109,000 and trendline
🌐 Macro Background
BINANCE:BTCUSD Bitcoin rallied above $116,000 to a new all-time high after clearing the $111,000 resistance. The breakout was supported by strong momentum and optimism following a technical trendline breach. Despite some selling pressure and rising funding rates, the broader trend remains bullish. A sustained move above $116,800 could open the door toward $120,000.
📌 Key Technical Zones
Resistance: $116,800 / $118,000
Support: $110,622–$111,350, $109,006–$109,572
📘 Trade Summary
As long as BTC/USD remains above $111,350, the bullish structure is valid. Short-term pullbacks into the $109,006–$109,572 zone may offer buying opportunities.
⚠️ Disclaimer
This analysis is for informational purposes only and does not constitute investment advice.
BTCUSDBullish Alt record high targets Bullflag
Different SL for different Risk takers
BTCUSD BULL TRADE
I will share traget
* I share The chart earlier but there was some error so posting again

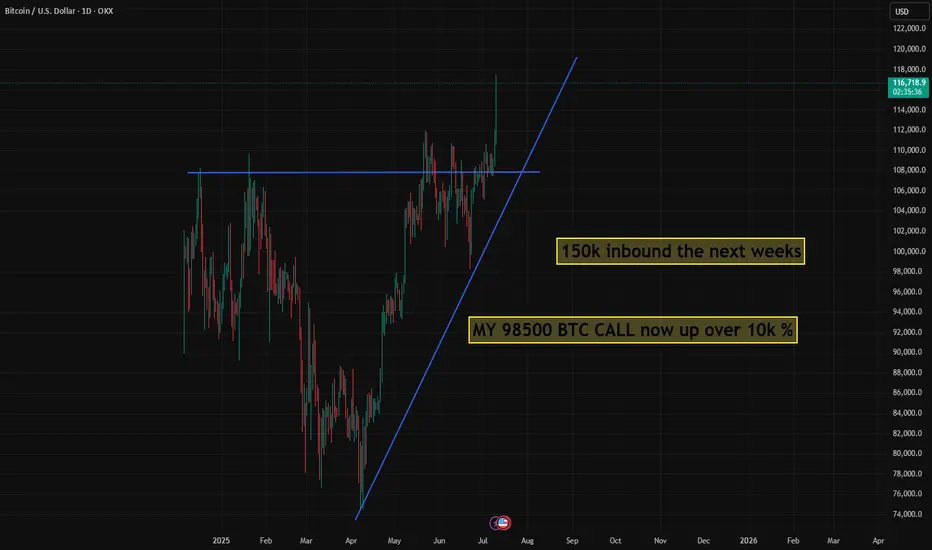
BTC 98500 ENTRY IS UP MASSIVE BITTEACHHUGE WIN FOR MY MEMBERS AND MY TRADING VIEW FOLLOWERS. check all my recent LONG calls i made this month.
this call was on my other banned trading view on 6/5 2025 at a 98600 entry point on BTC. we are absolutley printing a BAG right now and nothing is stopping the digital economic train.
follow for more info
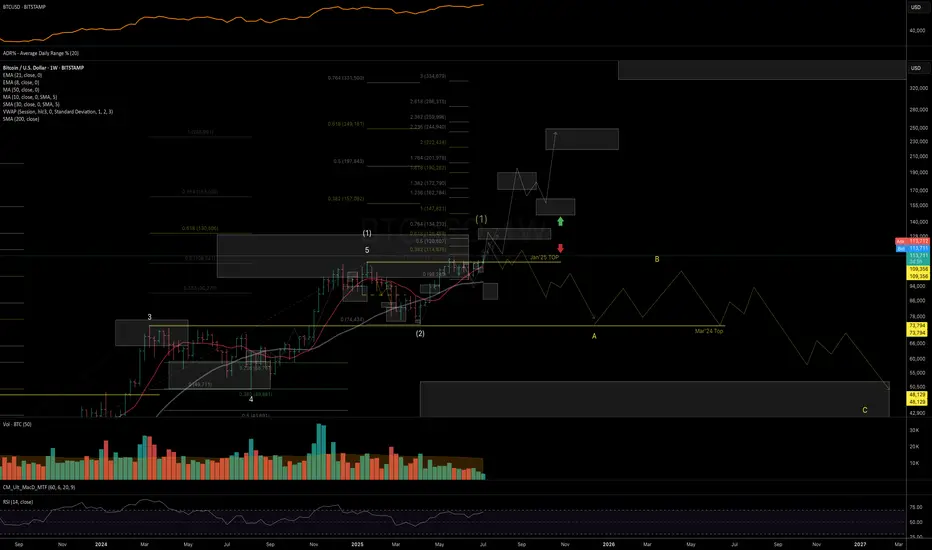
BTC: Macro Structure [Weekly Timeframe]Sharing my current view on the macro price structure of Bitcoin, outlining both main and alternative scenarios based on trend wave analysis.
Macro Trend Overview and Main scenario
The uptrend from the Nov ’22 bottom shows a classic 5-wave impulsive structure, closely aligning with ideal Fibonacci proportions:
Wave 3 peaked within the 1.382–1.618% zone
Wave 4 found support in the 1.236–1.000% area
Wave 5 topped near the 2.000% / 0.618% projection (measured from the Nov’18 bottom to Nov’21 top, projected from the Nov’22 low)
Wave (2) was relatively short in time and depth, but technically acceptable as complete. Given the broader technical structure, macro fundamentals, policy tailwinds, and social sentiment - I consider wave (2) to be finished.
The rally from April’25 low to May’25 high looks impulsive, followed by a clean three-wave pullback into the June’25 low - a structure consistent with the start of a new uptrend, within a larger degree wave (3).
If this is the case, given the fractal nature of the markets, price should Fibonacci proportions similar to the Nov’22 - Mar’24 cycle.
For this bullish count to remain valid, BTC must break and hold above the 126–134K resistance zone. This would open the door to next resistance zone be tested nex: 170–190K and 200–220/250K, where I’d expect a major top to begin forming, possibly, the start of a multi-year higher low formation.
Alternative Scenario
If price fails to break above 126–134K and starts showing reversal patterns, then the yellow count remains valid suggesting the entire trend from Nov’22 has peaked, and BTC could be entering a deep, prolonged correction (as per the yellow count).
In Summary
As long as weekly closes stay above 111.9K, my base case favors continued upside into 125–135K, where the next major decision zone lies:
• Either a short consolidation before breakout
• Or formation of a macro top
For more detailed levels and daily trend structure (including ETH, SOL, XRP, and HYPE), check out my recent video idea and Minds post.
Thank you for your attention and I wish you successful trading decisions!
If you found this idea helpful, I’d really appreciate a boost — and would be glad to have you as a subscriber!
Thank you for your attention and I wish you successful trading decisions!
* I'm keeping the same structure read from my public Mar'24 analysis:
Crypto at All Time Highs! But...Last month I shared a chart of an equal-weight crypto basket suggesting crypto may be on the cusp of fresh All Time Highs -- those highs have arrived! While that is certainly exciting for crypto holders one should take note of other aspects of the rally.
The US Dollar has depreciated substantially against foreign currencies this year (2025)
Bitcoin has yet to reach a fresh high against Gold
Bitcoin is strongly correlated to US equities, which are also at all time highs
USD Decline
The US Dollar is down a whopping 10% against a basket of foreign currencies this year, lead ostensibly by President Trump's raucous political policies, most notably aggressive tariffs across the globe and industries. The crypto rally therefore could be characterized as more of a Dollar softening than a crypto strengthening.
Bitcoin v Gold
Bitcoin - still the epicenter of all things crypto has not topped Gold.
Gold in fact has been on a heater of late against the Dollar.
Many folks still regard Gold as "real money". As such crypto could be said to be in a "stealth bear market", especially considering the declining momentum against Gold while failing to match its highs.
Bitcoin v Stocks
Bitcoin is also strongly correlated to US equity performance, despite claims that it's a hedge. The correlation has only grown stronger as Bitcoin's price against the Dollar has soared.
That said, it does consistently outperform equities, as long as the music is still playing!
Closing Thoughts
Most people likely don't care about how Bitcoin is faring against Gold. Bitcoin, the highest quality form of crypto is itself still highly speculative. While an equal-weight basket of cryptos is impressively reaching an all time high against the Dollar, coins with smaller market caps will surely be the first to go when this speculative impulse subsides.
There's probably still some gas in the tank at this point, but now is a good time to consider trimming positions before you miss the chance 🤑

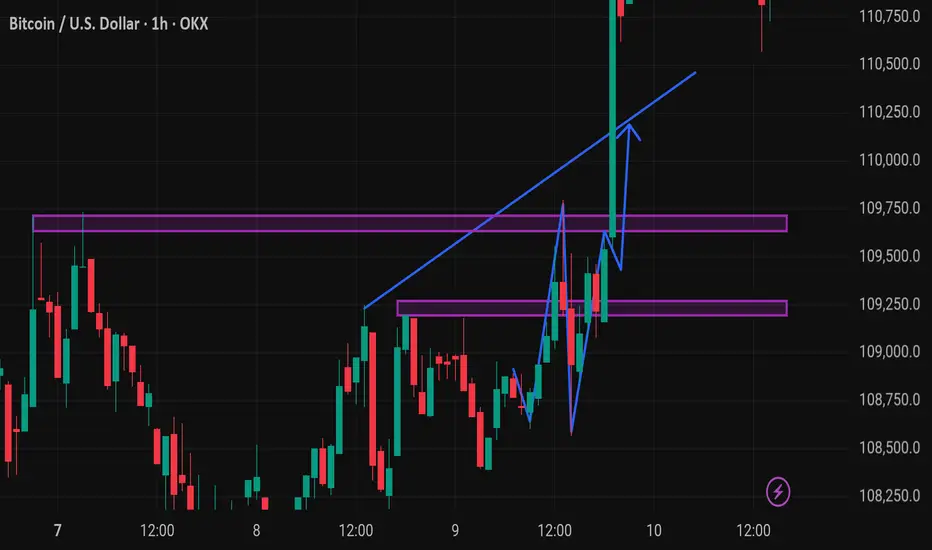
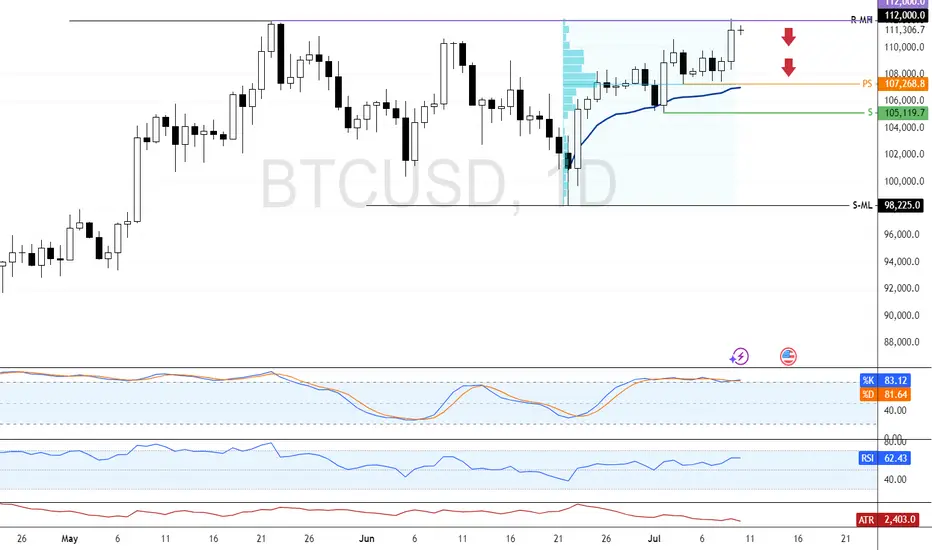
Bitcoin Tests Record High as Momentum FadesBitcoin is bullish, testing the all-time high at $112,000.0. Stochastic shows an overbought reading of 83.0, indicating momentum may stall.
As of now, BTC trades slightly below this level. Since it's the first test of $112,000.0, consolidation could follow. If bulls fail to break higher, price may dip toward $107,268 and $105,119.0 supports.
5-Step BTC Masterplan: High-Conviction Swing Trades Until Jan 26Hey Traders! 👋
I’ve built a multi-phase #Bitcoin trading strategy based on historical highs/lows and key confluence levels (trend + Fibonacci). If you're looking to ride #BTC’s volatility with clear direction and logic — this plan is for you!
💡 No overtrading. No leverage needed. Just strategic entries and patience.
👇 Check out the roadmap:
✅ 1st Move: Long #BTC — Starting NOW!
📅 Date: 9-May-25
📈 Entry: Current Market Price (CMP)
🎯 TP: 113,800
❌ SL: None (spot only)
🧠 Logic: Early breakout zone targeting resistance.
🚨 2nd Move: Short Setup
📅 Date: 15-Jul-25
📈 Entry: 113,000
🎯 TP: 80,800
🛑 SL: 121,000
🧠 Logic: Major resistance + likely correction.
✅ 3rd Move: Buy the Dip
📅 Date: 15-Oct-25
📈 Entry: 81,800
🎯 TP: 92,500
🛑 SL: 73,000
🧠 Logic: Retest of long-term support.
🚨 4th Move: Short Again
📅 Date: 2-Dec-25
📈 Entry: 91,800
🎯 TP: 61,850
🛑 SL: 101,000
🧠 Logic: Lower high, macro pullback likely.
✅ 5th Move: The Final Long!
📅 Date: 1-Jan-26
📈 Entry: 62,100
🎯 TP: 119,500
❌ SL: None (spot only)
🧠 Logic: Long-term support & trend reversal.
📊 This is not financial advice — just one trader’s structured roadmap.
🧠 Let the chart tell the story — emotions off, plan on.
💬 What do YOU think? Which move are you most aligned with? Drop your thoughts below!
👍 Like if this helped. 🔔 Follow for real-time trade updates & deeper analysis!
#BTC #Bitcoin #CryptoTrading #SwingTrade #TechnicalAnalysis #TradingPlan #Fibonacci #TrendReversal #HODL #BearTrap #BullTrap #Altcoins #CryptoStrategy #LongShort #SpotTrading


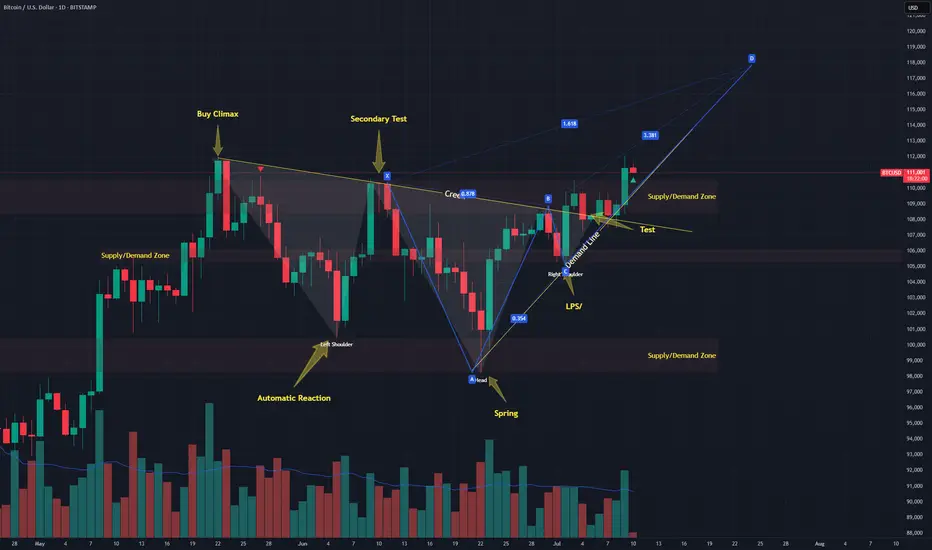
Bitcoin forming a possible deep crabLast week I published a thesis that #Bitcoin might be in a #Wyckoff re-accumulation pattern and we had an ugly ass inverse head and shoulders forming as a part of it.
Well know that test on the creek formed a BC leg of a possible Deep crab. 1.618 is ~117k. Lots of confluence
BTCUSD📈 Bitcoin (BTCUSD) Market Update
Current Price: $105,000.00
Outlook: Strongly Bullish
Bitcoin is currently trading at $105,000 and showing continued bullish momentum. Price action indicates strong demand at current levels, with technical structure suggesting potential for an explosive move upward.
Key Insight:
Buy pressure remains dominant, with no immediate signs of reversal. BTC is holding above key support zones and appears poised for a continuation rally.
📊 Trade Idea:
Bias: Long (Buy)
Entry Zone: Market Price (~$105,000)
Short-Term Targets:
🎯 Target 1: $110,000
🎯 Target 2: $120,000
🎯 Target 3: $130,000
Note: Monitor for consolidation above $105,000 as a base for further upside. Risk management remains essential—adjust stop-loss levels as per your strategy.

Price: ~$107,900 Trend: Consolidating after a breakout from a dCurrent Setup Analysis
BTC broke out of a falling wedge pattern (red trendline) and is holding above support near $100K.
Higher lows since June indicate bullish accumulation.
The price is riding above the ascending orange trendline.
Bollinger Bands suggest potential continuation; RSI isn’t overbought.
▶️ Buy Setup (Long Bias)
Entry (Buy): Between 107,500–108,000
Stop Loss: Below 104,000 (just under trendline and BB midline)
Target 1: 110,259 (key horizontal + BB upper area)
Target 2: 112,000 (psychological resistance)
Target 3: 114,266–116,000 (Fibo 2.618 + extension zone)
Sell Setup (Short Bias) – only if rejection
Entry (Sell): If there's a clear rejection candle near 110,000–112,000
Stop Loss: Above 114,500
Target 1: 100,716
Target 2: 93,304
This is a low-probability setup unless rejection is clear.
Final Recommendation
High probability of bullish continuation (above 60%)
Prefer a buy-the-dip strategy with stop under $104K
Watch 110K area — could act as a breakout or rejection point
BTCUSD · 3D — Bearish Divergence + Volume Drop Suggest Pullback
🧠 Setup Overview
Bitcoin is showing signs of exhaustion after a parabolic rally:
Bearish divergence is visible on the 3D RSI — price made higher highs while RSI made lower highs.
Volume is shrinking with each push up, suggesting buyer momentum is fading.
Price is pressing into all-time highs without conviction, signaling potential for a pullback.
🔻 Downside Targets
Target 🎯 Level Why It Matters
Target 1 $93,300 (50% Fib) Midpoint of last impulse + first strong demand area.
Target 2 $82,500 (61.8% Fib) Volume-profile support + key confluence zone.
🔎 What Confirms the Setup?
Breakdown below $108K structure
Daily close below $105K with increasing volume
RSI losing midline support = momentum shift confirmed
❌ Invalidation
Daily close > $112K with strong volume = idea invalid
Would suggest continuation toward blue-sky breakout
✅ Summary
Bearish divergence + volume drop = classic topping signals
Risk is well-defined, with Fib-backed targets offering clean R:R
Trade cautiously — momentum is fading, not gone yet
📛 Disclaimer: This is not financial advice. Do your own research and manage risk according to your plan.
#Bitcoin #BTC #CryptoAnalysis #BearishDivergence #RSI #VolumeProfile #Fibonacci #TradingView

Bitcoin Strategic Breakout at the Threshold of Silence!⊣
⟁ BTC/USD - BINANCE - (CHART: 1D) - (Jul 09, 2025).
◇ Analysis Price: $110,767.80.
⊣
⨀ I. Temporal Axis - Strategic Interval - (1D):
▦ EMA9 - ($108,767.55):
∴ Price remains above the 9-day EMA, maintaining a short-term bullish posture;
∴ The moving average acts as dynamic support with positive slope.
✴️ Conclusion: Immediate trend remains intact, with momentum supported at $108,767.55.
⊢
▦ EMA21 - ($107,663.85):
∴ EMA21 acts as the structural support of the medium-term trend;
∴ Price maintains a healthy gap above it, confirming bullish continuity.
✴️ Conclusion: Structural integrity remains bullish - no threat of reversal below $107,663.85.
⊢
▦ Ichimoku Cloud - (Senkou A: $106,870.32 / Senkou B: $105,173.14):
∴ Price is clearly above the Kumo, with bullish Tenkan/Kijun alignment;
∴ Lagging Span (Chikou) is above both price and cloud - clean trend confirmation.
✴️ Conclusion: Primary trend remains bullish; cloud structure provides layered support between $106,800 and $105,100.
⊢
▦ RSI - ($61.33):
∴ RSI is rising, currently at 61.33, still below the overbought threshold;
∴ No divergence or bearish signal present; EMA9 of RSI is supportive at 56.94.
✴️ Conclusion: Momentum is healthy and climbing - room to extend toward the 70 level.
⊢
▦ MACD - (MACD Line: 251.71 / Signal Line: 836.26):
∴ Recent bullish crossover confirmed; histogram turning increasingly positive;
∴ MACD shows early-stage trend resumption with growing momentum.
✴️ Conclusion: Renewed bullish phase underway - MACD structure confirms sustained strength.
⊢
▦ Volume + EMA21 - (Current: 352.24 / MA: 244):
∴ Current daily volume significantly exceeds 21-day average;
∴ The breakout candle is technically validated by volume strength.
✴️ Conclusion: Real buying presence behind the move - not a hollow breakout.
⊢
🜎 Strategic Insight - Technical Oracle:
∴ All technical indicators are in alignment;
∴ Price is supported by volume, short-term EMA's, bullish Ichimoku structure, and clean RSI/MACD momentum;
∴ The price is approaching the (ATH - $111,317.37) and any confirmed close above it, backed by volume, could trigger a Fibonacci-based extension toward - ($115,000 / $117,300).
⊢
∫ II. On-Chain Intelligence - (Source: CryptoQuant):
▦ Exchange Inflow Total - (All Exchanges) - (13.4K Bitcoin):
∴ No abnormal spikes - inflows remain historically low.
✴️ Conclusion: Selling pressure is absent - no signs of miner or whale unloading.
⊢
▦ Exchange Reserve - (Binance) - (537.4K Bitcoin):
∴ Continuous outflow trend - reserves have declined sharply in recent weeks.
✴️ Conclusion: Structural supply contraction - classic hallmark of accumulation.
⊢
▦ Funding Rates - (All Exchanges)- (+0.006%):
∴ Slightly positive, well within neutral zone - no euphoria.
✴️ Conclusion: Leverage is present but controlled - not overheating.
⊢
▦ Open Interest - (All Exchanges) - (gradually increasing):
∴ OI rising gradually without abrupt spikes.
✴️ Conclusion: Positions are being built systematically - not impulsively.
⊢
🜎 Strategic Insight - On-Chain Oracle:
∴ The breakout is not driven by leverage, but rather by spot accumulation and institutional withdrawal;
∴ This environment mirrors previous (pre-expansion) phases (notably late 2020), when reserves declined and funding stayed flat;
∴ All vectors are aligned - a structurally sound rally is underway.
⊢
⧈ Codicillus Silentii - Strategic Note:
∴ The market exhibits complete silence beneath price - no inflows, no speculative buildup;
∴ Only those attuned to the deeper rhythm perceive the pressure building within this compressed structure;
∴ The Codex observes no disruptive anomalies; the energy is latent, not explosive - yet.
⊢
▦ Tactical Range Caution:
∴ Immediate Support: $108,767.55 - (EMA9);
∴ Structural Support: $107,663.85 - (EMA21);
∴ Previous ATH: $111,317.37;
∴ Breakout Extension Target: $115,000 - $117,300.
⊢
𓂀 Stoic-Structural Interpretation:
▦ Structurally Bullish - Tactically Confirming.
⊢
⧉
Cryptorvm Dominvs · ⚜️ MAGISTER ARCANVM ⚜️ · Vox Primordialis
⌬ - Wisdom begins in silence. Precision unfolds in strategy - ⌬
⧉
⊢

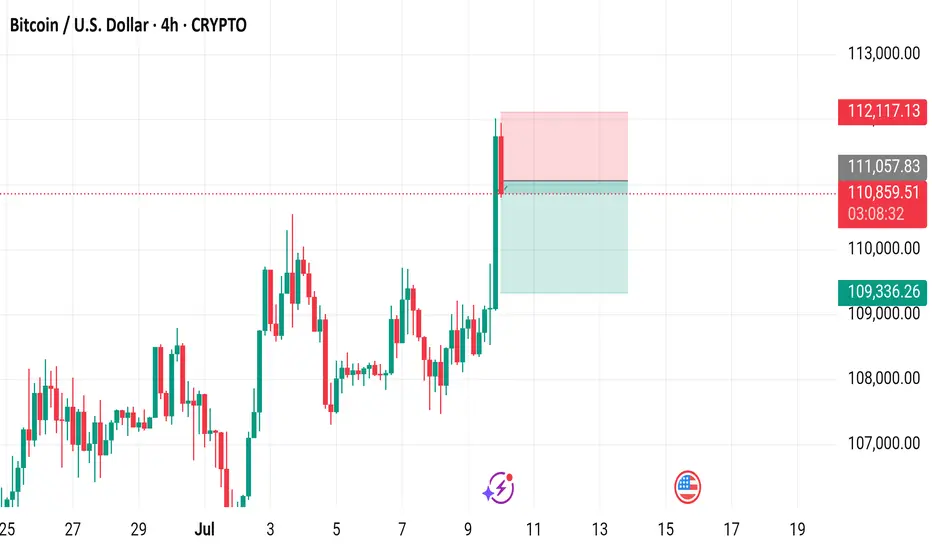
Bitcoin / U.S. Dollar 4-Hour Chart - CRYPTO4-hour candlestick chart displays the price movement of Bitcoin (BTC) against the U.S. Dollar (USD) from late June to mid-July 2025. The current price is $110,838.12, reflecting a 1.75% increase (+$1,908.56). The chart highlights a recent significant upward movement, with a notable green candlestick indicating a strong buying trend. Key price levels include a support zone around $109,336.26 and resistance near $112,117.13. The chart also shows buy and sell options at the current price level of $110,838.11.
Fake pumpWe had a good run.
BTC is due a correction.
Weekly RSI is Overbought.
Trendlines match fibonacci zones.
Overall fundamentals seem good longterm, but market needs a reset.
Many shorts to be liquidated in 115-117k , more than a billion dollars.
A billion dollars worth of longs to be liquidated at 97k.
Betting on fake pump,majorly overbought daily RSI, liquidate shorts, dump bitcoin, liquidate longs, load and reset.
95k seems reasonable, but theres a Fair Value Gap at 91k, and these get filled almost every time.With a spike through to the 0.61 fibonacci at 88k.
Possibility of 80k if theres a black swan mass panic event, this will touch the 0.78 fib and touch an unbroken bullish trendline from 2023. But very unlikely right now, just a healthy correction and reset before the true bull starts.
Alts will probably bleed hard, since faith is so shaken in them. Stack when theres mass fear.
After the next real pump rotation most probabably begins.
Good idea is to DCA at 95k, 90k is a solid zone, 80k would be absolutely perfect. Good levels for alts are corresponding to these prices.

BTC H2 2025 - H2 2026My idea of what I think will unfold the rest of the year and next year for BTC.