BITCOIN LOG UPDATESThis meaningful indicators on logarithmic, Since 2022- now I still used this on BITCOIN.
it works, some of my followers doubt this but its fine, we might see 170k per bitcoin by end of this year? This predictions base on the logarithmic , this indicator shows how the supply works with only 21M bitcoins, unlike other commodities. Bitcoin is the most followed commodities on this indicator I rarely used.
Youve come here so far to know bitcoin, here is my chart for this year. It will keep Bitcoin hard to buy until it reached a million per coin, then the public regret it.
Keep the word DCA. Goodluck.
Holding it is the key.
BTCUSD.P trade ideas

$BTC dominance still progresses !bitcoin rsi and macd still is very dominant. aswell as the reversal that just happened in the past few hours.
i look to see 120k BTC by tuesday afternoon. at 1pm est time. considering all chart indications that i use. stay tuned and follow for more.
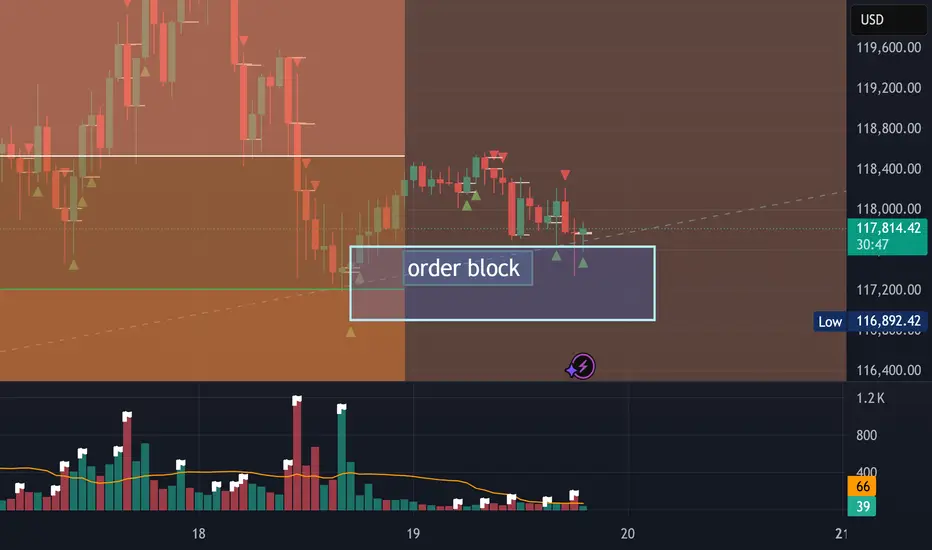
Order Block reached looking for a breakout to our Target of 132KWe saw a bottom when we hit just below 116 and 117 has been showing good support. Bulls are building up for a push up to a new high again. I have targets of 128-132K and the energy in the Fibs show we are likely going to break 160k this summer in the next few weeks or months.
BTCUSD bullish scenario will it go ATH 1,30,000+BTCUSD is currently in A bullish trend and it took the first support at 115900 which 0,5 fib and next at 117500 which 0.618 fib, the price is likely to go up target can be around 1,25000 and then to 1,30,000( weekly chart shows this target). Price should not fall below 115500,in this case it may further go down and take support around 1,10,000-1,12,000.
BTCUSD Technical Analysis | Smart Money Concept (SMC) BreakdownBTCUSD Technical Analysis | Smart Money Concept (SMC) Breakdown
🧠 Smart Money Market Structure Insight
📌 Key Elements Identified:
BOS (Break of Structure): Multiple BOS points indicate bullish intent early on. However, the latest BOS on July 14 followed by a significant drop signals a shift in momentum—possibly a distribution phase.
Liquidity Sweep: Price swept prior equal lows/liquidity before reversing, a typical Smart Money trap setup.
FVG (Fair Value Gap) / Imbalance: Identified around the mid-section of the chart—price filled partially but failed to hold, suggesting internal weakness.
Strong Support Zone (Demand Area): Marked between 115,000 - 114,640; this zone is anticipated to act as a springboard for bullish reversal.
📉 Current Price Action Observation:
BTCUSD is hovering around 118,152 - 118,560, moving sideways with lower highs indicating compression.
Price is projected to form a "W" pattern or double bottom in the shaded region.
Expected liquidity grab beneath 115,902 followed by potential bullish reaction targeting 121,562, as indicated by the white arrow.
🧩 Strategic Outlook & Potential Play:
🔻 Bearish Sweep First:
Market likely to sweep the support one more time, tapping into deeper liquidity pools between 115,000–114,640.
This is aligned with the concept of Smart Money hunting for retail stop-losses before reversing.
🔼 Bullish Recovery After Sweep:
Strong probability of bounce due to presence of:
Fair Value Gap (already tested),
Fresh demand zone,
Liquidity grab setup.
Projected Bullish Target: 121,562
Confirmation Needed: A strong bullish engulfing or BOS on lower timeframes near support.
🏷️ Conclusion:
This BTCUSD setup is a textbook Smart Money scenario: BOS ➝ Liquidity Grab ➝ FVG ➝ Reversal from Demand. Traders should wait for confirmation from the support region before entering long positions.

A small pull back for Btc A small pull back for Btc , in the weekly it will look like a fake out but it’s a wait and see

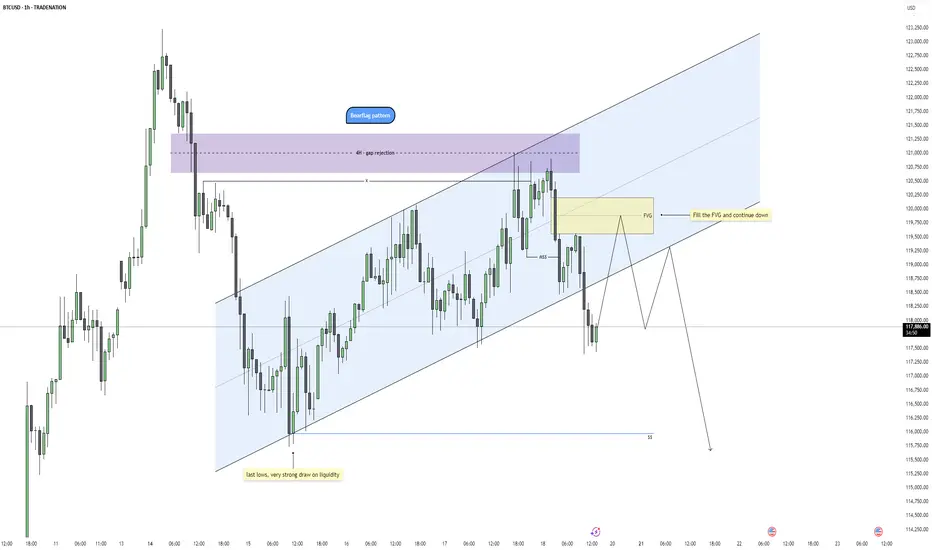
Bitcoin - Bearflag Structure Taking ShapeBitcoin is showing signs of weakness after a clean rejection from a 4H fair value gap, where price also swept the previous swing high. This aligns well with a broader bearish context as the market failed to sustain above the upper bounds of the trend channel, indicating potential exhaustion of the bullish correction.
Rejection Zone and Fair Value Gap
The rejection took place precisely within a 4H imbalance, adding confluence to the idea that this was a premium retracement in a bearish leg. The high formed inside that zone has now been swept, setting up conditions for distribution. A smaller 1H fair value gap was also left behind during the displacement move down, creating a clean area for price to return to and potentially react from.
Channel Structure and Bearflag Formation
Structurally, price has been climbing in a rising channel that resembles a bearflag pattern. The recent market structure shift broke the channel low, confirming that the rising structure is likely corrective. The rejection from the top of the flag and the subsequent breakdown align with a typical bearflag setup, suggesting a continuation move to the downside.
Short-Term Retracement Expectation
Before the next leg down, price may retrace to fill the unmitigated fair value gap while possibly sweeping the minor swing high that caused the current drop. This retracement would offer a premium shorting opportunity in alignment with the bearish bias, especially if internal structure remains weak on the lower timeframes during the return to the FVG.
Draw on Liquidity and Price Objective
The main objective for this setup is a sweep of the last equal lows near 115950, which represents a strong draw on liquidity. If the bearflag setup plays out fully, this area is highly vulnerable and could be the next significant target once the FVG is filled and lower timeframe distribution confirms.
Conclusion
Price has rejected from a 4H imbalance and swept liquidity to the upside, forming a clean bearflag structure. As long as price remains below the recent high and fills the 1H FVG without invalidating the shift, the path of least resistance looks to be down toward the liquidity resting below 115950. I’ll be watching for signs of weakness during the return to the FVG for a potential short trigger.
Disclosure: I am part of Trade Nation's Influencer program and receive a monthly fee for using their TradingView charts in my analysis.
___________________________________
Thanks for your support!
If you found this idea helpful or learned something new, drop a like 👍 and leave a comment, I’d love to hear your thoughts! 🚀
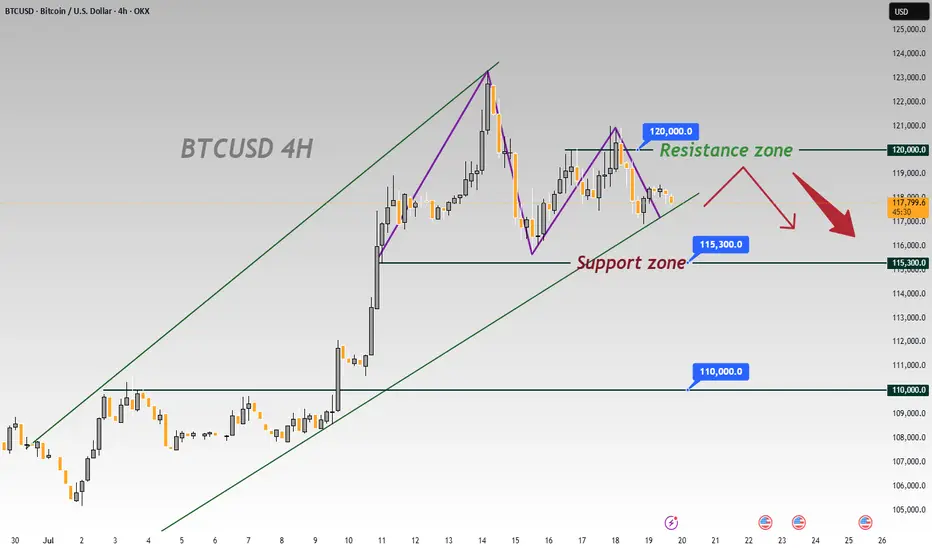
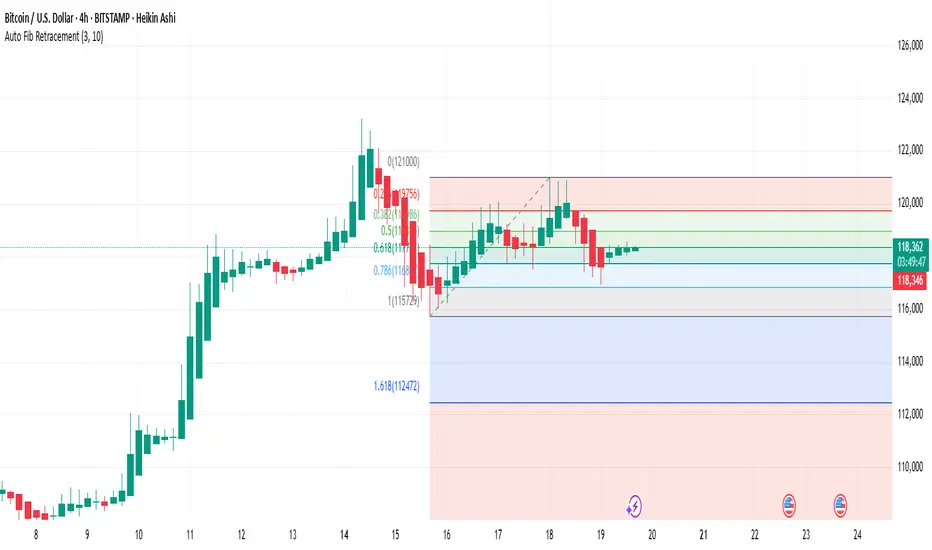
BTCUSD 4-Hour Chart Analysis: Range-Bound Trends & Key LevelsFrom the 4-hour chart of BTCUSD, the recent price movement shows obvious range-bound characteristics 📊. The upper zone around 120000 forms a key resistance level 🛑, where the bullish momentum has waned after encountering resistance 💨.
The lower level of 115300 is a significant support zone 🛡️. Previously, there was some buying support when the price retraced to this zone 👀. However, as the current price is pulling back from the resistance zone ↘️, if the bearish force takes the lead subsequently 🐻, the possibility of breaking below the 115300 support will increase ⬆️. Once it breaks below effectively 💥, the next key support level of 110000 will most likely become the target for the price to decline towards 🎯.
In terms of the short-term trend 📈, due to the obvious suppression from the resistance zone 🚧, the price will most likely continue the rhythm of testing the support downwards 🔽. In operation, one can pay attention to the breakdown situation of the support zone and layout trades accordingly 📝. Meanwhile, be alert to the possibility of a rebound after the price finds support in the support zone 🚀, and further confirmation of the direction needs to be combined with real-time K-line patterns 📊, trading volume 📈
🚀 Sell @119500 - 118500
🚀 TP 116500 - 115500
Accurate signals are updated every day 📈 If you encounter any problems during trading, these signals can serve as your reliable guide 🧭 Feel free to refer to them! I sincerely hope they'll be of great help to you 🌟 👇
BTC 106500 Liquidity Sweep BTC need liquidity sweep 🧹 biggest one before pump price to new ATH to 138500 so be ready for buy the dip 106500 buy area means sell now buy later on

CRYPTO-BTCUSD-SHORT TERM- SELL-SCALP PREDICTIONThe market made an impulsive move to the downside Friday 7/18/25 starting at 2am, leaving a FVG on the hourly, Price has retraced back to the hourly FVG around 118,511, expecting the market to temporarily sell off before move back to the upside. First TP is 116,914.

SellRejection Level
Daily Volume
Market Structure Shift
London US Session
Trend Line Break
Untapped Order Point

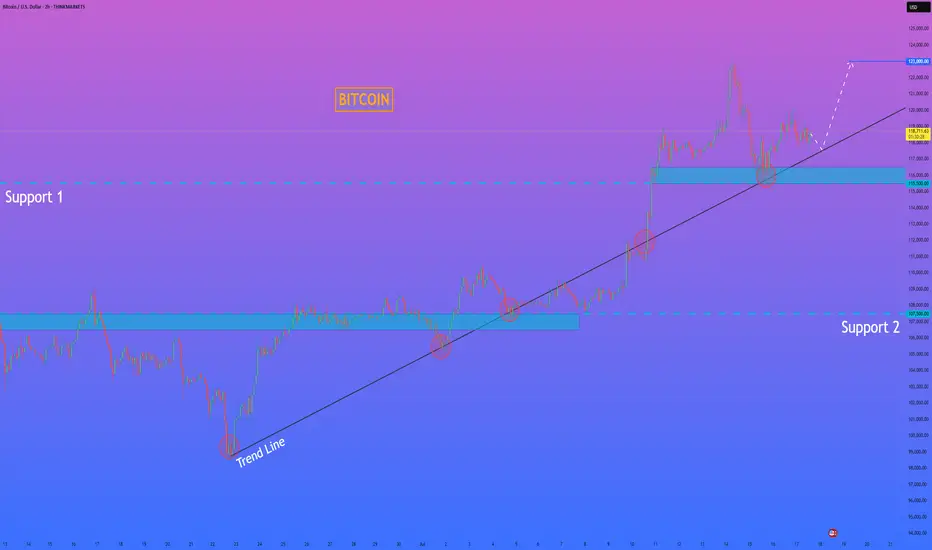
HelenP. I Bitcoin will correct to trend line and then start riseHi folks today I'm prepared for you Bitcoin analytics. The price has been trading in a strong bullish structure, clearly respecting the ascending trend line since the rebound from the 107500 level. Each time the price touched the trend line, it formed a higher low and continued the upward movement. After breaking through the important Support 1 zone (115500–116500), BTC made a strong impulse upward and reached a local high above 122000 points. Currently, the price is making a pullback and moving closer to the trend line again. This area has previously acted as a major point of interest for buyers, and now it's expected to play a key role once more. The support zone and trend line are converging, which makes this level critical for the next move. I believe BTCUSD will bounce from this area and continue its bullish momentum. My goal is set at 123000 points. Given the market structure, higher lows, and strong reaction from the support zones, I remain bullish and expect further growth from current levels. If you like my analytics you may support me with your like/comment ❤️
Disclaimer: As part of ThinkMarkets’ Influencer Program, I am sponsored to share and publish their charts in my analysis.
BTC #1-hour Bitcoin (BTC/USD) chartThis 1-hour Bitcoin (BTC/USD) chart shows a bearish setup following a breakdown from a rising channel. Price is currently testing a support zone around $117,000. A potential continuation move is projected down toward the $113,000–$114,000 area, where a reversal is anticipated. The red arrow indicates the expected bearish move, supported by prior structure and trend shift.
thanking you

Bitcoin Ready For Another Leg Higher?Bitcoin currently shows characteristics of bullish consolidation. Following a notable upward move after the election , the price action has entered a phase of sideways trading within a defined range since inauguration.
This period allows the market to digest recent gains and for buyers to accumulate further positions before the next anticipated leg up. Technical indicators, while showing a temporary pause in upward momentum, generally remain supportive of a bullish continuation, with key support levels S1-75k, S2-100k holding firm. The consolidation phase, marked by decreasing volatility, often precedes a strong directional move, suggesting that Bitcoin is coiling for another potential surge.

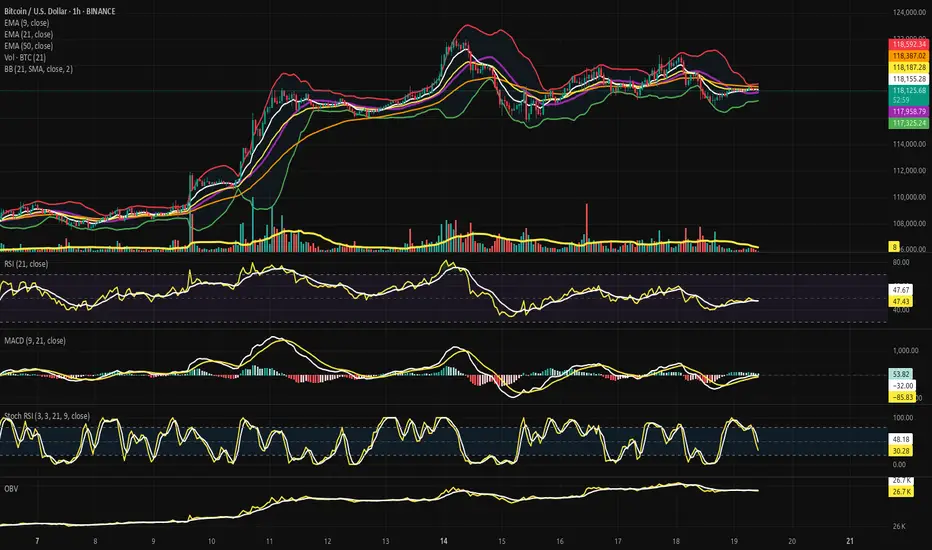
Bitcoin in Tactical Suspension - Beneath the Compression Veil.⊣
⨀ BTC/USD – BINANCE – (CHART: H1) – (July 19, 2025).
◇ Analysis Price: $118,192.34.
⊣
⨀ I. Temporal Axis - Strategic Interval - (H1):
▦ EMA9 - (Exponential Moving Average - 9 Close):
∴ Price: $118,192.34 | EMA9: $118,176.07;
∴ EMA9 is currently being pierced by price - neither clearly above nor decisively rejected;
∴ The EMA9 has flattened - signaling short-term equilibrium tension, not momentum dominance;
∴ Price candles are compressing into the EMA9 without thrust - indecision at the microstructure.
✴️ Conclusion: Logic sealed - EMA9 reflects tactical stalling; energy coiled at surface level.
⊢
▦ EMA21 - (Exponential Moving Average - 21 Close):
∴ EMA21: $118,199.53 - now above current price, acting as immediate tactical resistance;
∴ A minor bearish slope is forming in EMA21, reflecting recent downside pressure;
∴ Price failed to sustain any candle close above this level in the last 5 sessions - confirming resistance activation.
✴️ Conclusion: Logic sealed - EMA21 has turned from guide to barrier; tactical trend favors compression below.
⊢
▦ EMA50 - (Exponential Moving Average - 50 Close):
∴ EMA50 stands at $118,400.31, well above both price and the shorter EMA's - defining a ceiling of short-term exhaustion;
∴ Its curve is turning sideways, indicating that dominant upward momentum has faded;
∴ The last time price touched EMA50 was during the failed attempt to reclaim the upper Bollinger band - sign of rejection.
✴️ Conclusion: Logic sealed - EMA50 confirms the upper boundary of compression; the short-term trend remains capped.
⊢
▦ Bollinger Bands - (21 SMA, 2 Standard Deviations):
∴ Current BB range:
• Upper Band: $118,586.19;
• Lower Band: $117,291.33;
• Midline - (SMA21): $117,938.76;
∴ Price sits marginally above the midline, but beneath the upper band - indicating a neutral stance within the envelope;
∴ Bands are in a state of mild contraction, reflecting reduced volatility and lack of decisive breakout pressure;
∴ Price has failed to close above the upper band on multiple attempts, suggesting exhaustion without thrust;
✦ Tactical Signal:
• The flattened curvature of the bands and the centering of price near the midline indicates that the market is in compression;
• This condition favors mean-reversion trades or breakout anticipation setups, but lacks directional conviction;
• No squeeze pattern is imminent - but energy is coiling slowly.
✴️ Conclusion: Logic sealed - Bollinger structure is balanced, with compression overtaking directional thrust; breakout not yet awakened.
⊢
▦ Volume + EMA21 - (Tactical Volume Profile H1):
∴ The latest H1 volume candle registers 9 (unit scale), significantly below the average trend of the prior days;
∴ There has been a consistent decline in volume since the spike observed near the $120k rejection zone - participation is fading;
∴ Volume EMA21 is now visibly above most recent volume bars, signaling that market energy has dropped beneath its tactical baseline;
✦ Tactical Diagnosis:
• A market with low volume near compression zones often reflects lack of initiative, not calm;
• The absence of sellers is not strength - it is hesitation;
• The lack of follow-through volume confirms that current price action is drifting, not being driven.
∴ No volume-led breakout is forming - the structure is floating within silence.
✴️ Conclusion: Logic sealed - tactical volume profile confirms stasis; market awaits external spark to ignite movement.
⊢
▦ RSI (21) + EMA9 - (Relative Strength Index – H1):
∴ RSI value: 48.13, EMA9 of RSI: 47.86 - both seated precisely on the neutral axis (50), indicating momentum equilibrium;
∴ RSI has been flatlining between 45/50 for several hours, reflecting a lack of directional force from both bulls and bears;
∴ The minor bullish crossover of RSI over its EMA9 is present, but lacks slope, strength, or historical reliability in the current formation;
✦ Interpretation Layer:
• This is a classic pause zone - RSI not weak enough to signal reversal, not strong enough to suggest advance;
• The close proximity of RSI and its EMA9 suggests a market suspended in technical indecision;
• No bullish or bearish divergence is visible - just momentum silence.
∴ Tactical RSI echoes the broader reading: structure without drive, energy held in restraint.
✴️ Conclusion: Logic sealed - RSI reflects equilibrium; momentum direction is undefined and dormant.
⊢
▦ MACD (9,21) - (Tactical Momentum Engine - H1):
∴ Current MACD Line: (+165.21), Signal Line: (+188.36) - forming a bearish crossover, with the MACD line now trailing the signal line for multiple candles;
∴ The histogram is negative and expanding, confirming that bearish momentum is actively growing, not stalling;
∴ The slope of the MACD line has turned definitively downward, with no flattening in sight - this indicates a sustained momentum bleed;
✦ Tactical Interpretation:
• The momentum crest occurred near $119,700, and since then, MACD has been fading consistently;
• Price has failed to reclaim the MACD highs despite proximity, suggesting a divergence in effort vs. energy;
• This is not a false cross - but a validated tactical downturn with histogram acceleration.
∴ The engine beneath the structure is declining in output - the wheels turn, but they no longer drive.
✴️ Conclusion: Logic sealed - MACD confirms tactical momentum decay; the engine is reversing beneath the surface.
⊢
▦ Stochastic RSI (3,3,21,9) - (Short-Term Momentum Oscillator - H1):
∴ %K: 51.29, %D: 68.32 - a confirmed bearish crossover has occurred, with %K now beneath %D and both values descending;
∴ The oscillator has recently exited the overbought region (>80) and is now transitioning through the mid-zone, reflecting short-term loss of thrust;
∴ Price has failed to respond to prior overbought readings with continuation — indicating momentum dissipation without execution;
✦ Microstructure Insight:
• The current descending arc of %K + %D shows that micro-traders are unwinding positions;
• The zone between 50/70 is a tactical fading region, not a place of strength;
• Absence of a rebound in %K suggests that short-term buyers are standing down.
∴ This oscillator confirms that momentum is not only absent - it is actively declining at the tactical level.
✴️ Conclusion: Logic sealed - short-term momentum cycle is unwinding; compression reigns over velocity.
⊢
▦ OBV + EMA9 - (On-Balance Volume with Tactical Smoothing - H1):
∴ Current OBV: (–89.21K, EMA9 of OBV: –89.02K) - OBV remains slightly below its moving average, indicating a net negative flow of volume;
∴ While price has drifted sideways, OBV has continued to tilt downward, reflecting silent capital outflow beneath surface price stability;
∴ There is no upward curvature or crossover attempt - the OBV line remains submissive, signaling passivity or tactical retreat from market participants;
✦ Strategic Implication:
• The sustained divergence between OBV and price implies that larger hands are not accumulating - rather, they are disengaged;
• This condition often precedes fake breakouts or downward drifts, especially when unconfirmed by volume or RSI;
• The EMA9 serving as a lid rather than support confirms that internal flow is structurally bearish at the H1 frame.
∴ The tactical OBV structure reveals the undercurrent: orderless and hollow, despite price still holding ground.
✴️ Conclusion: Logic sealed - OBV confirms quiet withdrawal of pressure; tactical structure lacks foundational support.
⊢
🜎 Strategic Insight - Technical Oracle:
∴ The H1 tactical frame reveals a market in constrained inertia - price floats between short-term EMA's, yet every major momentum engine (MACD, Stochastic RSI, OBV) confirms internal recession;
∴ EMA's no longer guide - they constrain;
∴ Bollinger Bands contract - but hold no breakout;
∴ Volume is absent - and OBV confirms retreat;
∴ The chart is alive in form, yet dead in force;
∴ No element acts as initiator - only sustainers remain;
∴ The next tactical move must emerge externally, not organically.
✴️ Conclusion: The Tactical Oracle speaks - market energy is sealed beneath compression; movement is possible, but currently unprovoked.
⊢
▦ Structurally (H1):
✴️ Structurally: Neutral.
∴ Price floats near EMA9, below EMA21 and EMA50 - without rejection or breakthrough;
∴ No directional dominance has been established in the current cycle;
∴ Compression prevails over construction - this is not collapse, but pause.
✴️ Conclusion: Logic sealed - the structure is balanced but unsustained; no active trend is in command.
⊢
▦ Tactically: Suspended under Soft Compression:
∴ Momentum indicators (MACD, Stoch RSI, OBV) are all aligned in tactical decay - no upside thrust is evident;
∴ Volume remains below threshold and fails to accompany price fluctuations - a sign of apathy, not conflict;
∴ Price is trapped between EMA's and centered within Bollinger range - with no pressure buildup for breakout.
✴️ Conclusion: Logic sealed - the market is in tactical suspension, drifting within a soft compression chamber; movement requires external ignition.
⊢
⧉
· Cryptorvm Dominvs · MAGISTER ARCANVM · Vox Primordialis ·
⚜️ ⌬ - Wisdom begins in silence. Precision unfolds in strategy - ⌬ ⚜️
⧉
⊢
Bitcoin target 134k Bitcoin is in a completely Saudi channel and the target is the range of 130,000 to 134,000.
The bull run will start next week and the entire market is bullish.

BTC: What if the real bull run is just beginning?🚀 BTC/USD – Weekly buy signal on the way?
📈 EMA 7 / SMA 20 crossover validated on a weekly basis
✅ Long-term bullish trend
⏸️ Short-term trend neutral
In my opinion, a bullish continuation in the long-term remains possible, particularly via an AB = CD structure for patient investors.
Of course, in small time frames, volatility will be present, but the underlying trend remains positive.
📌 Pivotal zone to break:
104,432 – 109,396 USD
➡️ A break of this resistance would provide a real boost to the bullish trend.
Next? Let's close our eyes... and let the position run.
⚠️ Analysis for educational purposes – not financial advice.
💬 Do you believe this weekly signal? Or are you staying on the sidelines for now?

Bitcoin at the Crest of Structure - The Silence of Momentum.⊢
BTC/USD – BINANCE – (CHART: 1D) – (July 19, 2025).
◇ Analysis Price: $118,325.31
⊣
⨀ I. Temporal Axis - Strategic Interval - (1D):
▦ EMA9 - (Exponential Moving Average - 9 Close):
∴ Price is currently positioned above EMA9 at $117,218.67, confirming immediate bullish alignment;
∴ EMA9 is upward sloping and tightly hugging price candles, serving as the dominant intraday dynamic support;
∴ Every recent dip has been absorbed above or at EMA9, with no candle body close below it in the last 7 sessions.
✴️ Conclusion: Logic sealed - EMA9 holds command over short-term price structure; tactical momentum remains alive.
⊢
▦ EMA21 - (Exponential Moving Average - 21 Close):
∴ EMA21 currently rests at $114,658.53, forming the median layer of structural trend guidance;
∴ Price action remains significantly elevated above this level, showing that bulls retain medium-range control;
∴ EMA21 has not been tested since late June, reflecting a strong upside deviation from equilibrium.
✴️ Conclusion: Logic sealed - EMA21 serves as untested trend backbone; control remains firmly in favor of buyers.
⊢
▦ EMA50 - (Exponential Moving Average - 50 Close):
∴ EMA50 is currently located at $109,638.03, tracking long-range structural health;
∴ The moving average is gradually steepening, suggesting long-term strength and momentum acceleration;
∴ No violations or shadows have tested EMA50 since early May - reinforcing its strength as deep support.
✴️ Conclusion: Logic sealed - EMA50 anchors the structural uptrend; market remains far from long-term threat zone.
⊢
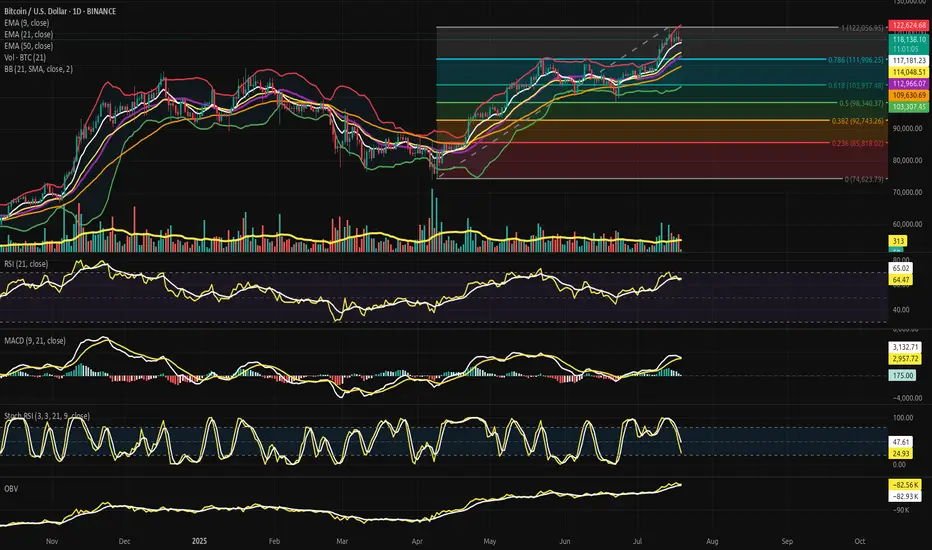
▦ Fibonacci Retracement – (1 = $122,056.95 / 0 = $74,623.79):
∴ The full Fibonacci range spans from the April low at $74,623.79 (0.0) to the July high at $122,056.95 (1.0) - anchoring the complete structure of the current macro move;
∴ Price is now positioned at $118,325.31, precisely above the 0.786 retracement level at $111,906.25, and beneath the 1.0 top - this zone represents the “golden upper quadrant,” a region where euphoria meets exhaustion;
∴ The 0.618 level ($103,937.45) remains untouched since early June, acting as the gravitational pull of equilibrium - its preservation confirms that no structural breakdown has occurred;
✦ Additional Level Mapping:
• 0.500 - $98,340.37: The neutral midpoint, remains far below - unchallenged;
• 0.382 - $92,743.26: The "warning belt" for medium-term trend decay;
• 0.236 - $85,818.02: A deep corrective zone, untouched and far from current price.
∴ Multiple zones of confluence exist between EMA21, BB midline, and 0.786, forming a strategic consolidation platform in the current price region;
∴ Failure to reclaim above 1.0 extension suggests bulls may be entering exhaustion while still structurally intact.
✴️ Conclusion: Logic sealed - price is trapped in the Fibonacci Gate (0.786 – 1.0); breakout requires decisive volume or reversion to golden support.
⊢
▦ Bollinger Bands - (SMA21 / 2 Standard Deviations):
∴ The current Bollinger structure shows band expansion, not contraction - upper band is at $122,653.00, lower band at $103,296.96, midline (SMA21) at $112,974.98;
∴ Price is moving above the midline, but no longer hugging the upper band - signaling that explosive momentum has waned while structure remains bullish;
∴ Last major push toward the upper band resulted in rejection near $122k, followed by sideways compression - implying the bands are preparing to resolve a volatility coil;
✦ Interpretative Observations:
• The midline (SMA21) is converging with the EMA21 and 0.786 Fib, forming a triple convergence layer - a key strategic battlefield;
• The distance between bands is approximately $19,356, indicating elevated volatility, but not chaos - directional tension remains unresolved;
• Band curvature suggests no imminent squeeze, but a potential for re-expansion if price reclaims upper territory.
∴ This structure shows a calm above chaos - volatility is present, but muted by the upper Fibonacci gate and internal exhaustion.
✴️ Conclusion: Logic sealed - volatility bands are wide and reactive, signaling buildup pressure; the next directional breach will likely define the next 30-day trend.
⊢
▦ Volume + EMA21 - (Volume Activity and Trend Average):
∴ The latest daily volume candle stands at 312 (unit scale), notably below the Volume EMA21, which trends around 418 - indicating waning participation post-breakout;
∴ The most recent breakout above $120k was accompanied by a singular spike in volume, followed by five consecutive days of volume decay - a typical exhaustion profile without follow-through;
∴ There has been no bullish volume expansion to defend price levels above $118k, suggesting that the upward move is unsupported by fresh demand;
✦ Tactical Observations:
• Volume is currently below the average trend line, which implies a lack of conviction on both sides - a vacuum state;
• The EMA21 of volume acts as a barometer of trend health - its breach to the downside indicates structural weakening beneath a seemingly bullish price;
• The low volume + high price condition signals silent divergence, often a precursor to compression, reversal, or manipulation.
∴ Price is elevated but unsupported, indicating the presence of “surface strength, internal fragility.”
✴️ Conclusion: Logic sealed - declining volume below trend average confirms demand fatigue; continuation is suspect without new influx.
⊢
▦ RSI (21) + EMA9 - (Relative Strength Index with Signal Smoothing):
∴ The RSI (21) reads at 64.72, having pulled back from a recent high near 74, suggesting a transition from euphoric thrust to reflective consolidation;
∴ The RSI line has dipped below its EMA9 signal, forming a soft negative crossover, typically interpreted as a waning of short-term momentum;
∴ Despite the loss of angle, RSI remains comfortably above the 50-line, which acts as the threshold between bullish continuation and structural deterioration;
✦ Interpretative Layers:
• The EMA9 of RSI functions here as a short-term momentum oscillator overlay - its breach confirms weakening, not reversal;
• RSI holding above 60 implies the presence of continued buy-side pressure - though fading;
• The divergence between price (near high range) and RSI (descending) establishes the groundwork for potential hidden weakness.
∴ RSI shows the archetype of a post-breakout exhaustion slope, yet refuses to break structurally - a signal of suspended momentum, not decay.
✴️ Conclusion: Logic sealed - momentum is cooling but not reversing; bulls remain structurally in control while energy dissipates.
⊢
▦ Stochastic RSI (3,3,21,9) - (Momentum Cycle Oscillator):
∴ The current values are: %K = 26.27, %D = 48.05 - showing a completed bearish crossover, with %K trailing beneath %D;
∴ The oscillator has already dipped into oversold (<20) and is now rebounding, yet fails to regain dominance over the signal line - this marks a failed bullish recovery pattern;
∴ Recent structure shows multiple failed attempts to reclaim high-band cycles, indicating that short-term traders are exiting, while major holders observe;
✦ Tactical Interpretations:
• The system has transitioned from bullish impulsive to corrective reflective - momentum is coiling instead of thrusting;
• The flattening of %D around the midline reflects indecision in micro-timeframe velocity;
• The double-rejection of %K near 80 last week forms a tactical top signal under stochastic doctrine.
∴ This oscillator, sensitive to short-term flows, declares the loss of tactical initiative by the bulls.
✴️ Conclusion: Logic sealed - short-term momentum cycle is decaying; the structure now favors consolidation or soft pullback.
⊢
▦ MACD (9,21) - (Moving Average Convergence Divergence):
∴ Current MACD line: (+2,961.80), Signal line: (+3,153.14) - indicating an active bearish crossover, as the MACD line has dropped below the signal;
∴ Histogram bars are negative and expanding, a key sign that downward momentum is growing, even as price remains elevated;
∴ This crossover has occurred at a relatively high amplitude, meaning the pullback potential is non-trivial - it is not a shallow fluctuation, but a structural transition;
✦ Structural Implications:
• The bearish crossover happened after divergence with price action - while Bitcoin reached new highs, MACD momentum did not, forming a classical bearish divergence;
• Momentum began decaying several sessions before price peaked - the indicator warned of exhaustion before price responded;
• The slope of the MACD line has steepened downward - a sign of gathering corrective force.
∴ This marks the first true warning from the momentum engine beneath the price - a shift from thrust to counter-pressure.
✴️ Conclusion: Logic sealed - MACD confirms structural momentum exhaustion; corrective forces are now in motion, though price has yet to reflect full impact.
⊢
▦ OBV + EMA9 - (On-Balance Volume with Trend Smoothing):
∴ Current OBV stands at (–82.93K), now below its EMA9, which reads (–82.57K) - indicating a loss of volume-weighted trend force from the buyers;
∴ While price remains elevated, OBV has been descending gradually, forming a clear bearish divergence between volume flow and price action;
∴ Over the last 7 daily sessions, OBV has failed to form any new high - even as BTC printed a new price peak - revealing that volume is silently exiting the market;
✦ Interpretative Reading:
• OBV below EMA9 confirms that cumulative volume pressure is negative - this undermines surface-level price strength;
• Divergence with price often precedes major pivot zones - the “hidden drain” effect;
• The OBV curve is now sloping downward with consistency, indicating that larger hands may be distributing while price remains deceptive.
∴ This structure carries the seal of silent distribution, a hallmark of late-cycle phases in bullish trends.
✴️ Conclusion: Logic sealed - OBV confirms internal outflow; market strength is no longer aligned with volume reality.
⊢
🜎 Strategic Insight – Technical Oracle:
∴ The 1D structural framework remains formally bullish, as price holds firmly above all exponential anchors (EMA9, 21, 50) and resides within the golden quadrant of the Fibonacci matrix;
∴ However, a triad of momentum signals - MACD, Stochastic RSI, and OBV - are all flashing early warnings of underlying exhaustion;
∴ The market breathes the air of height, yet the blood of energy runs thin;
∴ Volume no longer fuels ascent - momentum coils, not climbs;
∴ The surface remains calm, but the substructure contracts in silence;
∴ This is a phase of strategic suspension;
∴ Not yet a reversal - but no longer thrusting forward;
∴ A condition of uptrend fatigue, awaiting external force or internal reset.
✴️ Conclusion: The Oracle speaks - the trend is structurally preserved, but internally untrustworthy. The next move, when it comes, will be definitive.
⊢
▦ Structurally: Bullish.
∴ Price remains well above EMA50, EMA21, and EMA9;
∴ No bearish cross has occurred;
∴ Structure is elevated within upper Fibonacci zones - not broken.
⊢
▦ Momentum-wise: Bearish Divergence.
∴ MACD has crossed bearishly;
∴ OBV is declining despite price holding high;
∴ RSI and Stoch RSI confirm exhaustion.
⊢
✴️ Final Codex Interpretation:
∴ Structurally Bullish - Tactically Suspended;
∴ The frame holds, but the fuel has faded;
∴ Bulls possess the hilltop - but lack fire to advance;
∴ A breach or retreat shall define the next archetype.
⊢
⧉
· Cryptorvm Dominvs · MAGISTER ARCANVM · Vox Primordialis ·
⚜️ ⌬ - Wisdom begins in silence. Precision unfolds in strategy - ⌬ ⚜️
⧉
⊢
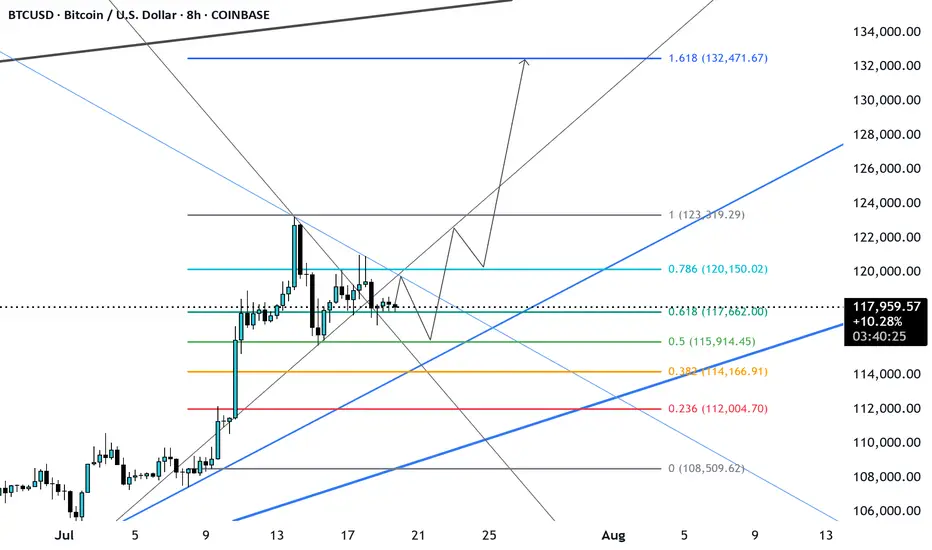
LAST BTC PUSH? Dear Community,
in order to expand my skills analysis, I will regularly share my analyses and ideas here on TradingView. I still consider myself a beginner in the “stock market” and “crypto” area and am therefore very much looking forward to your comments and input!
My primary assumption is that we are still in a final upward move. However, I am also pursuing alternative scenarios that could lead to significantly higher levels.
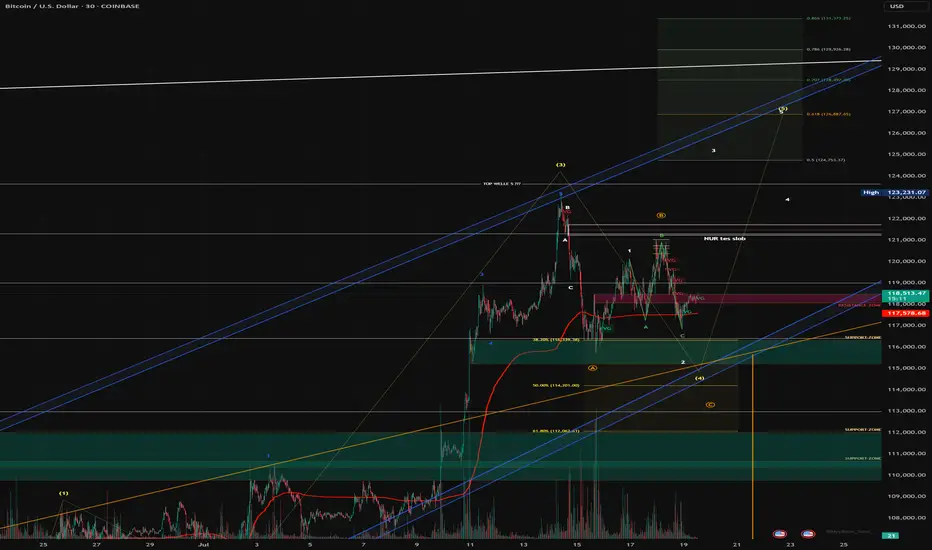
BTC analysis - 1H chart
In my analysis, wave (3) in yellow is complete and we are currently in wave (4) correction, which may not be complete yet.
My guess:
- Wave B (yellow) has been completed, wave C has extended and could still reach USD 113 679, where the Fibonacci 100 level is located. There is also an FVG in the 1H chart.
- A retest of the blue trend channel would be quite possible in order to pick up liquidity at this level before wave 5 (yellow) is completed between USD 126,887 and USD 130,000.
- My risk management is down to USD 107,326 (Fibonacci 1.866).
- We have already tested the Fibonacci 0.5 level (pullback level) and seen a positive reaction. However, we currently lack volume in the market.
- If the blue channel and the Fibonacci 100% level break, I have to assume an alternative count.
In this case, wave 4 would still have scope to reach the Fibonacci 61.8% level in the yellow box at USD 112,062.
If my current forecast does not materialize, I assume that we have already completed wave A and are in the correction to wave B, which will be followed by wave C - with a target of around USD 130,000 for the final impulse.
This scenario also fits in well with risk management up to the Fibonacci level of 1.866. There are also high liquidity areas (long) at this level, which are very attractive for market makers.
What do you think?
BTCUSD 1H – TCB Breakout Reclaim Setup📌 BTCUSD 1H – TCB Breakout Reclaim Setup
📆 Date: July 19, 2025
🔍 Strategy: TCB (Trend–Countertrend–Breakout)
🧠 Context:
BTCUSD broke below an ascending channel, found support at ~118,000, and is now attempting a reclaim of previous structure.
This is a classic reclaim zone setup — where a clean retest of prior support-turned-resistance turns back into support again, offering a breakout entry.
✅ TCB Checklist Summary:
Trend: ✅ Uptrend prior to break
Countertrend: ✅ Clean channel breakdown
Demand Zone: ✅ Strong reaction from 118k
Breakout Zone: 🔜 Watching 118,800
Confirmation Candle: 🔄 Awaiting bullish signal
🧮 Total Score: 8/10 = 80%
🔄 Projected 100% once:
Breakout candle above 118.8k confirms
NY session volume aligns
R:R: ✅ Clean 1:2+ to 120.4k
📈 Trade Plan (If Breakout Confirms):
Entry: Above 118,800 (after bullish close)
SL: Below 117,800
TP1: 119,800
TP2: 120,400
Risk: 0.5%–1.0% depending on position sizing
🔔 Alerts Set For:
Breakout Entry (118,800+)
TP1 Hit (119,800)
TP2 Hit (120,400)
SL Hit (117,800)
🧭 Note:
This trade is not yet active — confirmation required above 118.8k with session momentum (NY or strong engulfing candle). Clean reclaim = high-quality continuation setup in TCB strategy.
📓 Using the TCB method helps filter low-quality breakouts and confirms structure before entry. Wait for the reclaim and momentum confirmation before executing.
💬 Let me know in the comments if you're watching this or trading similar setups on BTC!
#BTCUSD #Crypto #PriceAction #TradingView #TCBStrategy #Breakout #TechnicalAnalysis #ReclaimSetup #SmartTrading

BTC/USD POTENTIAL SELL OPPORTUNITY!A sell opportunity is what we envisage in this market from the H4 timeframe.
After the new high was made, the market formed a bearish flag pattern like pattern. We’re looking for to selling from the current market price. Our target profit is $111,000

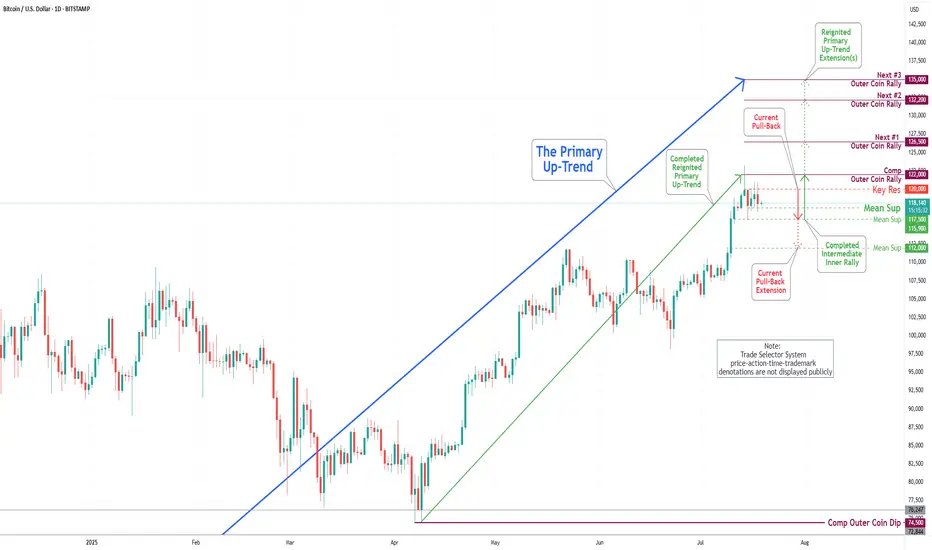
Bitcoin(BTC/USD) Daily Chart Analysis For Week of July 18, 2025Technical Analysis and Outlook:
In last week's trading session, we achieved a new historical high by completing our Outer Coin Rally at 122000. Following this milestone, the coin retraced, as expected, to the newly established Mean Support at 115900 and is currently trading at the Intermediate Mean Support at 117500. Presently, the coin is set to retest the Mean Support at 115900, with the potential for a further pullback to the Mean Support at 112000. This anticipated decline will necessitate a retest for the completed Outer Coin Rally at 122000. The designated targets for the renewed Primary Up-Trend are 126500, 132200, and 135000.