Next target for the legendary Bitcoin: $143,000🚀 Keep buying the dips all the way to the top.
📈 Algo traders: lock your EAs on LONG.
Need one? Check the link in my bio 😉
#Bitcoin #CryptoTrading #BTC143K #BuyTheDip #AlgoTrading #EAs
BTCUSD.P trade ideas

USD WEAKNESS COULD TRIGGER COMMODITY/CRYPTO SURGEAlphaTrend is an advanced trading indicator that leverages proprietary tools, real-time data, and custom metrics to give traders a competitive edge. Designed for all experience levels, it works instantly—no advanced charting skills required.
ADVANCED and PRO versions are available. (See below)
🔍 How It Works
At the core of AlphaTrend is Dynamic Reversion Bands — a sophisticated real-time system that adapts to price action by automatically adjusting to evolving market conditions.
These bands act like a roadmap, helping traders identify:
Mean reversion trade opportunities
Trend strength
Emotion-driven market conditions (like FOMO)
The system is rooted in Mean Reversion Theory:
If an asset's price deviates significantly from its historical average, it tends to “revert” back to that average over time. Traders can use this behavior to spot potential buying or selling opportunities:
Overbought Conditions: If the price moves too far above the mean, it may signal a pullback—traders might sell or short.
Oversold Conditions: If the price drops well below the mean, it may be undervalued—traders might buy in anticipation of a bounce.
⚪🟡🔴🟡⚪ Dynamic DOTS
AlphaTrend visualizes market overextension through dynamic DOTS:
White DOTS = Average conditions
Yellow DOTS = Above average conditions
Red DOTS = Extreme conditions
The DOTS update in real time as the candle is forming—appearing, disappearing, and shifting color based on current intensity levels. Once the candle closes, however, the DOTS do not repaint. This ensures clarity and confidence in every signal.
This is crucial, as many indicators repaint and revise data after the fact, undermining traders’ trust. With AlphaTrend, once a candle closes, the data remains permanently fixed.
📊 Adaptability and Market Insight
AlphaTrend adapts to any timeframe, but performs best on longer-duration candles, where signals are fewer but more reliable. Multi-interval displays (e.g., 1hr, 4hr, Daily) are highly recommended. That being said it does tend to give strong signals on all time frames even down to 1 min candles.
The tool also integrates several intuitive market overlays:
Auto-generated support and resistance levels
Real-time supply and demand zones
Money flow tracking from institutions and banks
BTCUSD scalpWe are looking at classical liquidity concept in which we anticipate price to pull back $115k in order to determine to continue with the bullish move or not however, for extra confluence, we have to look at buyers and sellers market volume and control
BTC - Onward and upwardThe 200 EMA is about to cross the 200 DMA and I show the last time that happened then I use the fractal from that period to project what BTC could do if something similar. It also lines up with fibs and channels. Let's see what happens

Btcusd techinical analysis.This chart displays the Bitcoin (BTC/USD) 1-hour candlestick chart on OKX, featuring a detailed technical analysis using harmonic patterns and chart structures.
Key Observations:
1. Harmonic Patterns:
Multiple harmonic/flag-like patterns are shown, both bullish and bearish.
These include retracements marked with Fibonacci ratios (e.g., 0.747 and 0.871), suggesting price reversal zones.
2. Support and Resistance:
Several horizontal purple lines indicate key support and resistance levels.
Strong support is visible around the 116,800 – 117,000 range.
Resistance appears near the 118,000 – 118,400 range.
3. Ascending Triangle Formation:
On the far right, an orange ascending triangle has formed, a typically bullish continuation pattern.
The blue arrow suggests a projected breakout to the upside, targeting around 118,400.
4. Bullish Reversal Indication:
A reversal (marked by a ⚡ icon) from the lower support zone around 117,000 seems to have initiated an upward move.
The zigzagging blue path shows a bullish scenario of higher highs and higher lows.
---
Summary:
The chart suggests bullish momentum building with a likely breakout from the ascending triangle pattern, targeting the 118,400 resistance level. Confirmation of the breakout would ideally come with strong volume and a close above 118,000.
Would you like a possible

Bitcoin - Blue Skies, Retest Before $125k?Bitcoin has pushed into blue skies after breaking through a major resistance zone around 110,000 USD. The breakout was sharp and impulsive, pushing price well into uncharted territory above 117,000. At these levels, traditional resistance becomes harder to pinpoint, and the market often behaves irrationally, so caution is warranted. With all-time highs being challenged, any small retracement must be handled with precision.
Support and Retest Zones
The previous resistance zone between 109,000 and 111,000 has now turned into a potential support area. This level acted as a ceiling for weeks and was finally broken with strong momentum. Price already had a minor retest on the breakout candle, which offers a bullish sign of acceptance. However, a deeper retest of this same zone remains a valid possibility, especially if short-term profit-taking intensifies.
Trendline Confluence
Alongside the horizontal support, we have an ascending trendline that has guided price from the June lows. This trendline now intersects with the 111,000–113,000 area, offering a secondary potential bounce level. If Bitcoin holds the trendline, a shallower correction could be enough to reset before another rally. But if we break below it, the horizontal support remains the final stronghold before deeper downside risks emerge.
Short-Term Scenarios
There are two likely short-term paths here. Either Bitcoin continues higher without a deep pullback, targeting 120,000–125,000 directly, or we see one more sweep into the 111,000 area before the trend resumes. The first scenario would trap sidelined traders, forcing late entries at higher levels. The second would provide a clean retest of structure, fueling a healthier, more sustainable breakout.
Price Target and Expectations
Assuming the retest scenario plays out cleanly and price confirms support at either the trendline or the former resistance zone, upside targets sit around 120,000 as the next psychological barrier, with 125,000 as a likely extension. These are natural magnet levels in a trending environment, especially with momentum still intact from the previous breakout.
Conclusion
Bitcoin is currently in price discovery, which means the structure must guide our expectations. A retest of either the trendline or former resistance could provide the next best entry. As long as we hold above the green support zone, the bullish structure remains intact, and higher targets remain in sight.
Disclosure: I am part of Trade Nation's Influencer program and receive a monthly fee for using their TradingView charts in my analysis.
___________________________________
Thanks for your support!
If you found this idea helpful or learned something new, drop a like 👍 and leave a comment, I’d love to hear your thoughts! 🚀

Bitcoin price increaseAfter the tensions between traders in the United States and the strong price fluctuations in the dollar and other stocks, and after the 3-month increase in gold, this time it will be the turn of digital currencies to increase again and there are signs of their increase in the market. For Bitcoin, two increase targets can be considered: $110,000 - $120,000.
Sasha Charkhchian

Decisive moments: breakout of longtime trendchannel or down downAs you can see we have been moving around a longtime trendchannel. Could this the needed outbreak? Or are we close to the end of the uptrend? We will know soon.... Anything could happen now. Don't BELIEVE... just look at the signs!

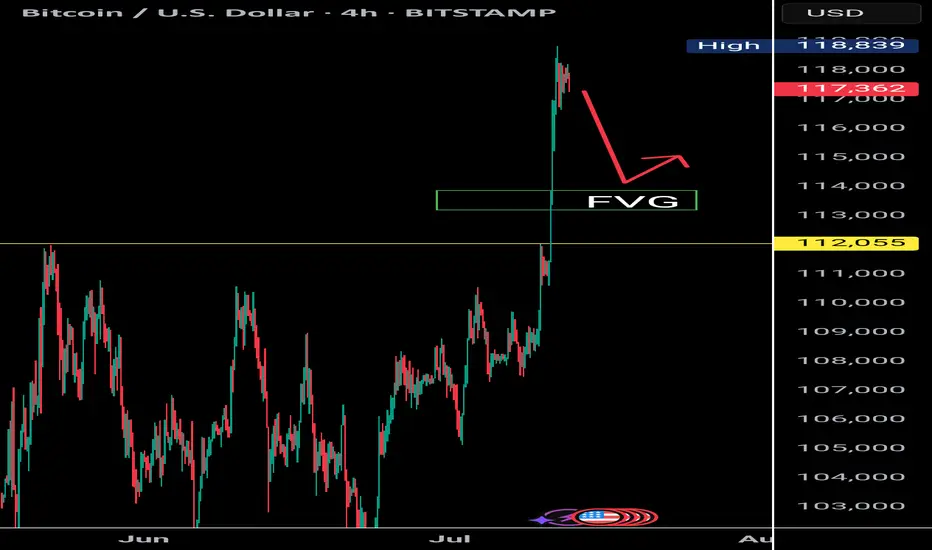
Bitcoin more high opportunity BTCUSD 4H | New Highs in Play
Price has broken structure with strong momentum. A bullish retest near 116,000–116,800 could trigger the next leg up toward the 120,000–121,000 target zone. Watching for price reaction at demand to confirm continuation.

$BTC Rejection at 119K | Eyes on 112K Retest as RSI Cools DownBitcoin faces strong rejection near the $119K resistance zone, showing signs of a cooling market as the RSI exits the overbought territory. Historically, BTC tends to revisit key structural levels after such overheated moves. A favorable re-test zone lies between $114K and $112K, with $112K aligning closely with the previous all-time high — a psychologically significant support area.
Support levels to watch: $112K (favorable retest) and $110K (strong base).
As RSI continues to cool, keep an eye on bullish reactions around these levels for potential entries.
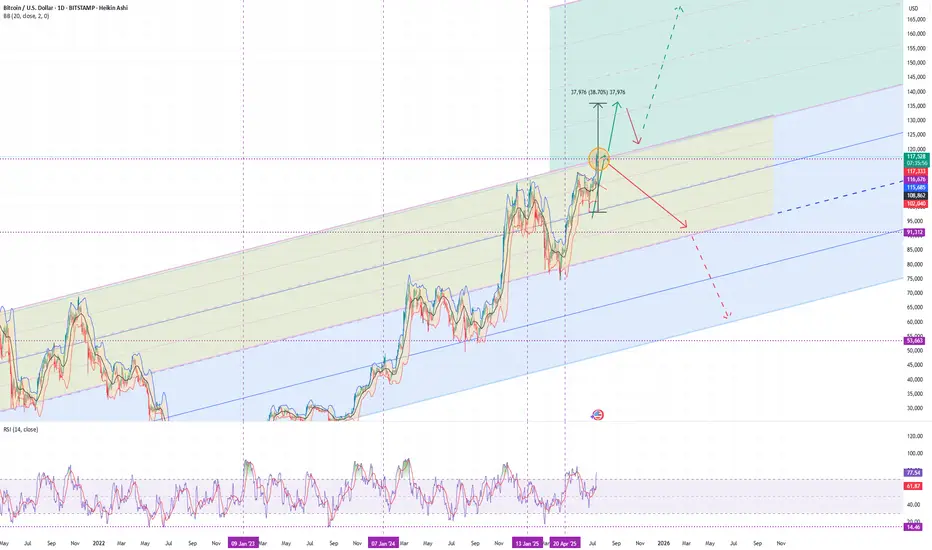
BTC/USDStill the most likely scenario. I believe we're near peak positive sentiment.
As I stated prior:
"I've been calling for a crash for a while.
The closer to the top you are, the more hatred that you'll get for calling one.
It's a difficult position being contrary to the crowd. I think that's why Peter denied Jesus.
In any case, positive sentiment must end and as overdue as it is, I'm expecting a bang, after a final wave of FOMO."

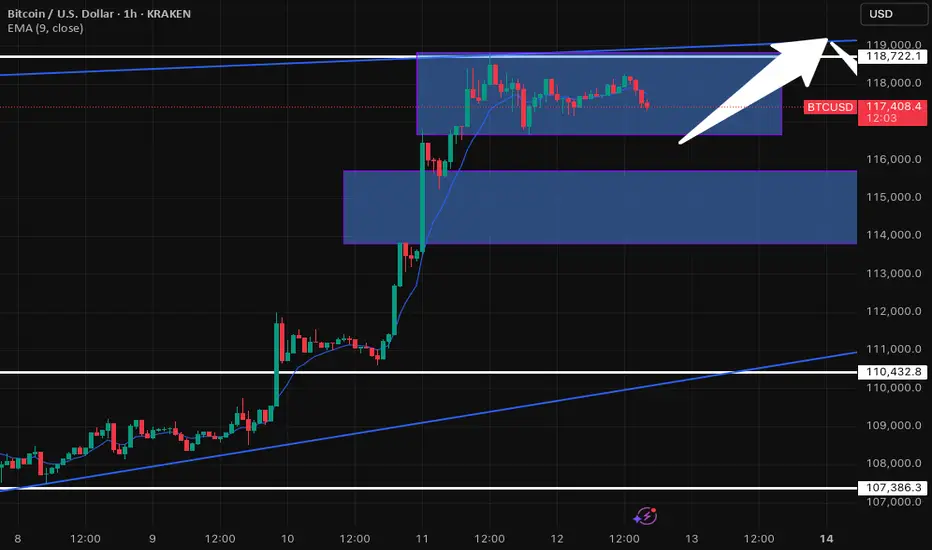
BTC/USD 1H: Uptrend Consolidation - Key Levels to WatchQuick Look at Bitcoin (BTC/USD) on the 1-Hour Chart - Kraken
Alright, let's dive into what Bitcoin's doing on the 1-hour chart. We've seen BTC in a pretty solid uptrend lately, cruising nicely within that ascending channel. It recently had a fantastic run, pushing right past the $110,432.8 resistance level – a great sign!
But now, it looks like Bitcoin is taking a breather. It's currently consolidating in that upper blue box, roughly hanging out between $116,000 and $118,000. This kind of sideways movement often means the market is trying to figure out its next big move after a strong push. Are buyers reloading, or are sellers starting to step in? That's the big question.
Here's what I'm keeping an eye on:
On the Upside: The immediate hurdle is the top of this current consolidation range, right around $118,722.1, which also lines up with the upper trendline of our channel. If Bitcoin can break convincingly above that, we could see another leg up – definitely a bullish signal!
On the Downside: If it can't hold this range and starts to dip, the first area of interest for support is that lower blue box, roughly $114,000 to $115,000. That's where I'd expect some buyers to potentially step back in.
Stronger Safety Nets: Don't forget that $110,432.8 level. It was tough resistance before, so it should now act as a pretty strong support if we see a deeper pullback. And, of course, the bottom trendline of our ascending channel and $107,386.3 are there as well.
My Takeaway:
Bitcoin's in a strong position overall, but this consolidation is key. The next big move will tell us a lot. Keep an eye on those breakout or breakdown points – that's where the action will be!
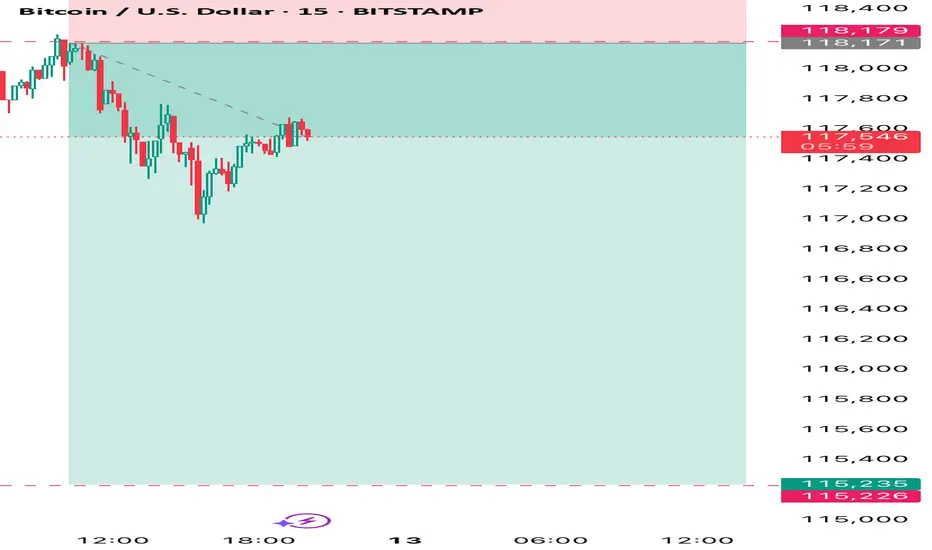
Sell BTCUSD BTCUSD will decline from 117000 towards 115000 in today's trading session. A break of structure occurred and now price seems to be free falling.

BTC/USDI've been calling for a crash for a while.
The closer to the top you are, the more hatred that you'll get for calling one.
It's a difficult position being contrary to the crowd. I think that's why Peter denied Jesus.
In any case, positive sentiment must end and as overdue as it is, I'm expecting a bang, after a final wave of FOMO.

bitcoin will go down for the next 8hrs After sweep the liquidity above 118098. the price goes down for the correction . I expect it will reach the one hr order block at 115911.
Entry : 118098- 117500
St : 118200
tp: 116000
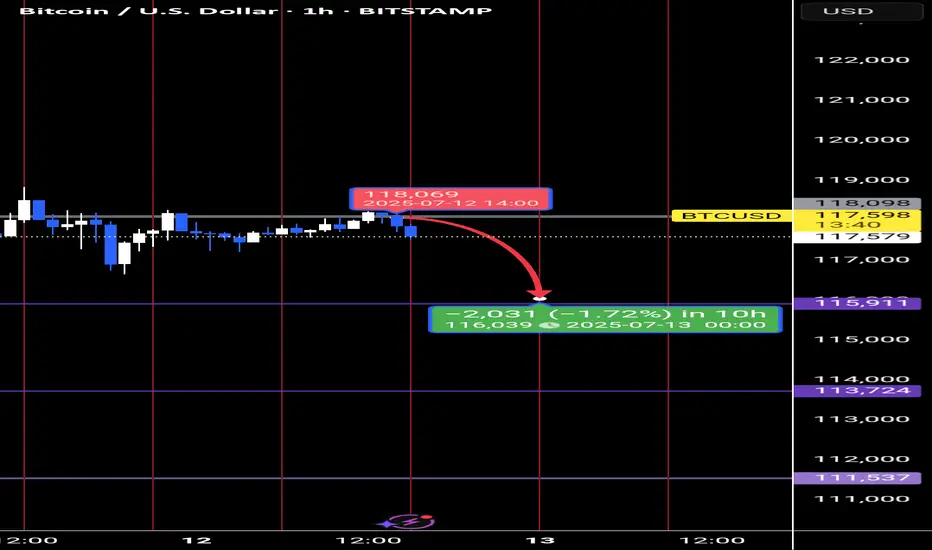
bitcoin down for 8 hrAfter sweep the liquidity above 118098. the price will correct may be to 115911 or more ...
for the next 8 hrs I expect it will reach the 1 hr order block at 115911.
entry : 118098- 117000
tk: 115911 or end of time cycle of 8hr
St: 118198

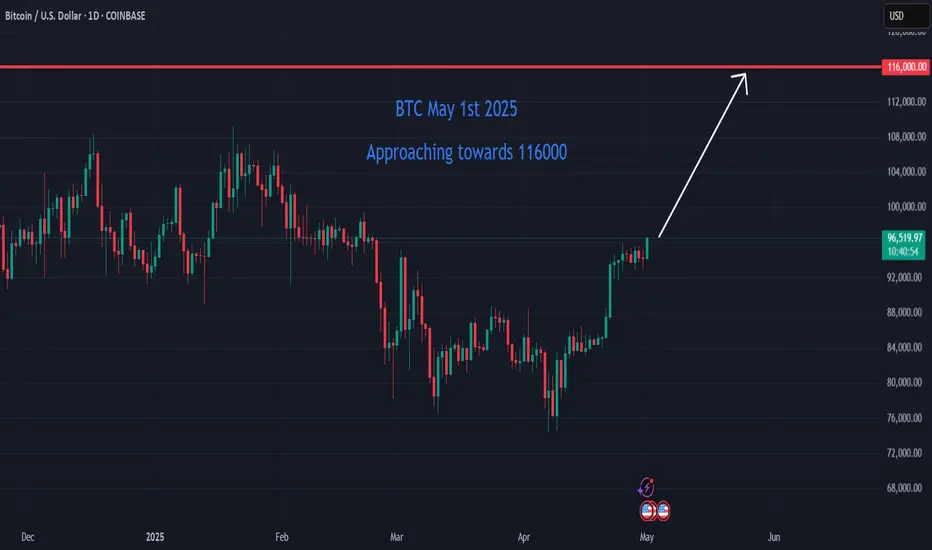
Bitcoin on the Brink: Short-Term Surge Toward $116K Bitcoin (BTC) is currently trading at approximately $96,390, approaching the $116,000 mark. Here's a short-term analysis using Cycle Analysis, Elliott Wave Theory, and Gann Analysis to inform potential trading strategies.
________________________________________
📈 Cycle Analysis: Mid-2025 Surge
Historical patterns suggest that Bitcoin tends to reach its peak between 518 and 546 days after a halving event. Given the most recent halving in April 2024, analysts anticipate a potential price peak around mid-2025, approximately 1.5 years post-halving. Notably, Bitcoin is currently about 35 days ahead of its typical cycle, indicating a possible acceleration in price growth.
________________________________________
📊 Elliott Wave Analysis: Wave 3 in Progress
Elliott Wave Theory suggests that Bitcoin is currently in the third wave of its bullish cycle, which is typically the most powerful and extended wave. Recent analyses indicate that the third wave is unfolding, with potential targets ranging from $114,500 to $120,500. A conservative estimate places the peak of this wave between $127,000 and $150,000
________________________________________
📐 Gann Analysis: Price-Time Equilibrium
Gann Analysis utilizes geometric angles to predict price movements. The "2×1 Fan" line, representing a 45-degree angle, is considered a fair value line. Historically, Bitcoin's price has peaked near this line during parabolic run-ups. Currently, Bitcoin's price is approaching this level, suggesting a potential peak.
________________________________________
🧭 Short-Term Trade Setup
✅ Entry Points:
• Accumulation Zone: $85,000 to $90,000
• Current Price: $96,390
🎯 Target Levels:
• Short-Term Peak: $116,000 to $135,000
• Medium-Term Peak: $150,000
⚠️ Risk Management:
• Potential Correction: After reaching the peak, anticipate a significant pullback, possibly 30–50%.
• Exit Strategy: Consider taking profits as Bitcoin approaches upper resistance zones.
________________________________________
🧾 Conclusion
Bitcoin is in the final stages of its current bullish cycle, with projections indicating a potential peak between $150,000 and $278,000. However, caution is warranted as market corrections are typical following such surges. Investors should consider taking profits as Bitcoin approaches upper resistance levels and prepare for potential pullbacks.
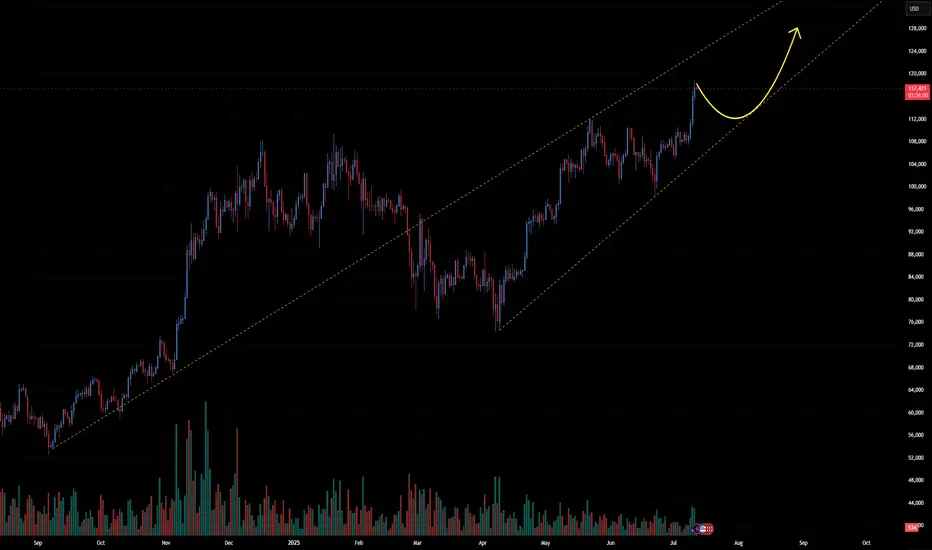
Would you Look at this ... 💁♂️💁♂️💁♂️ Ok, I have only taken 1 course of TA And somehow I am able to draw the perfect trajectory of the Course of BTC. Now the question is how high will we go... Follow for the next Prediction

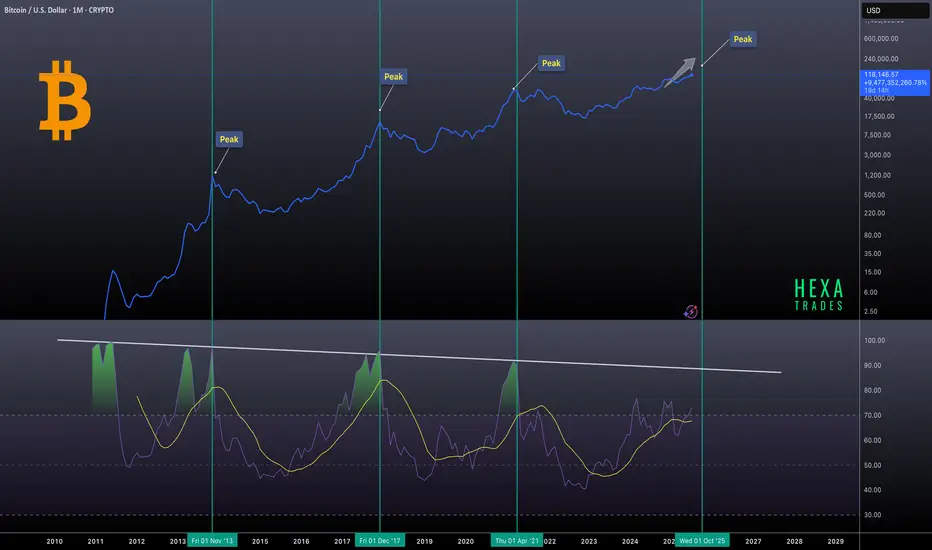
Bitcoin Macro Cycles: Sell Signal at RSI 90Bitcoin’s historical market cycles, using monthly RSI data to identify previous bull market peaks. Notable tops in 2013, 2017, and 2021 are highlighted, with the next potential peak projected around October 2025. A consistent pattern emerges where each market top aligns with the monthly RSI reaching or nearing the 90 level, indicating extremely overbought conditions.
Sell when the monthly RSI hits 90. This has consistently marked previous market tops and can serve as a reliable signal for long-term investors.
I had predicted a breakout in bitcoin a few days agoI had predicted a breakout in bitcoin a few days ago, see its result on the chart today

Sell bitcoin now because we are seeing a quick momentum changeSell bitcoin now because we are seeing a quick momentum change, close our
Buy position on small profit and take a sell now

The idea is super clear Bitcoin works with pattern repetition, currently defied the double top pattern and that's just the last solid confirmation needed to break the ice.
