BTCUSD.P trade ideas
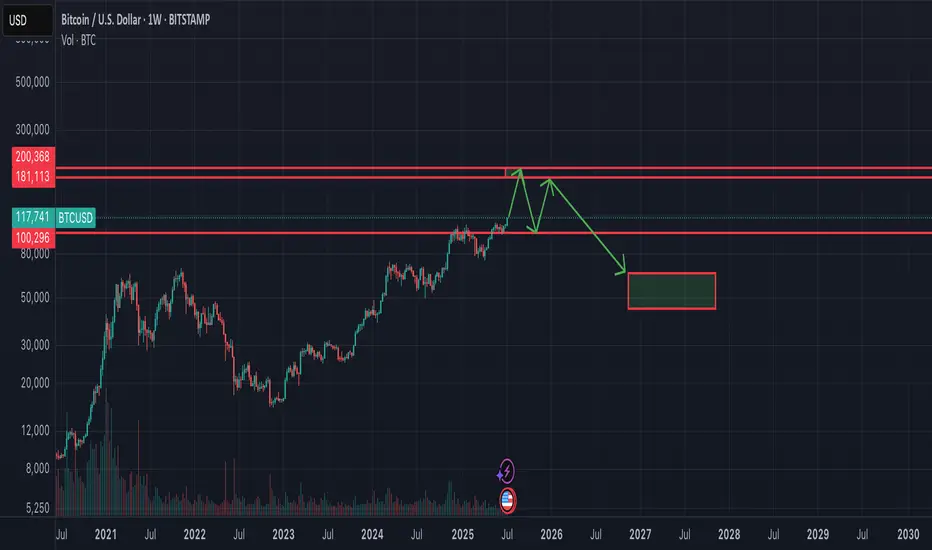
End of Bitcoin cycle this Year nearly 180-200k$ The Great Depression 2.0 ahead and all politicians already know it and prepare to blame all their troubles on the crisis.. I think Bitcoin will reach 180-200k$ till the beginning or the end of september. Need to track the price of gold - Bitcoin ATH near the 55 oz of gold!
After reaching the peak - there will be dump -50%. September and October as the best months for bitcoin in 2025 would be the worst months. November and December maybe green - to close some nice year candle (giving to altcoins last chance for performing) and after that going into the bear market.
BTCUSD supported at 114,000BTCUSD broken a major resistance at 113,000.
I would be buying any dip towards 114,000 for higher levels.
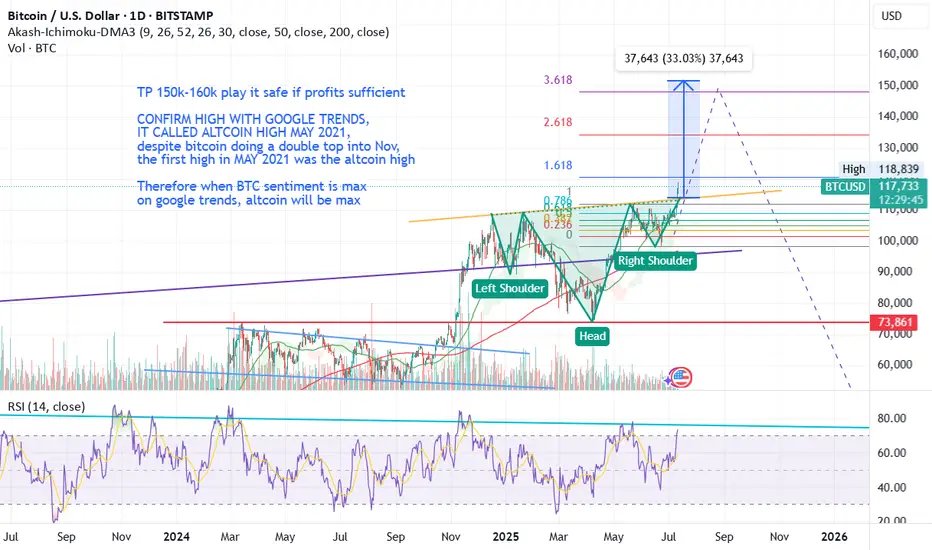
The target is located at 150,000 and 160,000 in coming three months.

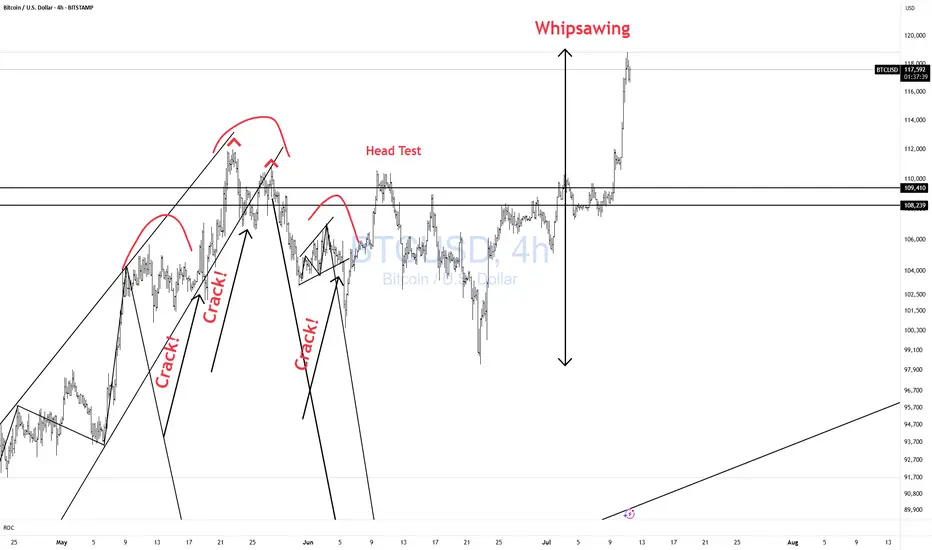
BTCUSD Whipsawing! CAUTION!Bulls CAUTION! Price is whipsawing all over the place.
Better to be out of the market wishing you were in than in wishing you were out!! Don't chase!!
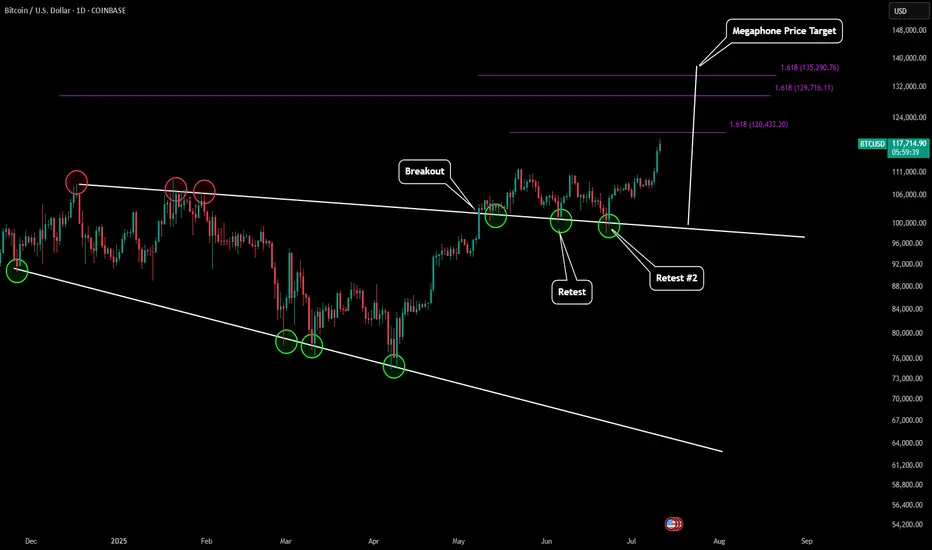
BTC - Next ATH Upside Price Targets After outlining the last low for BTC (which can be found here):
Now BTC is skyrocketing to new all time highs. Based on predictive Fibonacci modeling and also our price target of our macro megaphone pattern we can estimate where BTC's next top might be.
Our first target is just slightly above $120k. This would be our extension target of our most recent LFT trend.
If we take a look back at our last mid-macro trend it would give us an extension target slightly below $130k.
Our final target would be $135-136k which would be from our last high to our last low of our mid-macro trend. This is also in alignment with the full measured move of our megaphone pattern.
As more candle structure form around these levels we will update this prediction with even more precise targets. Happy All Time High everyone!
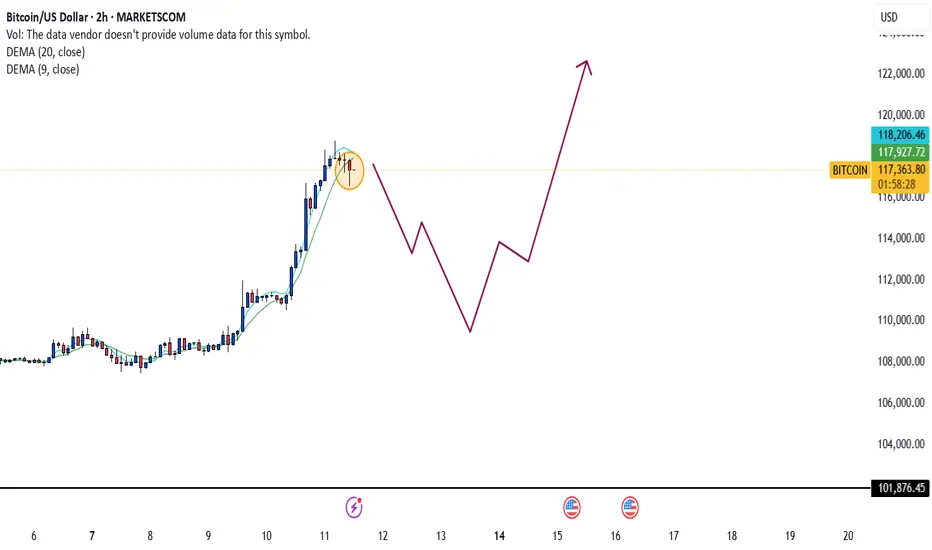
Bitcoin Money machinebeautiful bearish candlstick has been created a the top of the wave , thechnicaly the price might go for a retracement to fuel back up again , place a short position while maintaining a good money management its tricky some time with what's going on
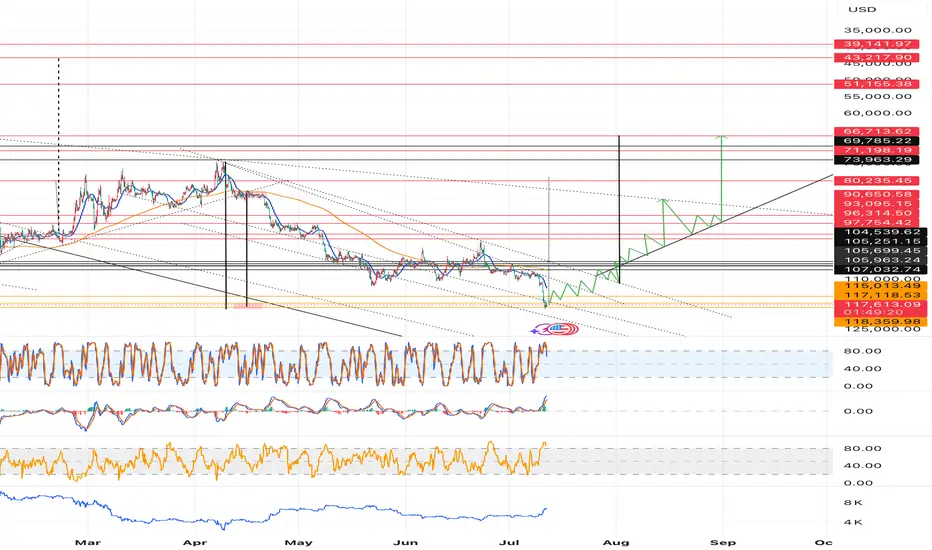
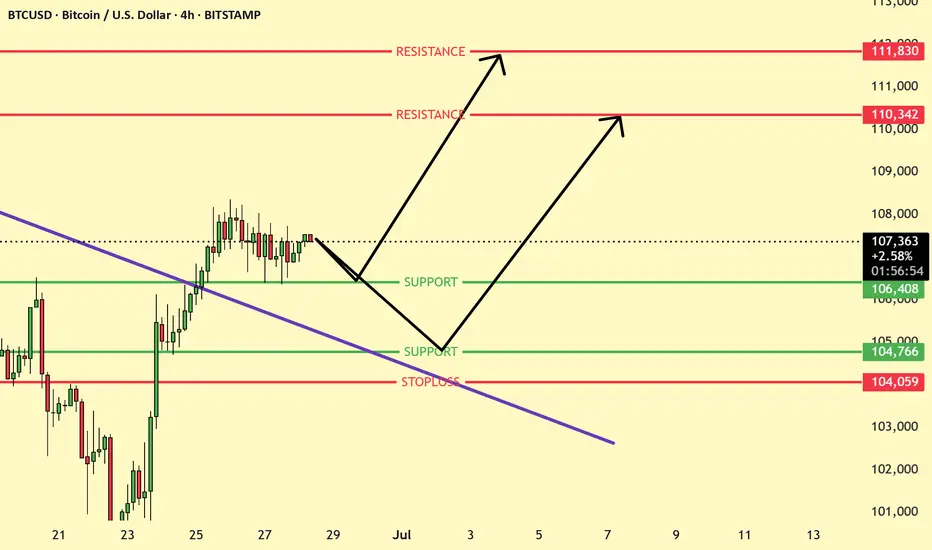
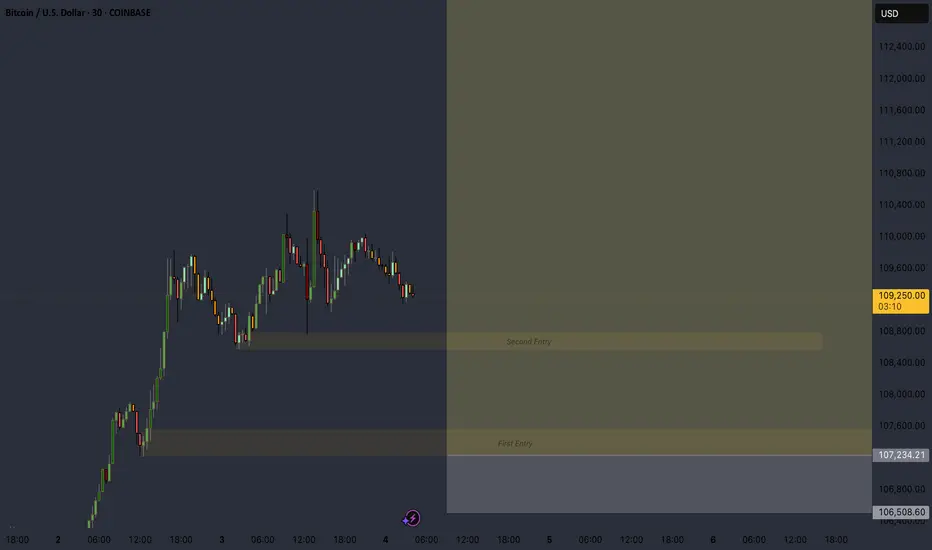
BTCUSD Set up Ready for LongBTCUSD is consolidating around 107,372 after a breakout. Two bullish scenarios are shown: a bounce from 106,408 or a deeper pullback to 104,766 before rallying. Key resistances lie at 110,342 and 111,830. Bullish bias holds as long as price stays above 104,059.
BTC to 150KYup.
I have been following this always,
so I’m sorry for the lack of updates, but life has sidetracked me
I will post more soon

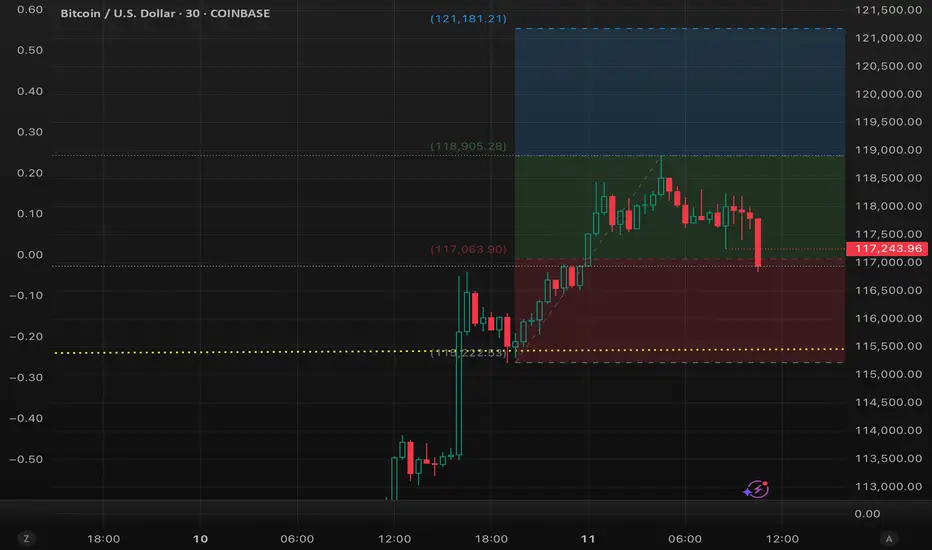
Keep an eye on 117k as the level to stay above.This is the first time in 7 years that Bitcoin has been able to push up through a long trendline originating in 2018. And this is the longest time we have been above this level, with April 2021 spending one day above it.
Yes, all those shorts calling for a deep retracement got rekt, but a clock is right once a day - so there is always that possibility that we will see some profit taking and consolidation here.
We want to stay above the low in this latest move at 117,250 USD. And we are trying to close the day above the 50% of this latest move, which comes in at 117k USD. Anything less increases the risk of a pullback to digest these latest gains.
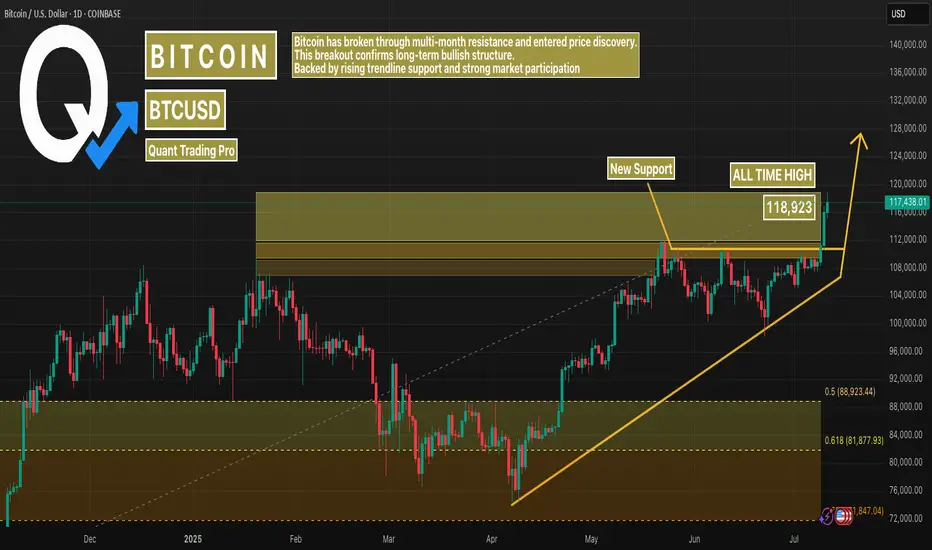
Bitcoin Sets New All-Time High – The Bull Run Is OnBitcoin has just printed a new all-time high, breaking decisively above its previous record and entering price discovery. After months of consolidation below resistance, the breakout above ~$118K confirms a major shift in market structure — from sideways to breakout phase.
This level isn’t just a number — it’s a psychological turning point. ATH breakouts often fuel aggressive momentum, FOMO, and trend acceleration, especially with no historical resistance above. All eyes now shift to round levels like $125K and $135K.
📈 New ATH: $118,923
📊 Previous Resistance: $109K → Now Support
🧠 This is what breakout structure looks like on a macro scale.
#BTC #BitcoinATH #AllTimeHigh #PriceDiscovery #CryptoMomentum #BTCUSD #TradingView
Shorting Isn’t the Problem. Being a Psycho Bear Is.😵💫🪓 Shorting Isn’t the Problem. Being a Psycho Bear Is. 🔻📉
Hollywood is never wrong:
The genius from The Big Short is the psycho from American Psycho .
Same actor (C. Bale) — two sides of the same trader.
🎭 I made this chart because I see this often on TradingView:
People who prefer to short. Hoping for collapse.
Even Rooting for war. To Celebrating blood short profit.
Perma-bears who hate seeing price go up because they missed the trade.
Let’s be real — that’s not trading.
That’s emotional self-destruction masked as 'strategy'.
We just saw over $1B in shorts liquidated as Bitcoin ripped through $118K.
And still — some refuse to let go of their bias.
This chart says it all:
🔹 The "Smart Bear" — does research, uses structure, trades what’s real.
🔻 The "Psycho Bear" — needs things to collapse, just to feel right.
💔 And here’s the truth I want to share with you today:
If you catch yourself unable to celebrate others making money ,
If you feel angry when price pumps and you missed it,
If you’re wishing for collapse or chaos just so you feel seen...
Something’s off. That’s not trading. That’s pain talking.
Buying is more than just a trade — it’s hope , it’s optimism , it’s love .
Being bullish is an act of belief in the future.
And yes — we sometimes need to short. We do it with clarity.
But I’m a bull who sometimes must go short. Not a bear who wants the world to burn.
“We go long. We go short. But we never go blind.”
📉 Don’t let bitterness guide your charts.
📈 Let discipline, structure — and a bit of heart — guide you instead.
One Love,
The FXPROFESSOR 💙
⚠️ Disclosure:
Disclosure: I am happy to be part of the Trade Nation's Influencer program and receive a monthly fee for using their TradingView charts in my analysis. Awesome broker, where the trader really comes first! 🌟🤝📈

Evolving Price & Candle Patterns: BitcoinLook what is happening here with the candle patterns and price action. In the most recent challenge of resistance something changed. Change is good. It can mean the end of this sideways period.
At (1) Bitcoin finds resistance and immediately starts a decent. The same happens at (2). When we reach (3) everything changes. (1) & (2) produced a low and lower low. The down-move was extended. (3) produced only two red candles, a strong higher low and the third day was a full green candle moving above the descending trendline resistance. The price pattern is now erratic, completely different to previous moves.
Now, consider (4). If the strong green candle was intended as a bull-trap, then we would expect a down-move to follow right after the peak, just as it happened with (1) and (2). But nothing, after (4), Bitcoin has been sideways within the bullish zone.
This change is good, bullish.
A drop can develop anytime but the market already had two changes to produce a down-wave, (3) and (4). The fact that a down-move didn't materialize means that the market has something different in store for us, change. This change is good because when resistance is challenged, prices tend to drop when the market is moving within a range. No drop can signal the end of the range trading which in turn can translate into the start of the next bullish wave.
If this idea turns out to be true, Bitcoin will start growing within days. Growth should be strong because consolidation has been happening for months.
Namaste.

BTC Down then Bounce from 92kIt's going go to down, hit this 50% fib which is also some historical S/R level, then bounce from there.

BITCOIN - Price can go into correction after reaching new ATHHi guys, this is my overview for BTCUSD, feel free to check it and write your feedback in comments👊
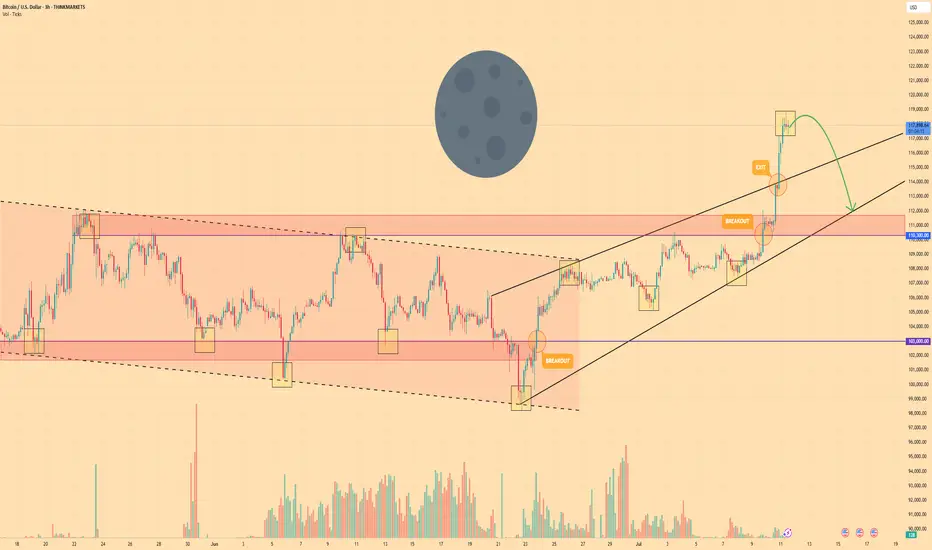
Bitcoin spent weeks confined to a tight falling channel, carving out a series of lower highs and lower lows as sellers maintained full control of the market.
The breakout above $110300 ignited a powerful rally, propelling BTC into an ascending wedge formation and driving price sharply higher toward a fresh all-time high at $118800.
Once the ATH was reached, selling pressure reasserted itself, halting further upside and triggering a loss of bullish momentum.
This lightning-fast climb to $118800 appears to have drained buyer enthusiasm.
Key support now resides around $110300 - $111700, backed by the wedge base.
Given the exhaustion of buyers and the clear wedge resistance, I anticipate BTC to retrace toward the $112000 area following its recent surge.
If this post is useful to you, you can support me with like/boost and advice in comments❤️
Disclaimer: As part of ThinkMarkets’ Influencer Program, I am sponsored to share and publish their charts in my analysis.
BTCUSD: BTC at ATH. Time to celebrate? Hmmmm.....7/11/2025Good day, Guys.
I'm back for a little update for Cryptos
Bitcoin
Last, June 19, 2022, I published an idea that Bitcoin may go below $ 16,000.00 and in the future go as high as $145,000.00. Fortunately, it happened as low as $ 15,479.00. I think right now, Bitcoin is heading to 0.786 Fib $ 145,517.00 as 1st target. It can extend the bull rally up to $ 267,735.00 upon successful break of resistance at $ 145,517.00. For now, there is least resistance and more support on Bitcoin. For me, $ 145,517.00 is the only major resistance to go higher. I think, upon reaching $ 145,517.00 many news outlets will make a positive news about Bitcoin and many institutions/celebrities will declare that they invest right now and recommends Bitcoin. Then, all of a sudden, it dumps at a very discounted price due to long term holders cashing out. As a result, many new comers will be shocked and stunned, and the experience traders may short or buy the dip.
Alts & Meme
In my observation, most of the alts and meme coins haven't recover yet and didn't reach the previous all-time-high while bitcoin for past years have already broken the previous ATH. Thus, many alt & meme coin traders is disappointed and losing hope. From what I see, alt & meme coins is extremely over sold and ranging like a kangaroo. I think with this favorable conditions for experience traders will analyze that charts and fundamentals on these coins. I think the liquidity in Bitcoin will transfer to alts & memes in the coming months.
Monthly Timeframe
In Elliot Wave, Bitcoin is right now heading to III - Primary but Wave 5. The Price will go higher and may top at $ 267,735.00
Full view of my Elliot Wave. Wave (III) may last up to year 2028. 1 Bitcoin will be worth millions of dollars. May Luck be with us.
In this timeframe, Bitcoin is very bullish on RSI but if it fails to break the RSI trendline Resistance the price of Bitcoin may decline significantly. If the successfully breaks the RSI trendline resistance, it's definitely to the moon.
Weekly Timeframe
There is confluence of resistance at Trendline & 0.786 Fib $ 145,517.00
May the force be with you all.

$160K BTC by AUG 11thI think we are in the 2nd to last leg up to top of Bull run. 5 waves to this one should put us at $160k, then a 3 wave down before the last 5 waves up for top by end of year. this could all be done in Aug or sept. Will have to check then to see what happens. But I call for $160k within 30 days. Bold I know. Lets go Moon shot. Top of bull run. $190k ? thoughts?

BTCUSD: Bitcoin Clears 109K, More Upside AheadAfter breaking out above its January 2025 peak at 109K, Bitcoin is showing a strong pattern that suggests there's more room to run — with the next key zone likely around 150K to 160K.

BTC BULLS IS IN CONTROL Bitcoin holds strong in its bullish sentiment, securing a fresh high at 111K.
With momentum on its side, a new projection toward 120K is now firmly in play — the bullish trajectory stays intact. 📈
Momentum traders, stay alert. This leg might just be getting started. follow for more insights , comment and boost idea .

Wyckoff Structure Targets 92K–94K Retest Before Continuation!A rare and highly instructive market structure is currently unfolding, presenting a textbook case of Wyckoff pattern integration across multiple timeframes.
Over the past weeks, I’ve been tracking a series of smaller Wyckoff accumulation and distribution patterns nested within a larger overarching Wyckoff structure. Each of these smaller formations has now successfully completed its expected move — validating the precision of supply/demand mechanics and the theory’s predictive strength.
With these mini-cycles resolved, the spotlight now shifts to the final, dominant Wyckoff structure — a larger accumulation phase that encompasses the full breadth of recent market activity. According to the logic of Phase C transitioning into Phase D, price appears poised to revisit the key retest zone between 92,000 and 94,000, a critical area of prior resistance turned demand.
📉 Current Market Behavior:
📐 Multiple minor Wyckoff patterns (accumulations/distributions) have played out as expected, both upward and downward — lending high credibility to the current macro setup.
🧩 All formations are nested within a major accumulation structure, now in the final phase of testing support.
🔁 The expected move is a pullback toward the 92K–94K zone, before the markup phase resumes with higher conviction.
📊 Wyckoff Confidence Factors:
✅ All Phase C spring and upthrust actions respected
✅ Volume behavior aligns with Wyckoff principles (climactic action → absorption → trend continuation)
✅ Clean reaccumulation signs within current structure
✅ Institutional footprint visible through shakeouts and well-defined support/resistance rotations
💬 Observation / Call to Action:
This setup is a rare opportunity to witness multi-layered Wyckoff theory in motion, offering not only a high-probability trading setup but also an educational blueprint. I invite fellow traders and Wyckoff analysts to share their interpretations or challenge the current thesis.
➡️ Do you see the same structural roadmap?
Let’s discuss in the comments.

(BITCOIN UPDATE) LONG BTC Taking that previous LTF high was broken this changes everything. Now if it can establish a HL this will confirm pushes higher for the near future.
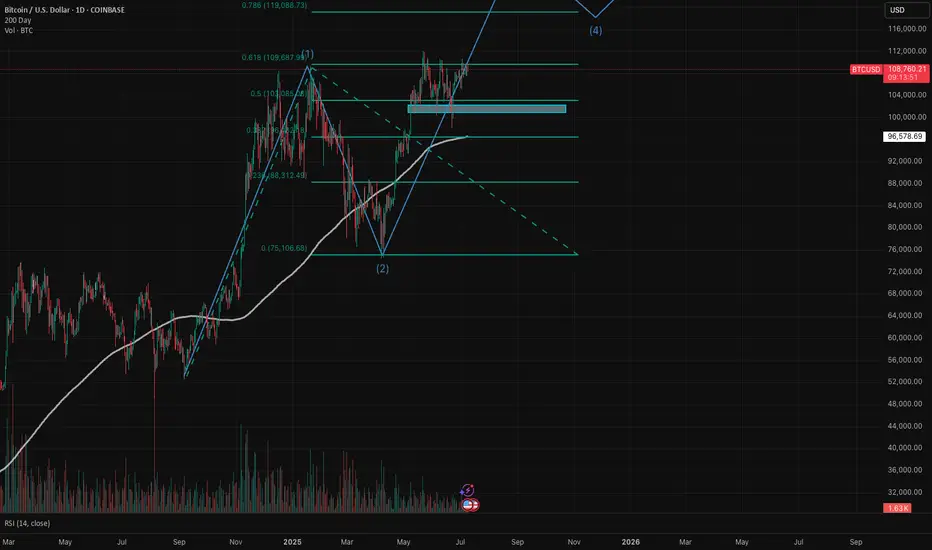
Bitcoin (BTC/USD) is currently in wave 3 of a 5 (Elliott Wave)BTC/USD experienced a halving last year on April 20, 2024. We have been seeing the typical post-halving cycle with exponential upside, followed by deep pullbacks. The price action we've seen to date follow Elliott Wave Cycle quite nicely. I believe we are in wave 3 of a bull cycle that has really been in place since Sep 2024.
- Wave 1: Sep 2024 - Jan 2025 - parabolic upside from $54K to $109K - absolutely explosive!
- Wave 2: Jan 2025 - Apr 2025 - we saw price peak and pull back all the way to the 61.8% Fibonacci level right around $75K. Remember, that in wave 2, a healthy pullback is 50% - 61.8% of the first wave.
- Wave 3: Apr 2025 - we have since rallied to around $109K as of this analysis. We are likely in subwave 3. Subwave 1 was from the low in April to the high in May (around $112K). Subwave 2 was a very nice 3-wave zig zag (reaching low of $98.3K in June). I believe we are currently in the middle of wave 3.
My next price target based on Fibonacci extension is $118K-$120K with the $78.6% level right at $119K. Note current resistance that we need to turn into support ($109.7K level) is the 61.8% Fibonacci extension level. I do expect a meaningful pullback after the peak of wave 3, which would be wave 4. The rest is TBD and I will continue to update this idea.
Remember, Elliott Wave theory is one tool in the toolbox. I do believe there is a larger post-halving cycle narrative that is dominant and most reliable, especially since BTC has largely followed this blueprint that we see every four years, but as of now EWT fits in quite nicely. I also look at the pi cycle top indicator and believe we need to use multiple indicators to understand where we are in the cycle.
BTC Inverse H&S aligning to 3.618 fib extensionWE'RE OFF BOYS
GL ALL
Don't forget to sell
Not financial advice