Bitcoin | BTCUSD | SELLSell Bitcoin.
Price reached supply level on 1H, we got confirmation of rejection from 15m.
Take Profit: 111,430
Stop Loss: 120600
BTCUSD.P trade ideas

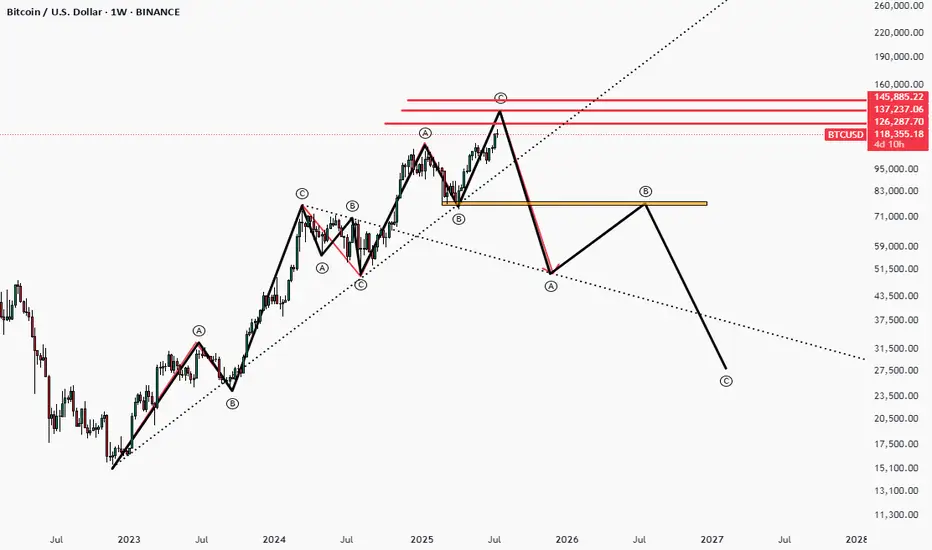
Bitcoin Wave AnalysisBase on Wave Analysis We see this Move For BitCoin
it seems bitcoin is near to finish the last bullish wave and will start for a big correction
SELL BTCUSD for bullish divergence trend reversal STOP LOSS: 120SELL BTCUSD for bullish divergence trend reversal STOP LOSS: 120,246
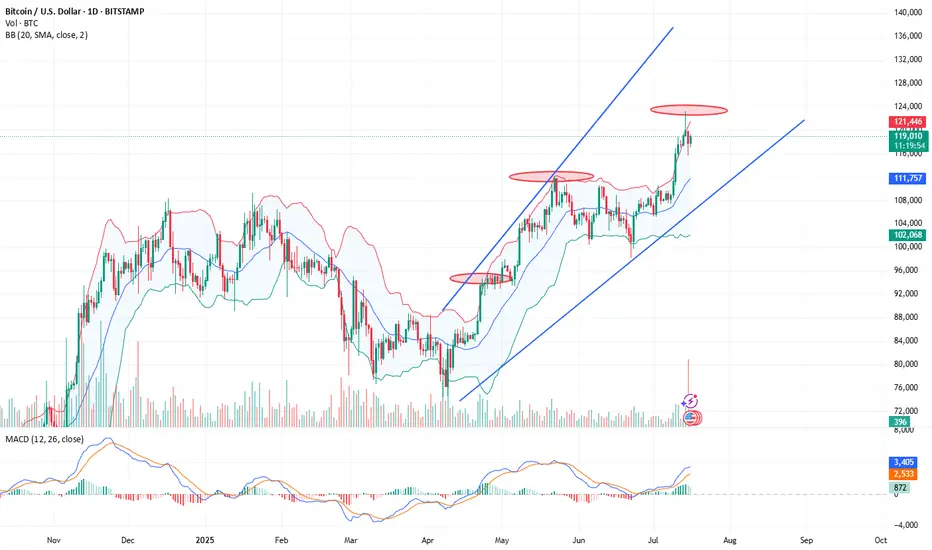
Regular Bearish Divergence
In case of Regular Bearish Divergence:
* The Indicator shows Lower Highs
* Actual Market Price shows Higher Highs
We can see a strong divergence on the MACD already and There is a strong trend reversal on the daily time frame chart.....
The daily time frame is showing strength of trend reversal from this level resistance so we are looking for the trend reversal and correction push from here .....
TAKE PROFIT: take profit will be when the trend comes to an end, feel from to send me a direct DM if you have any question about take profit or anything
Remember to risk only what you are comfortable with........trading with the trend, patient and good risk management is the key to success here...

BTC Possible Short-Term Scenario (Long)Sharing my view on the BTC short-term scenario.
Main idea here is to find confluence of the resistance levels using different technicals.

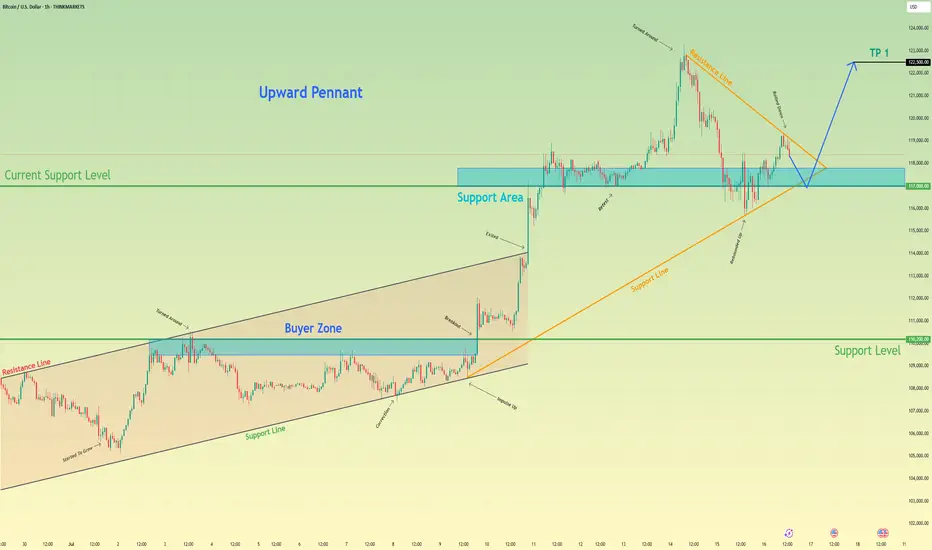
Bitcoin may exit of pennant and then rebound up of support areaHello traders, I want share with you my opinion about Bitcoin. Earlier, the price was moving inside an upward channel, respecting both the resistance and support boundaries. After reaching the buyer zone (110200–109500 points), BTC made a strong impulse up, breaking out of the channel and entering a new phase of growth. This breakout led to the formation of a bullish pennant, which often signals a continuation of the uptrend. Right now, the price is testing the support area between 117000 and 117800, which previously acted as a breakout zone and now serves as a current support level (117000). The structure shows that this level has already worked as a rebound zone multiple times. In my opinion, BTC may continue the correction toward this support area, potentially exiting the pennant to the downside for a short-term pull-back. After that, I expect a new upward movement, targeting the next local high. That’s why I set my TP at 122500 points, which is just below the recent ATH. Given the impulse move, strong support zone, breakout from the channel, and the bullish pennant pattern, I remain bullish and expect BTC to resume its upward trend soon. Please share this idea with your friends and click Boost 🚀
Disclaimer: As part of ThinkMarkets’ Influencer Program, I am sponsored to share and publish their charts in my analysis.
Bitcoin May Face Short-Term Pullback📊 Market Summary
– Bitcoin trades around $118,009, retreating from its intraday high of $118,330 .
– The recent rally was primarily fueled by $14.8 billion inflows into spot BTC ETFs, lifting BTC to an ATH of $123,000 on July 14
– Profit-taking has triggered a ~3% correction
– Market awaits key CPI/PPI inflation data and regulatory clarity in the US to guide next moves.
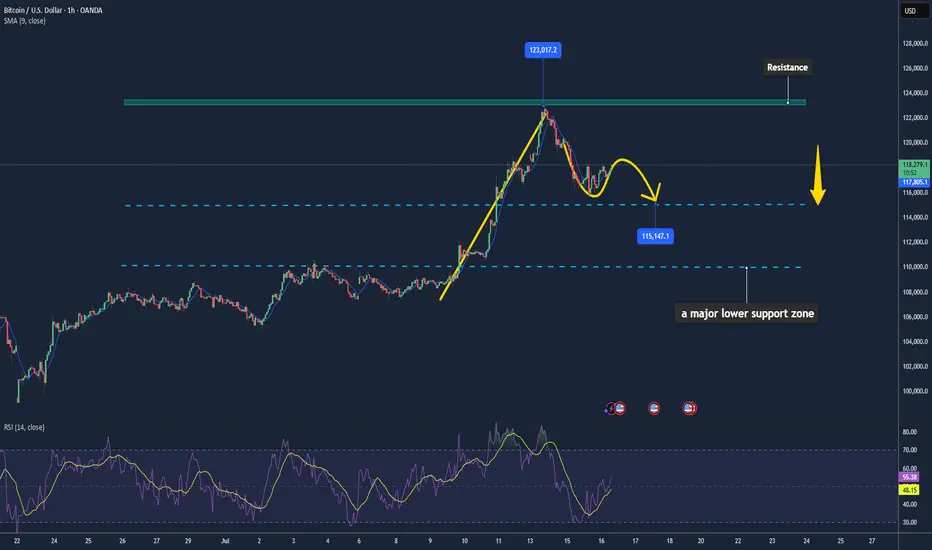
📉 Technical Analysis
• Resistance: $123,000 – $123,100 (all-time high zone, weekly candle top).
• Support: $114,000 – $115,000 (potential retest zone, IH&S neckline, CME gap)
• EMA 9: Price remains above all major EMAs (10/20/50/100/200 day) – bullish short-term trend
• Candles / Volume / Momentum:
• Confirmed inverted head and shoulders breakout above ~$113,000 neckline
• RSI ~74 suggests overbought; short term pullback possible
• MACD bullish but on chain volumes are cooling, reflecting profit taking
📌 Outlook
– Expect a short-term cooldown/pullback toward $114,000–$115,000 for support testing.
– If support holds and ETF inflows continue, BTC could resume rally toward $130,000–$140,000
💡 Trade Strategy
🟣 SELL BTC/USD upon break below $117,000–$118,000 during retrace
🎯 TP: $115,000
❌ SL: $118,500
🟢 BUY BTC/USD at support $114,000–$115,000
🎯 TP: $120,000 – $123,000
❌ SL: $113,000
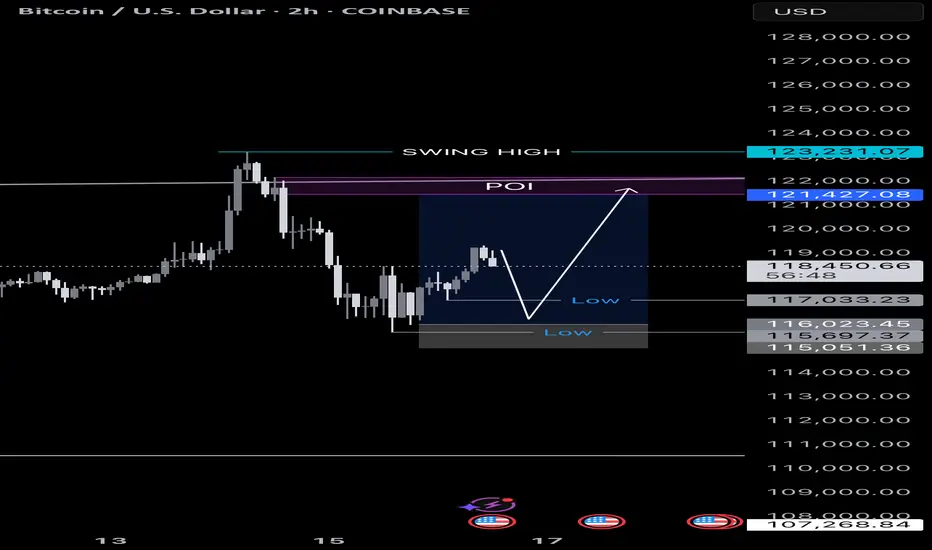
BTCUSD ShortBTCUSD 1H Technical Analysis
⚙️ Scenario Outlook:
Bias: Bearish
Preferred Play: Wait for price to enter the 119,000–120,000 supply zone. If price shows signs of exhaustion or bearish confirmation (e.g. bearish engulfing, strong rejection), a short position becomes favorable.
Targets: First target at 117,200; final target near 115,600–115,000 range, depending on how price behaves within the intermediate demand.
🔼 Supply Zone (Resistance):
Zone: 119,000–120,000
This red zone marks a previously unmitigated supply area aligned with the 50% Fibonacci retracement level from the prior bearish impulse. It's expected to act as the final resistance before the next move lower. A rejection from here would confirm bearish intent and offer optimal risk-to-reward for short setups.
🔽 Demand Zones (Support Targets):
First Demand Zone: 117,200–117,600
This green border is your first liquidity pocket to watch. It may offer a brief reaction or bounce, but if bearish momentum holds, price is likely to continue through it.
Deeper Demand Zone: 115,600–116,200
This is the stronger accumulation area, marked by your lower green zone. It sits just above the previous CHoCH and BOS lows, making it a prime liquidity sweep and reversal candidate if price moves deeply into it.

BTC Hits Predicted 1.618 Fibonacci Target at $122K — What’s Next🎯 BTC Hits Predicted 1.618 Fibonacci Target at $122K — What’s Next?
📅 Posted on: July 16, 2025
📍 Ticker: BTCUSD (BINANCE)
✍️ Author: @darwas121
⸻
🔹 Summary
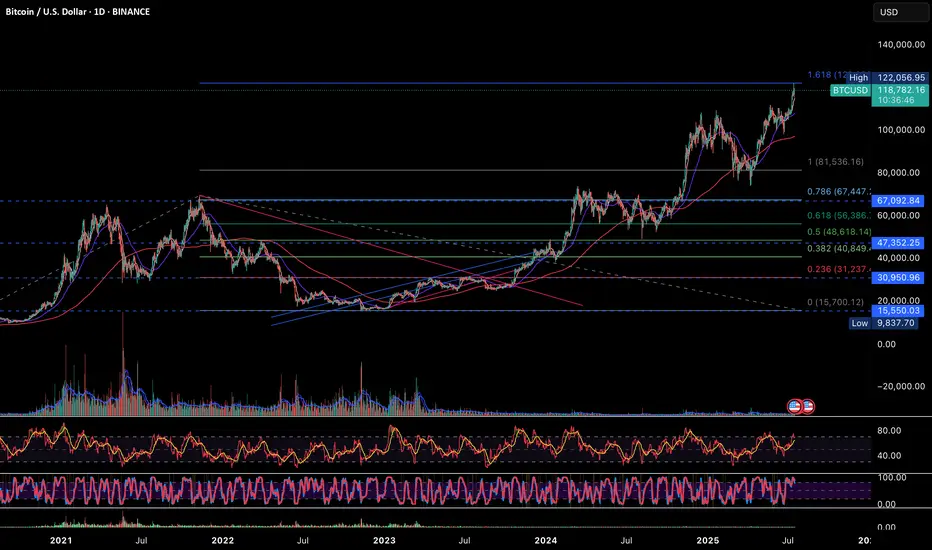
In October 2023, I shared a long-term bullish projection for Bitcoin (BTC/USD) targeting the 1.618 Fibonacci extension level — projected around $122,000. As of today, BTC has successfully hit this target, validating the Fibonacci-based wave structure and bull market thesis. Now the key question is — what’s next?
⸻
🧠 Prediction Recap (Oct 2023)
• ✅ Projected rally continuation based on wave structure + Fibonacci expansion
• ✅ Long-term target: $122,056 (1.618 Fib level)
• ✅ Based on swing low near $15,550 and prior ATH structure
• ✅ Conditions: Confirmed breakout above $81,500
⸻
🔍 Current Technical Analysis (1D Chart)
💰 Price Action
• Current Price: $118,701
• Recent High: $122,056 (exact 1.618 Fib hit)
• Structure: Parabolic breakout from previous consolidation range
🔺 Fibonacci Levels
Level Price (USD)
0.236 31,237
0.382 40,849
0.5 48,618
0.618 56,386
0.786 67,092
1.0 (ATH Zone) 81,536
1.618 ✅ 122,056 (Hit)
📉 RSI & Momentum
• RSI is hovering in the overbought zone (>70), signaling potential cooling-off
• Stochastic RSI also indicates overextension — a pause or retracement could follow
• No bearish divergence yet, but watch closely
📊 Volume Trends
• Volume has tapered during this leg up — possible early sign of buyer exhaustion
• Previous volume clusters between $56k–$67k now act as strong support
⸻
⚠️ What to Watch Next
Risk Factors Notes
Overbought RSI Suggests short-term pullback risk
Weakening Volume Caution: Less conviction in highs
Parabolic Structure Vulnerability Break could mean fast correction
⸻
🧭 My View & Strategy
🔹 Short-Term: ⚠️ Cautious
• Book partial profits if holding from lower levels
• Watch for reversal candles near $122k zone
• RSI divergence or low-volume rally = yellow flag
🔹 Mid-Term: 🔼 Bullish
• Buy-the-dip zones: $67k (0.786) and $56k (0.618)
• Any correction into these zones may offer re-entry
🔹 Long-Term: 🔼 Strong Bullish
• BTC is in confirmed macro uptrend
• Sustained close above $122k opens price discovery zone
• Next logical Fib projection zones: $135k–$150k
⸻
📌 Key Levels
• Support: $81,536 / $67,092 / $56,386
• Resistance: $122,056 → Break = price discovery
• Invalidation Zone: Breakdown below $81,000 on volume
⸻
📣 Conclusion
The technical roadmap laid out in 2023 has now played out — Bitcoin has achieved its 1.618 Fibonacci extension target. We are now at a critical inflection point. If BTC consolidates well here and maintains volume, the next leg could launch us into new all-time highs beyond $135,000.
🛑 But caution is warranted — overbought signals + weak volume could bring a healthy correction first. Stick to your risk plan. Let the market come to you.
⸻
💬 Feel free to share your views or ask for updates in the comments.
🔔 Follow me for more swing-to-position analysis using volume, fibs & structure.
📊 Chart shared below for reference.
#Bitcoin #BTCUSD #Crypto #TechnicalAnalysis #Fibonacci #PriceTargets #CryptoForecast #ParabolicMove #BTC
KOG BTC 4H chart updates.
KOG BTC 4H CHART
🔹 Sell Zone: 122,869
🔸 Resistance Holding Strong!
🔻 Price Rejected from 118,955 Minor Support
• Watch for pullback toward 116,237 Support Zone
• Possible BOS retest before next move
• If breaks → watch for continuation to 115,000
• If holds → bullish bounce possible
• Volume spike confirms reaction level.

Bitcoin short term moveBTCUSDT
We have swept highs and also swept lows.
Now price is in a minor uptrend.
We can pump from here immediately
Or
Retest 0.718 fib then pump.
Bitcoin $120,000.00 Bitcoin will soon reach the target of $120,000.00, see in the analysis that I had announced today's price in the price range of 20,000.00 a few years ago.
Sasha Charkhchian

Whales Impact on BTC and XRP MarketsKey Points:
Whales drive market dynamics, focusing on BTC, ETH, XRP.
Whales influence price movements and trader behavior.
Institutional inflows increase, spotlighting large-cap assets.
Whale activities have drawn attention due to their potential to alter market dynamics, indicating possible price shifts and investment strategies for traders.
Recent Influences of Whale Activity on Cryptocurrency Markets
Recent whale activity has driven interest in Bitcoin and XRP, as whales accumulate assets, influencing market trends. Abdullah “Abs” Nassif emphasized the strategic importance of holding, advising caution.
"If you hold it and play the game like we do, you have a chance at freeing people around the world from the debt slavery system. I can promise you that." - Abdullah “Abs” Nassif, Host, Good Morning Crypto
Financial markets are adapting, with noticeable movements in cryptocurrency prices due to whales' actions. Their accumulation signals rising confidence, especially in Bitcoin, which hit a new all-time high.
BTC's surge influenced the broader market, encouraging capital flow into large-cap assets. These movements reflect potential shifts in trader strategies, highlighting the impact of significant investments.
Insiders suggest regulatory developments may affect prices, yet whale activity implies potential long-term growth. Historical patterns highlight institutional investors' stability during volatile periods, underscoring the strategic value of holding as exhibited by these whales.
Plan on bracing yourself for Monday most likely. That's when we'll really see the test as to whether crypto can maintain the momentum. OKX:BTCUSD BITFINEX:BTCUSD BITFINEX:BTCUSD OANDA:BTCUSD
10 Types of Cryptocurrencies: Explanations and ExamplesCryptocurrencies go far beyond Bitcoin. Today’s digital asset market includes a wide variety of coins and tokens, each serving distinct purposes. Below are 10 key categories of cryptocurrencies with brief explanations and examples:
Store of Value Cryptocurrencies:
Used as a digital form of gold or a long-term value reserve.
▶ Example: Bitcoin (BTC)
Smart Contract Platforms:
Support decentralized applications and programmable transactions.
▶ Example: Ethereum (ETH)
Stablecoins:
Pegged to fiat currencies to reduce volatility.
▶ Examples: USDT, USDC
Payment Tokens:
Designed for fast, low-cost money transfers.
▶ Examples: XRP, Stellar (XLM)
Governance Tokens:
Allow holders to vote on protocol decisions.
▶ Examples: UNI, MKR
Meme Coins:
Inspired by internet culture and social trends.
▶ Examples: Dogecoin (DOGE), Shiba Inu (SHIB)
Gaming Tokens:
Used in blockchain-based games and metaverses.
▶ Examples: AXS, SAND
Privacy Coins:
Focused on anonymous, untraceable transactions.
▶ Examples: Monero (XMR), Zcash (ZEC)
NFT Tokens:
Represent digital collectibles or assets on-chain.
▶ Examples: Bored Ape, CryptoPunks (ERC-721)
Infrastructure Tokens:
Power scalability, cross-chain solutions, or protocols.
▶ Examples: Polkadot (DOT), Cosmos (ATOM)
Understanding these categories helps investors and users navigate the complex crypto ecosystem more effectively.

Do you think I'm joking ???As I said, Bitcoin broke the triangle, and now with a slight price correction, it could surge to $160,000, and you still think I'm joking!!
Previous analysis
Best regards CobraVanguard.💚

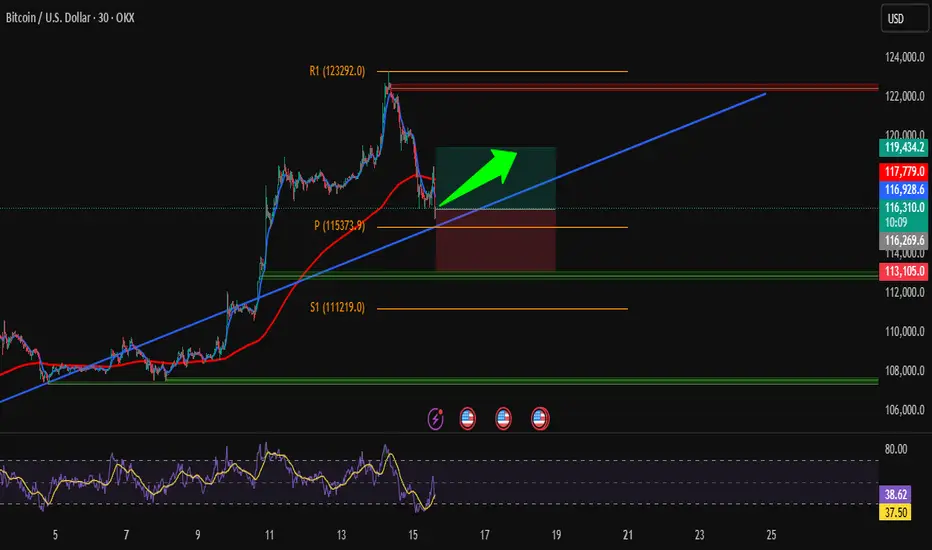
Clean BTC Trade – Bounce from Key Trendline SupportHi traders! , Analyzing BTC/USD on the 30-minute timeframe, we can observe that price is respecting the ascending channel and reacting to the dynamic trendline support (blue line). This bounce, aligned with prior structure, signals a potential bullish continuation.
🔹 Entry: 116,249
🔹 Take Profit (TP): 119,434
🔹 Stop Loss (SL): 113,105
Price remains above the 200 EMA while continuing to respect the ascending trendline, signaling sustained bullish structure. The RSI is showing a bullish divergence, which supports the idea of upward momentum. We also saw a strong reaction at the pivot point (115,373), and a bullish engulfing candle formed right near the trendline — adding further confirmation to this potential long setup.
This long setup presents a favorable risk/reward ratio within the context of the broader trend. Targeting a clean break above previous resistance and return to the R1 zone.
⚠️ DISCLAIMER: This is not financial advice. Trade at your own risk and always use proper risk management
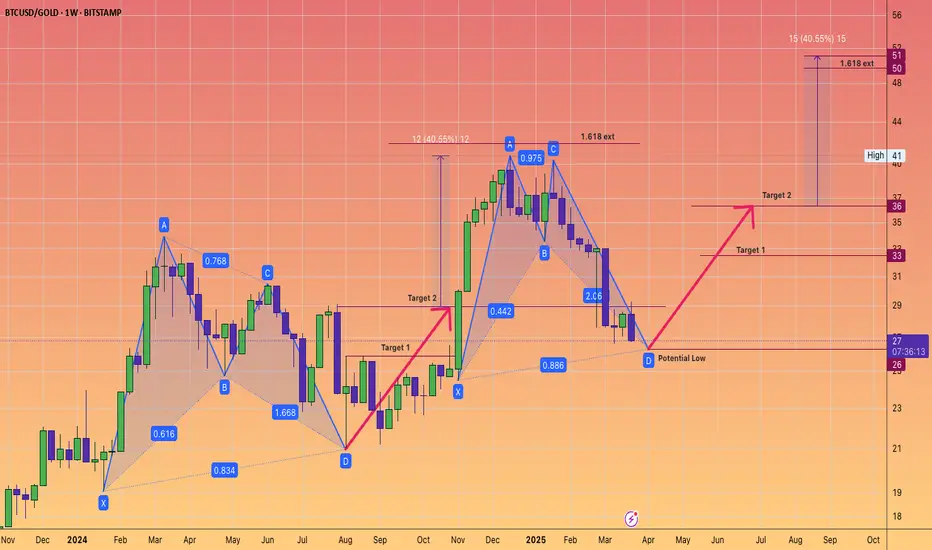
Bitcoin harmonic pattern. Back to back Gartley. BTCGOLD ratio.The BTC/GOLD ratio has experienced a significant correction, currently standing at 27 gold ounces per 1 Bitcoin, down from a peak of 41, representing a decline of 34%.
Gold, priced at $3,114 in US Federal Reserve notes, is in a sustained bull market.
It is reasonable to anticipate that the digital equivalent of gold will gain traction once gold stabilizes at a higher price point.
The Gartley pattern is recognized as the most prevalent harmonic chart pattern.
Harmonic patterns are based on the idea that Fibonacci sequences can be utilized to create geometric formations, which include price breakouts and retracements.
The Gartley pattern illustrated indicates an upward movement from point X to point A, followed by a price reversal at point A. According to Fibonacci ratios, the retracement from point X to point B is expected to be 61.8%.
At point B, the price reverses again towards point C, which should reflect a retracement of either 38.2% or 88.6% from point A.
From point C, the price then reverses to point D. At point D, the pattern is considered complete, generating buy signals with an upside target that aligns with points C and A, as well as a final price target of a 161.8% increase from point A.
Often, point 0 serves as a stop-loss level for the entire trade. While these Fibonacci levels do not have to be precise, greater proximity enhances the reliability of the pattern.
Will these consecutive Gartley patterns succeed in bolstering Bitcoin's strength? We will soon discover the answer.
Global Market Overview | July 15President Trump’s latest statements made headlines again, but market reactions have become more measured. The Dow declined slightly, while Asian markets presented mixed performances; Japan remained flat, Korea and Australia posted losses, and Taiwan outperformed. The US dollar strengthened as the yen weakened. Bitcoin recovered near $118,000 after dropping from its $123,000 high. Silver held firm above $38.
Today, market focus turns to U.S. PPI data and key bank earnings reports.
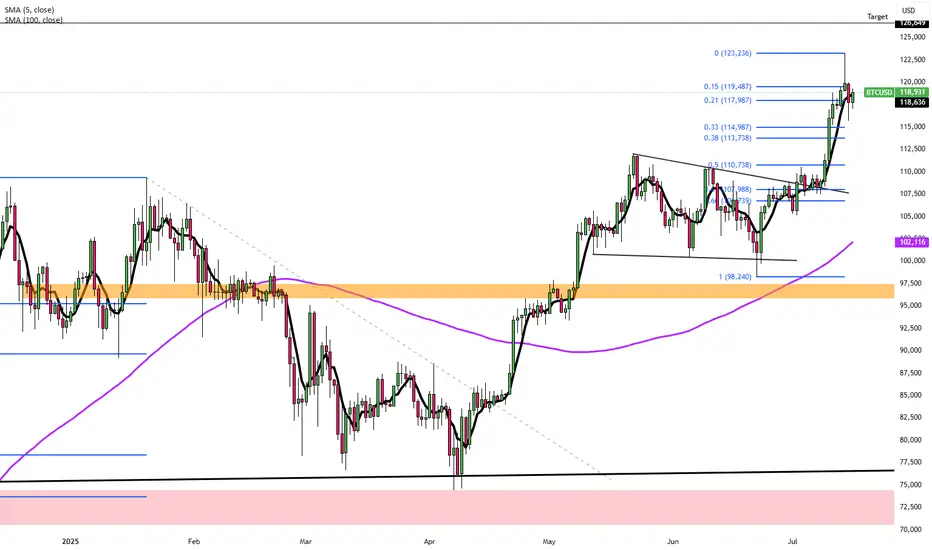
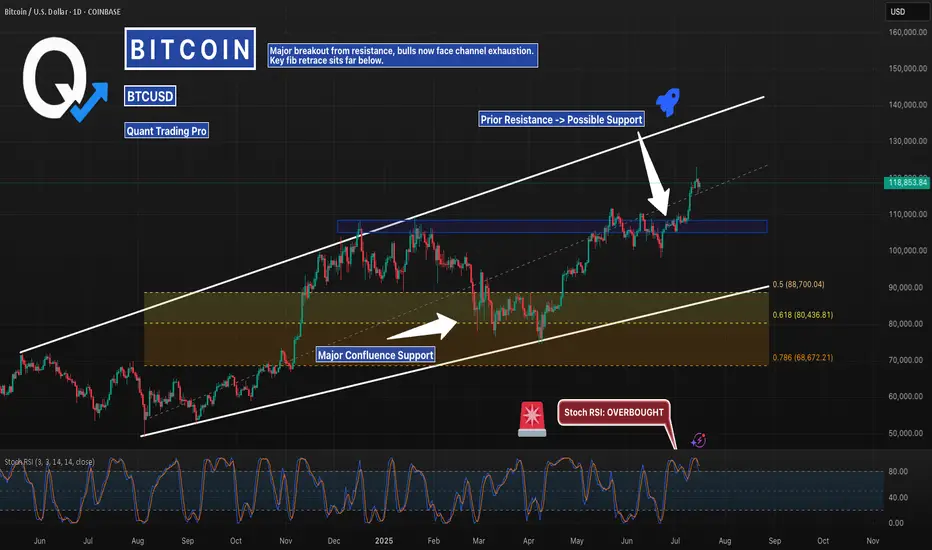
BTCUSD - Breakout Or Bull Trap? Watching the Fib Reload ZoneBitcoin just cleared the prior resistance zone near 114K–115K, breaking higher within the macro ascending channel. But with Stoch RSI overheated and price stretching toward the upper trendline, this move may exhaust soon.
I’m watching the Fib confluence zone between 88K–80K — which aligns with the mid-channel and prior breakout structure. If bulls lose steam, that’s where the real bid could return.
Set alerts. Let the algo hunters chase.
This is where smart traders prepare.
#BTCUSD #Bitcoin #Crypto #PriceAction #Fibonacci #SmartMoney #Backtesting #QuantTradingPro #TradingView
[UPD] BTC / ETH / XRP / SOL / HYPE and other alt and mem-coins A new video update with insights on the intermediate trend structure with key support and resistance zones to keep on radar in the coming sessions
Coins discussed in the video: CRYPTOCAP:BTC / CRYPTOCAP:ETH / CRYPTOCAP:XRP / GETTEX:HYPE / CRYPTOCAP:SOL / CRYPTOCAP:LINK / CRYPTOCAP:SUI / $BRETT / SEED_DONKEYDAN_MARKET_CAP:FLOKI and others
Hope this is helpful in guiding you through the crypto market. Thank you for your attention and I wish you successful trading decisions!
If you’d like to hear my take on any other coin you’re tracking - feel free to ask in the comments (just don’t forget to boost the idea first 😉).

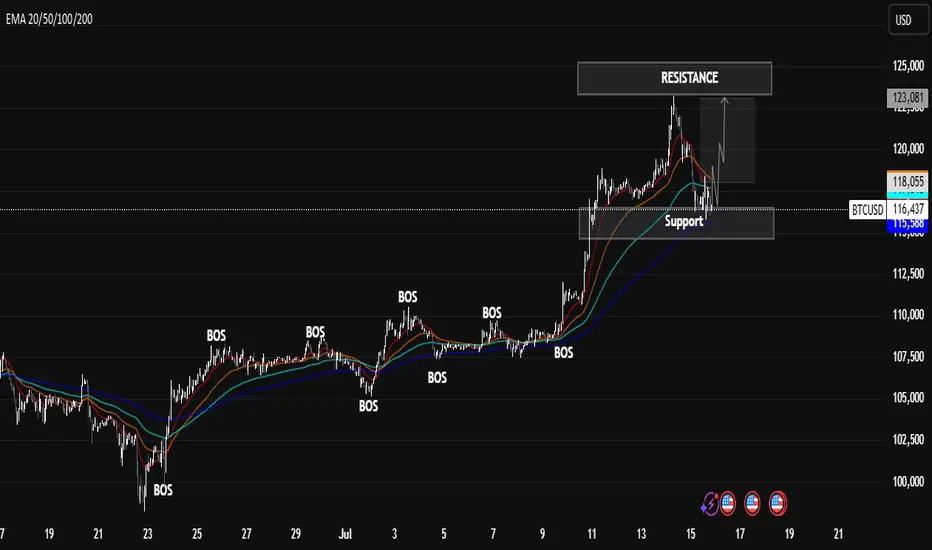
BTCUSD Technical Analysis – Break of Structure + SupportBTCUSD Technical Analysis – Break of Structure + Support/Resistance Strategy
🔍 Market Structure Insight
The chart clearly shows multiple Breaks of Structure (BOS) throughout the uptrend, indicating strong bullish momentum. Each BOS confirms a higher high formation and continued market strength.
📌 Key Zones
Resistance Zone: Price recently tested this level and faced rejection, indicating potential short-term selling pressure.
Support Zone: Price is currently retesting this level after a correction, showing signs of a possible bounce. It aligns well with the EMA support cluster (20–200 EMAs).
🔄 Current Price Action
After a significant impulse move to the upside, BTC is now in a corrective phase. However, the support zone is holding, and there's potential for a new bullish wave if price sustains above $115,000.
📈 Bullish Scenario
Price holds above support
EMA cluster continues to act as dynamic support
Break above $118,000 resistance could trigger the next rally toward $122,000+
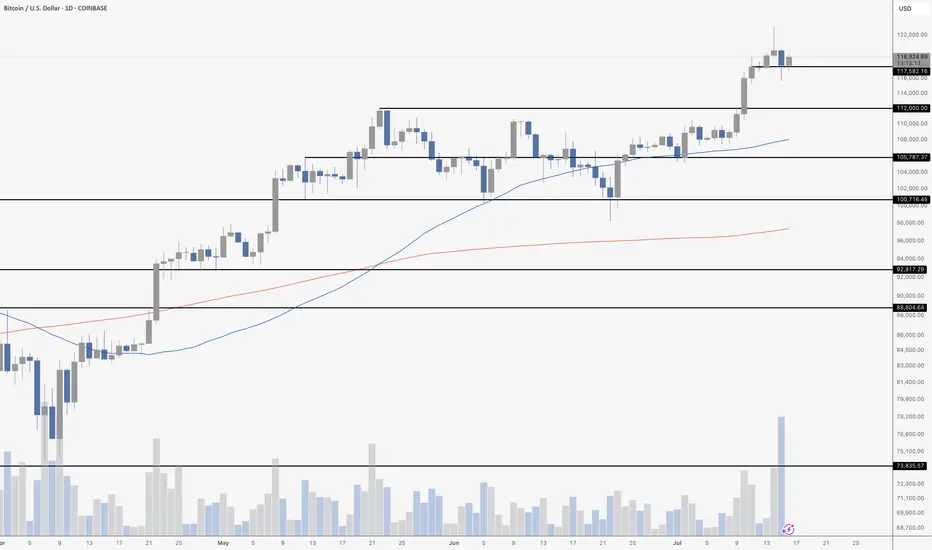
Bitcoin Dips On High VolumeThe Bitcoin daily chart paints a nuanced picture following Tuesday’s pullback – which came on the highest volume day since the $74K bottom in mid‑April, specifically on Coinbase. But notably, that surge in volume was primarily driven by selling, not buying – a key detail that shifts the tone of the candle.
Despite the aggressive downward move, price found support around $116,000 and recovered into the close, finishing the day above $117,000. However, the heavy sell volume behind that move suggests it wasn’t just a casual dip – it was real distribution.
That said, bulls showed resilience on Wednesday, pushing price back toward $119,000 and defending the key $116,000–$118,000 zone. If Bitcoin can maintain this level and digest the selloff without rolling over, it may absorb the supply and build a base for continuation.
But traders should stay cautious – high‑volume sell days near local highs can sometimes mark short‑term tops or signal a shift in momentum. The $112,000 breakout zone remains the critical downside level to watch if the current range fails.
BITCOIN Should we still trust the Stock to Flow model??It sure worked perfectly during Bitcoin's (BTCUSD) first Cycles, but the Stock-to-Flow model has greatly diverged from the current price action since March 2024.
Right now the model sits at around $750000, which is vastly above the current market price of $119000. It's been trading sideways actually since June 2024 and all of the times that it was ranging, Bitcoin eventually caught up and closed the gap.
It has always been a 'story' of divergence and convergence but it sure seems unrealistic to catch up this time, especially during if this Cycle continues to follow the 4-year model.
So what do you think? Should we still trust what seems more and more like an 'obsolete' model as mass adoption kicks in? Feel free to let us know in the comments section below!
-------------------------------------------------------------------------------
** Please LIKE 👍, FOLLOW ✅, SHARE 🙌 and COMMENT ✍ if you enjoy this idea! Also share your ideas and charts in the comments section below! This is best way to keep it relevant, support us, keep the content here free and allow the idea to reach as many people as possible. **
-------------------------------------------------------------------------------
💸💸💸💸💸💸
👇 👇 👇 👇 👇 👇

BITCOIN Will Go Higher! Long!
Here is our detailed technical review for BITCOIN.
Time Frame: 9h
Current Trend: Bullish
Sentiment: Oversold (based on 7-period RSI)
Forecast: Bullish
The market is trading around a solid horizontal structure 119,063.08.
The above observations make me that the market will inevitably achieve 126,088.10 level.
P.S
Overbought describes a period of time where there has been a significant and consistent upward move in price over a period of time without much pullback.
Disclosure: I am part of Trade Nation's Influencer program and receive a monthly fee for using their TradingView charts in my analysis.
Like and subscribe and comment my ideas if you enjoy them!
