SELL BTCUSD NOW🚨 TRADE ALERT:
SELL BTCUSD NOW 💥📉
🔻 Market showing bearish signs.
🎯 Set your TP (Take Profit) levels wisely.
🛡️ Use SL (Stop Loss) to manage risk.
📊 Confirm with your strategy before entry.
BTCUSD.P trade ideas

BTC/USD: Bitcoin Holds Above Key Support — Target at 113,388Market Overview:
Bitcoin is trading near 111,250 after breaking out of a descending structure and forming a bullish channel. The price has firmly established itself above the daily level of 110,600, signaling continued bullish momentum. The market is now aiming toward the channel’s upper boundary.
Technical Signals & Formations:
— Completed ABCD pattern
— EMA supports the bullish bias
— 110,600 now acts as key support
— Upside potential toward 113,388
Key Levels:
Support: 110,600, 109,115
Resistance: 112,000, 113,388
Scenario:
Primary: As long as BTC holds above 110,600, a move toward 112,000 and 113,388 remains likely.
Alternative: A drop below 110,600 may trigger a pullback toward 109,115.

BITCOIN Epic Breakout! Buy!
Hello,Traders!
BITCOIN is trading in an
Uptrend and the coin made
An epic bullish breakout
Of an ATH level of 112k$
Which reinforces our bullish
Bias and we will be expecting
A further bullish move up
Buy!
Comment and subscribe to help us grow!
Check out other forecasts below too!
Disclosure: I am part of Trade Nation's Influencer program and receive a monthly fee for using their TradingView charts in my analysis.

BTC Breakout Alert: Ready for the Next Bullish Wave The BTC/USD 4-hour chart shows a clear breakout above a descending trendline that has acted as resistance since mid-May. After multiple rejections, the price has now broken above the structure, signaling bullish momentum. The Ichimoku cloud confirms support underneath, providing confluence for a potential rally. The bullish breakout is also accompanied by increasing volume and a bullish engulfing pattern near the breakout zone, which adds confirmation. Price is currently consolidating just above the breakout area, suggesting a retest may be forming before further upside continuation. If momentum sustains, higher levels could soon be tested in the coming sessions.
Entry: 109,400
1st Target: 110,000
2nd Target: 111,870

BTC Summer Roadmap: Key Levels & Breakout ScenariosBTC has retested the weekly resistance trendline (around $114K) that has been in place since February 2021. Over the past 4 years, this trendline has been tested four times, and a fifth retest appears imminent in the short term.
Historically, a fifth retest often leads to a breakout. If that breakout occurs, the next major target for BTC is around $128,000.
That said, the market rarely moves in a straight line.
As outlined in the chart, I’ve considered three potential scenarios for BTC to unfold this summer.
New trades will be based on these movements, with optimal entries either at the yellow-highlighted zones or upon a confirmed breakout above the current weekly resistance.
Disclaimer:
This analysis is based on my personnal views and is not a financial advice. Risk is under your control.
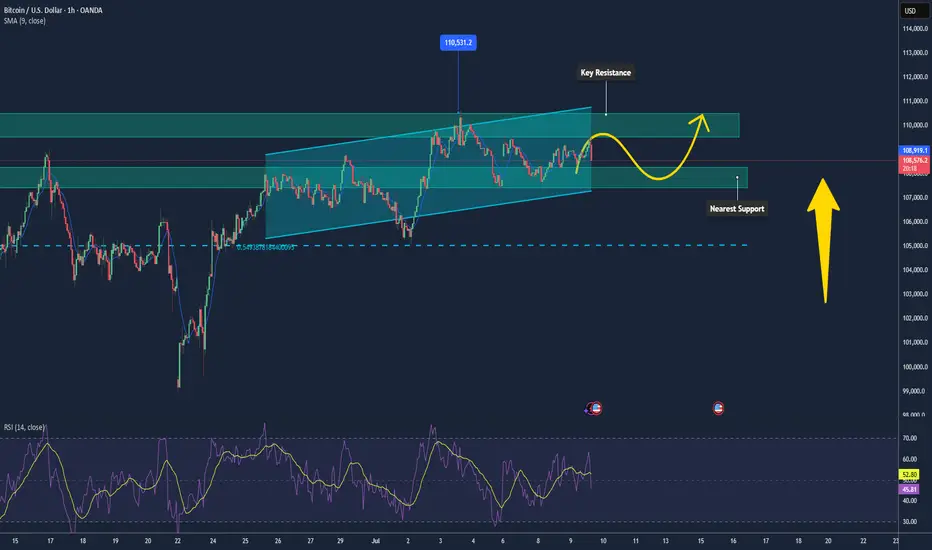
Bitcoin Maintaining Mild Uptrend, Poised Toward $110k📊 Market Overview:
• Strong ETF inflows continue, with over $13.5 billion in YTD flows into BTC, now making up nearly 70% of gold ETF inflows.
• Institutional investors like BlackRock (IBIT currently holds ~700k BTC) are still accumulating. The U.S. is also building a “Strategic Bitcoin Reserve,” reinforcing long-term confidence.
📉 Technical Analysis:
• Key Resistance: $109,000–$110,000, opening the path toward $110,500–$110,600 (Supertrend around $110,174).
• Nearest Support: $108,300 (EMA), followed by $107,800–$108,000; deeper pullback support at $105,000.
• EMA 09: Price is above this EMA → short-term trend remains bullish.
• Candlestick/Volume/Momentum: RSI is neutral around 58; MACD is converging near the zero line, signaling weakening bearish momentum and possible base formation.
📌 Outlook:
Bitcoin may continue its mild upward movement if it holds above $108,300–$108,000 and breaks clearly above $109k–110k with strong volume. Failure to do so could trigger a pullback toward $107,000–$108,000.
💡 Suggested Trading Strategy:
📉 SELL BTC/USD at: 109,500–110,000
🎯 TP: 108,000
❌ SL: 110,400
📈 BUY BTC/USD at: 108,200–108,500
🎯 TP: 109,500–110,000
❌ SL: 107,800
Bitcoin can rebound up from support line of upward wedgeHello traders, I want share with you my opinion about Bitcoin. In this chart, we can see how the price dropped from the 102800 support level, which coincided with the buyer zone, and later entered to wedge upward. In this pattern, price made an impulse up from the support line of the wedge pattern and broke the 102800 support level, after making a retest, and continued to move up. Bitcoin rose to the current support level, which coincided with a support area and even entered this area, but soon turned around and fell below. Next, price rose to this area again and then made a correction movement, after which it turned around and made an impulse up to the resistance line of the wedge, breaking the 108000 level. After this movement, the price bounced from this line and fell back to the current support level, where it some time traded in the support area. Later price rebounded and continued to move up. Now, I expect that BTC can correct to support line of the wedge and then rise to the resistance line of this pattern. That's why I set my TP at the 112600 points, which coincided with this line. Please share this idea with your friends and click Boost 🚀
Disclaimer: As part of ThinkMarkets’ Influencer Program, I am sponsored to share and publish their charts in my analysis.

BITCOIN TO BREAK DOWN SHARP on any new highThe chart of Bitcoin I DO NOT SEE 140 I see under 98 k soon into late july cycle I have NOT CHANGED THE LABEL in my EW work .best of trades WAVETIMER

HelenP. I Bitcoin can continue to fall and break support levelHi folks today I'm prepared for you Bitcoin analytics. If we look at the chart, we can see that Bitcoin has been trading inside a well-defined upward channel. The price recently touched the upper boundary of this channel for the second time and formed a clear reaction, indicating strong resistance. After this, BTCUSD started to pull back from the resistance zone around 110300 - 109800 points. At the moment, it is trading slightly above this support area, but momentum is already shifting downward. Given this structure, I believe Bitcoin is likely to continue its decline and break below the support zone. The previous upward impulse has already lost steam, and there are no signs of strong buying activity around the current levels. The next logical target in this scenario is the lower boundary of the channel, near the 107500 level, where the trend line acts as dynamic support. This level has historically served as a rebound point, and I expect it to do so again. My current idea is short, aiming for a move down toward the trend line. If BTCUSD breaks through the first support and confirms the weakness, the price could fall quickly and test the next support area around 105600 - 105000 points. But for now, I will be watching the 107500 level closely. If you like my analytics you may support me with your like/comment ❤️
Disclaimer: As part of ThinkMarkets’ Influencer Program, I am sponsored to share and publish their charts in my analysis.

BTC Just Hit the Brakes – Is the Pump Over?Bitcoin just tagged the upper Bollinger Band on the 1H chart while Stoch RSI maxed out and crossed down — a classic signal of volatility exhaustion combined with a momentum slowdown.
Technical Breakdown:
Bollinger Band Top: Price tapped the upper band, often a sign of near-term overextension
Overbought Stoch RSI (July 9th): RSI hit 97+ and flipped — momentum may be shifting
Cooling Phase? Price is stalling inside a tight range with low follow-through
arget Zone: $109K or BB midline as a possible mean reversion area
This is a high-probability zone for a pullback setup or a more attractive long opportunity if momentum resets.

111-112 Resistance LevelOnce BTC breaks above the 111-112 resistance level and flips it into support we should see price run to 125+ rather quickly. If history echoes, price discovery could easily touch 150, if not 175-200. Also, we should see BTC entering the "euphoric" phase of the cycle around the week of Aug 18th. Fun days are ahead :) remain vigilent!

BITCOIN - SELL TO $86,000 (8H UPDATE)Bitcoin spiked up last night, but just about missed our 'Invalidation Zone' of $112,140 by a few pips. As long as this level can hold & sellers move back down, this sell analysis is still valid.
A lot of whipsaw price action in the markets right now, so use stick risk management.

BTC Analysis TO 112,981 LEVELS AND BEYOND ? Good morning folks
BTC analysis with a little correction down to 110,300- 109,300 levels then a drive up to 112-113K levels
Let me know what you think
Kris/Mindbloome Exchange
Trade Smarter Live Better
Bitcoin at Triple Resistance – Will the Third Time Break It?BTC/USD is pressing against a key resistance zone near $112,500 for the third time in recent months.
This time, the breakout attempt is backed by a clear ascending trendline, showing sustained bullish pressure from the lows.
Highlights:
Triple top formation? Or ascending triangle breakout?
$112.5K has rejected BTC twice already
Higher lows = buyers stepping in more aggressively
Watch for volume surge and daily close confirmation
Break above = $118K–$120K likely in play.
Reject = revisit of trendline support near $106K.

BTCUSDT - single supporting area, short below .#BTCUSDT.... now we have single and immediate supporting area, that is around 110700-800
keep close and only it can stay above for further buying scenarios otherwise not.
so stay sharp and only short below that.
good luck
trade wisely
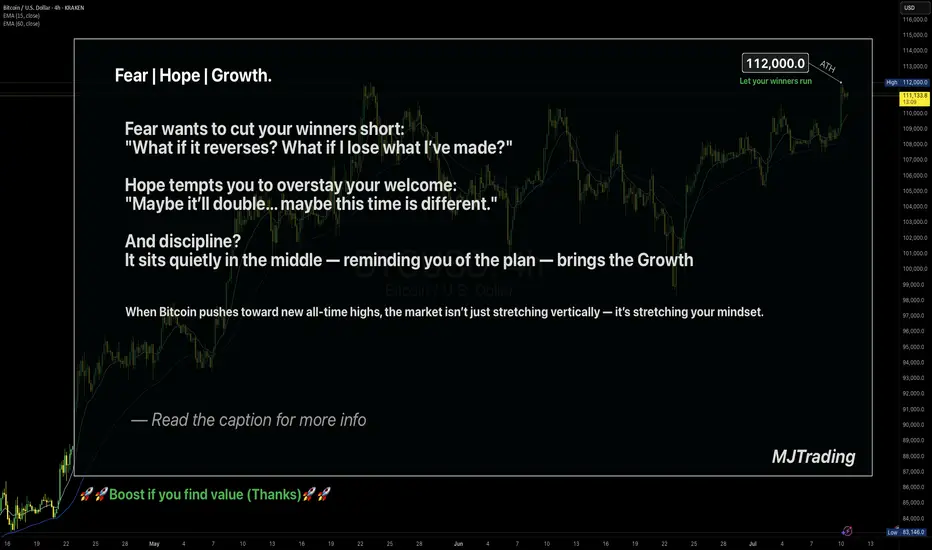
Let your winners run🧠 Fear | Hope | Growth – When Trading Meets Emotion
The message on the chart isn't just poetic — it's real psychology.
🔹 Fear wants to cut your winners short.
It sneaks in after a small move in your favor.
"What if it reverses? I better lock this in."
And just like that, a great trade turns into a missed opportunity.
🔹 Hope drags you into holding too long.
It dreams: "Maybe it doubles... maybe this time it'll be massive."
But it's not guided by data — it's driven by fantasy.
🔹 Discipline is what sits in the middle.
Quiet. Neutral.
It doesn’t scream or seduce — it just follows the plan.
And that’s where Growth lives — not just on the PnL, but in your psychology.
When Bitcoin pushes toward new ATHs, these emotions get amplified.
The real question becomes: Can you manage yourself, not just your trade?
📌 A Real Example from My Desk
In my earlier BTCUSD idea — “Another Edge – Decision Time” (shared above) —
I sent that setup to one of my managed clients.
He entered long exactly at the edge of the channel — a clean, strategic buy.
Price moved beautifully in our favor…
But he manually closed the trade at 106,600 — long before the move matured.
Why?
Because fear of giving back profit overwhelmed the original plan.
The chart was right. The timing was right.
But the exit was emotional, not tactical.
✅ The trade made money.
❌ But the lesson is clear: a profitable trade doesn’t always mean a disciplined one.
🎯 Final Takeaway:
“Fear kills your winners. Hope kills your timing. Discipline grows your equity and your character.”
🗣 What would you have done in that position?
Held longer? Closed at resistance? Let it run toward ATH?
Let’s talk psychology — drop your thoughts 👇
#MJTrading
#TradingPsychology #BTCUSD #FearHopeDiscipline #LetYourWinnersRun #PriceAction #BTCATH #ForexMindset #CryptoStrategy
BITCOIN BEARS WILL DOMINATE THE MARKET|SHORT
BITCOIN SIGNAL
Trade Direction: short
Entry Level: 111,047.38
Target Level: 109,294.85
Stop Loss: 112,211.89
RISK PROFILE
Risk level: medium
Suggested risk: 1%
Timeframe: 2h
Disclosure: I am part of Trade Nation's Influencer program and receive a monthly fee for using their TradingView charts in my analysis.
✅LIKE AND COMMENT MY IDEAS✅

Bitcoin Makes New All Time High - BrieflyBitcoin briefly made a new all-time high yesterday, tagging $112,000 before pulling back slightly. The breakout came after a multi-week consolidation that formed higher lows and built pressure just below resistance. Price is now hovering just under that key $112K level, which has become the short-term line in the sand for bulls. A daily close above would confirm the breakout and likely bring strong continuation, but for now BTC remains in a tight battle between buyers and sellers.
The 50-day moving average continues to trend upward and is providing dynamic support, while the recent surge in volume suggests traders are positioning for a larger move. If price fails to break cleanly above $112K, we could see a short-term retest of the $105,787 area – the previous breakout level – before any further upside. Overall, Bitcoin remains in a strong uptrend, with the path of least resistance clearly higher if bulls can secure a decisive close above all-time highs.

BITCOIN facing the most important Roadblock of the Cycle.Bitcoin (BTCUSD) reached $112000 yesterday, testing the May 22 2025 All Time High (ATH) and immediately got rejected. This ATH rejection is key to the continuation of the bullish trend as the entirety of the ATH Resistance Zone is perhaps the last (and most important) Roadblock before the final rally of the Cycle that could potentially price the new Top.
You can see that this Resistance Zone already had 3 rejections previous on its bottom and yesterday was the first one on its top.
A break above it can target $118400 at least within days, in anticipation of a +10.20% Bullish Leg, similar to the one following the June 22 Low.
If the rejection prevails however, we may see a pull-back that will test the bottom of the (blue) Channel Up.
Which scenario do you think will prevail? Feel free to let us know in the comments section below!
-------------------------------------------------------------------------------
** Please LIKE 👍, FOLLOW ✅, SHARE 🙌 and COMMENT ✍ if you enjoy this idea! Also share your ideas and charts in the comments section below! This is best way to keep it relevant, support us, keep the content here free and allow the idea to reach as many people as possible. **
-------------------------------------------------------------------------------
💸💸💸💸💸💸
👇 👇 👇 👇 👇 👇

July 7 Bitcoin Bybit chart analysisHello
This is Bitcoin Guide.
If you "follow"
You can receive real-time movement paths and comment notifications on major sections.
If my analysis was helpful,
Please click the booster button at the bottom.
Here is the Bitcoin 30-minute chart.
There is no separate Nasdaq indicator announcement today.
I think the Nasdaq lower gap section retracement will be the focus.
Recently, sideways movement or adjustments have been coming out before the trend,
So I proceeded safely in preparation for variables.
*When the blue finger moves
Bidirectional neutral
Short->long switching or 2nd section long waiting strategy
1. $109,380 short position entry section / cut-off price when orange resistance line is broken
2. $108,997.8 long position switching / cut-off price when purple support line is broken
3. $109,610.9 long position 1st target -> Top 2nd target -> Good 3rd target
It seems important whether the purple support line is broken from the current position. If the first section at the top touches 108,997.8 dollars and comes down,
it may become a vertical decline section.
If it comes down right away, it is a long-waiting strategy in the final second section,
and if it deviates from the bottom section today
(6+12 pattern)
because it is a full candle when the gap section is touched,
it may fall to 107,484 dollars indicated at the very bottom.
I have important work to do tomorrow,
so I will take a day off and come back on Wednesday.
Please use my analysis so far for reference and
I hope you operate safely with principle trading and stop loss prices.
Thank you.

BTCUSD BULLISH MORE all time high again The price may briefly break above the 113,000–114,000 level (first target) to trap long positions, then sharply reverse.
Support Break Warning:
If BTC fails to hold the 110,000–108,000 support zone, it could accelerate a drop to deeper supports:
Support Area 1: 106,000
Support Area 2: 102,000
Extreme Bearish Target: 96,000–94,000
What to Watch:
Bearish divergence on lower timeframes
Volume drop on new highs = possible fakeout
Candle rejection from 113,000–114,000 zone

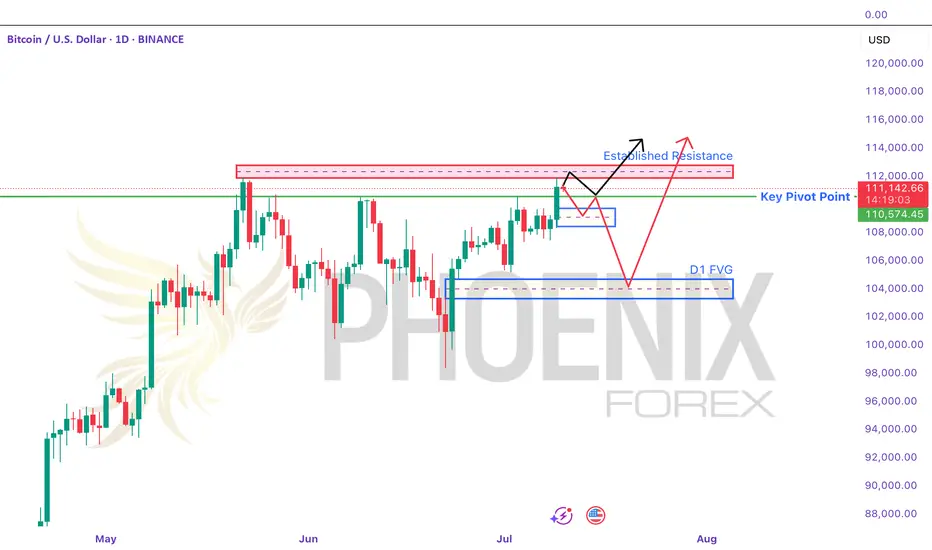
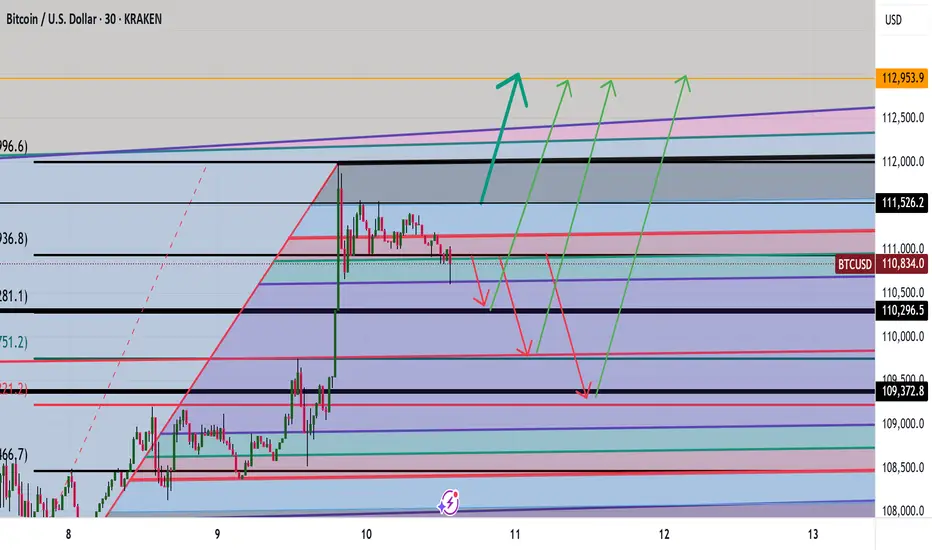
BTCUSD At Crucial Pivot Point. Is This The Ceiling? - PhoenixFX BTCUSD Price-Action Analysis & Scenarios
Below is an overview of the two possible paths for Bitcoin over the coming days, as sketched out by the black and red arrows on your chart. We’ll also highlight the key pivot level and resistance zone that will decide which scenario plays out.
🔵 Key Levels to Watch
Established Resistance (~$111,800–$112,500)
This zone marks multiple failed attempts to break higher in recent weeks. It’s where large stop-runs and sell-side limit orders tend to cluster. A decisive daily close above $112K is required to signal genuine bullish continuation.
Daily Pivot Point (~$110,600)
Acting as the “battle line” between bulls and bears, this pivot is the first level to confirm market bias.
Above $110.6K: Tends to favor buyers, suggesting strength and higher-high attempts.
Below $110.6K: Gives the bears the edge, increasing the odds of deeper retracements.
📈 Black-Arrow (“Bullish Continuation”) Scenario
Break & Hold Above Resistance
Price thrusts cleanly above $112K on strong volume.
Retest the H4 Order Block (~$111,000–$111,200)
A shallow pullback into the highlighted H4 demand zone (blue box) offers a lower-risk long entry.
New Highs
From there, Bitcoin resumes its uptrend, closing the week with fresh highs above the prior $113K peak.
Key Trigger: Sustained daily close above $112K, followed by a successful retest of that level.
📉 Red-Arrow (“Bearish Rejection & Dip”) Scenario
Rejection at Resistance
Price stalls and reverses somewhere between $111,800–$112,500, forming a bearish reversal candle.
Drop to Daily FVG Zone (~$104,000–$105,000)
This larger Daily Fair-Value Gap (blue box lower on the chart) coincides with strong weekly support—an ideal zone for dip buyers.
Recovery Rally
After absorbing selling pressure in the FVG, BTC bounces back toward the established resistance, setting up a second test of $112K.
Key Trigger: Clear bearish price action (e.g., engulfing or pin-bar) in the $111.8K–$112.5K zone, followed by a daily close below the pivot at $110.6K.
🎯 How to Trade These Setups
Bullish Entry:
Wait for daily close > $112K
Enter on pullback into $111K–$111.2K (H4 order block)
Stop below $110.6K pivot; target new highs above $113K+
Bearish Entry:
Look for bearish reversal signals in $111.8K–$112.5K
Enter on break & close below $110.6K pivot
Target $104K–$105K (Daily FVG); stop above $112.5K
Note: The pivot at $110.6K is your first “line in the sand” for bias—trade in the direction of the break, and use the major resistance zone to confirm strength or failure. Always manage your risk and adjust to how price actually unfolds!
Just a Heads-Up:
This is my take on the charts—not gospel, not financial advice, and definitely not a crystal ball 🔮. Trading is part skill, part patience, and part “what just happened?” 😅
We all see things a little differently, and that’s the beauty of it. So if you’ve got a hot take, wild theory, or just want to drop some chart wisdom—hit the comments!
Let’s grow, learn, and laugh through the madness together. 🚀📈
Each one, teach one.
— Phoenix FX Team 🔥🦅