Bitcoin / U.S. Dollar 4-Hour Chart - CRYPTO4-hour candlestick chart displays the price movement of Bitcoin (BTC) against the U.S. Dollar (USD) from late June to mid-July 2025. The current price is $110,838.12, reflecting a 1.75% increase (+$1,908.56). The chart highlights a recent significant upward movement, with a notable green candlestick indicating a strong buying trend. Key price levels include a support zone around $109,336.26 and resistance near $112,117.13. The chart also shows buy and sell options at the current price level of $110,838.11.
BTCUSD.P trade ideas
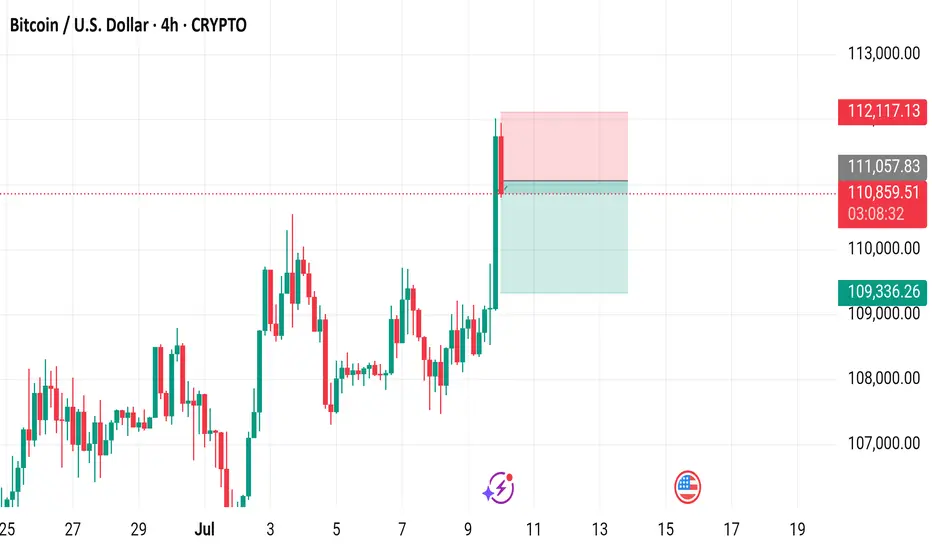
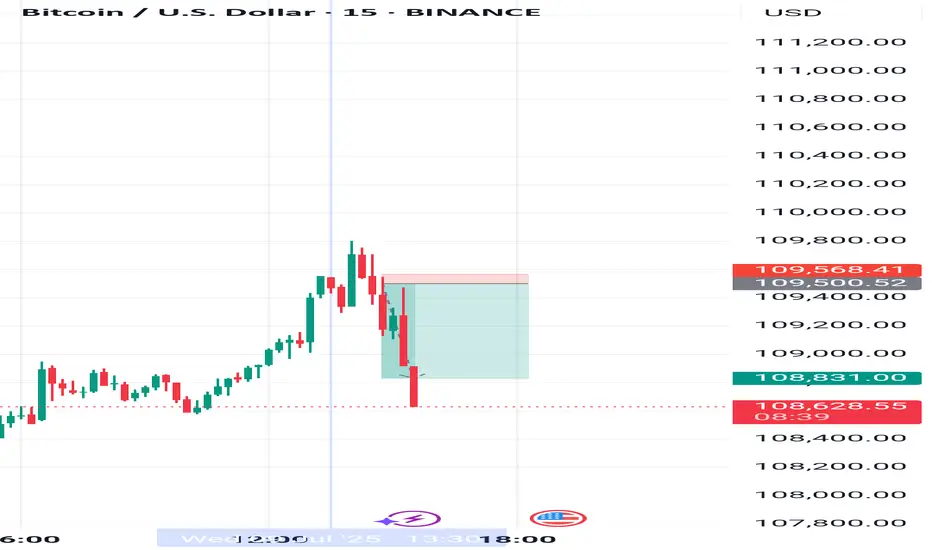
Bitcoin on Fire: Targeting $110K in Relentless Uptrend!Hi traders! , Analyzing BTC/USD on the 30 minute timeframe, price is currently respecting an upward channel and showing consistent higher highs and higher lows. The recent bounce from dynamic support suggests bullish continuation.
🔹 Entry: 109,545
🔹 Take Profit (TP): 110,612
🔹 Stop Loss (SL): 108,438
Price is trading above both the 50 and 200 EMA, confirming bullish momentum. The RSI remains above the midline, indicating buyers are still in control. This long setup offers a favorable risk-reward ratio within the context of the broader uptrend.
A confirmed breakout from the short-term resistance, combined with trendline support and channel structure, adds confluence to this idea. Watch for potential resistance near the 110,612 zone.
⚠️ DISCLAIMER: This is not financial advice. Every trader is responsible for their own decisions and risk management.

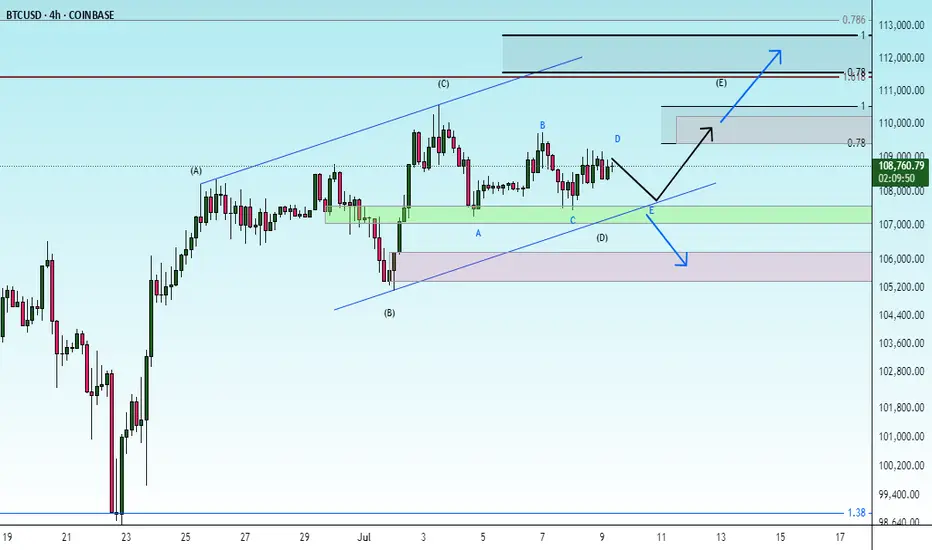
Bitcoin - Liquidity grab at $111.000?This 4-hour BTCUSD chart illustrates a potential short-term bullish continuation scenario followed by a deeper retracement, highlighting key liquidity levels and an important Fair Value Gap (FVG) support zone.
Liquidity sweep
At the top of the current price action, just above the $110,612.16 level, there is a clear area of resting liquidity. This zone has likely accumulated a significant number of stop-loss orders from traders who are shorting the market or who went long earlier and are protecting profits below previous highs. The market tends to seek liquidity to fill institutional orders, making this zone a high-probability target for a sweep. As a result, price is likely to take out these resting stop orders in a quick upward move, often referred to as a "liquidity grab" or "stop hunt", before potentially reversing or consolidating.
Bullish 4H FVG
Following this liquidity sweep, the chart suggests a retracement into a bullish 4-hour Fair Value Gap (FVG) located around the $106,600 to $107,400 region. This imbalance zone was formed during an impulsive move up, leaving behind a gap between the wicks of consecutive candles. Such gaps represent areas where demand previously overwhelmed supply, and they often act as strong support on a retest. If price revisits this zone, it is expected to offer support and could serve as a base for another upward push, assuming bullish momentum remains intact.
Downside risk
However, if the bullish FVG fails to hold as support and price breaks down through this imbalance zone, it would signal a weakening of bullish structure. In that case, the breakdown would likely lead to a deeper correction or even a trend reversal, with price seeking lower levels of support further down the chart. This would invalidate the short-term bullish scenario and suggest that sellers are gaining control, possibly triggering further liquidations and more aggressive selling pressure.
Conclusion
Overall, the chart is currently leaning bullish, anticipating a liquidity sweep to the upside followed by a potential pullback into the FVG. The reaction at the FVG will be critical in determining whether the market can continue higher or if it shifts into a deeper bearish correction.
Disclosure: I am part of Trade Nation's Influencer program and receive a monthly fee for using their TradingView charts in my analysis.
Thanks for your support.
- Make sure to follow me so you don't miss out on the next analysis!
- Drop a like and leave a comment!

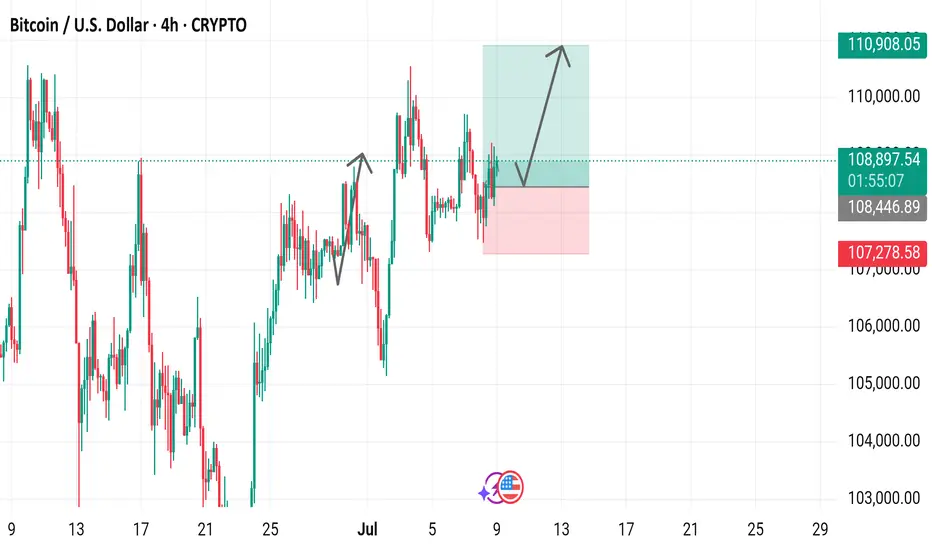
Bitcoin / U.S. Dollar 4-Hour Chart (BTCUSD)4-hour candlestick chart displays the price movement of Bitcoin (BTC) against the U.S. Dollar (USD) from late June to early July 2025. The current price is $108,895.04, with a 24-hour change of +$619.70 (+0.57%). Key levels include a support zone around $107,278.58 and a resistance near $110,908.05. The chart highlights recent price action, including a potential upward trend indicated by a green shaded area, with buy and sell signals marked at $108,895.04.

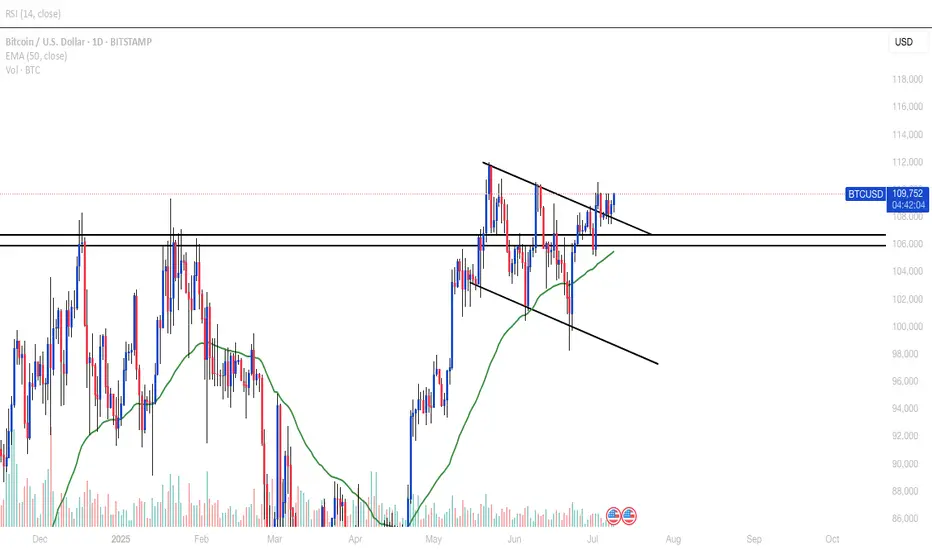
Fake pumpWe had a good run.
BTC is due a correction.
Weekly RSI is Overbought.
Trendlines match fibonacci zones.
Overall fundamentals seem good longterm, but market needs a reset.
Many shorts to be liquidated in 115-117k , more than a billion dollars.
A billion dollars worth of longs to be liquidated at 97k.
Betting on fake pump,majorly overbought daily RSI, liquidate shorts, dump bitcoin, liquidate longs, load and reset.
95k seems reasonable, but theres a Fair Value Gap at 91k, and these get filled almost every time.With a spike through to the 0.61 fibonacci at 88k.
Possibility of 80k if theres a black swan mass panic event, this will touch the 0.78 fib and touch an unbroken bullish trendline from 2023. But very unlikely right now, just a healthy correction and reset before the true bull starts.
Alts will probably bleed hard, since faith is so shaken in them. Stack when theres mass fear.
After the next real pump rotation most probabably begins.
Good idea is to DCA at 95k, 90k is a solid zone, 80k would be absolutely perfect. Good levels for alts are corresponding to these prices.

BTC H2 2025 - H2 2026My idea of what I think will unfold the rest of the year and next year for BTC.

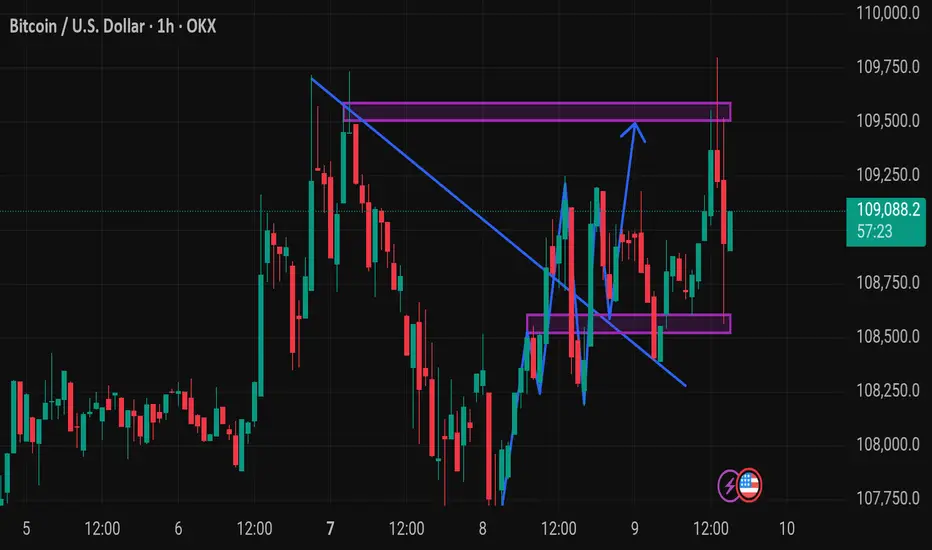
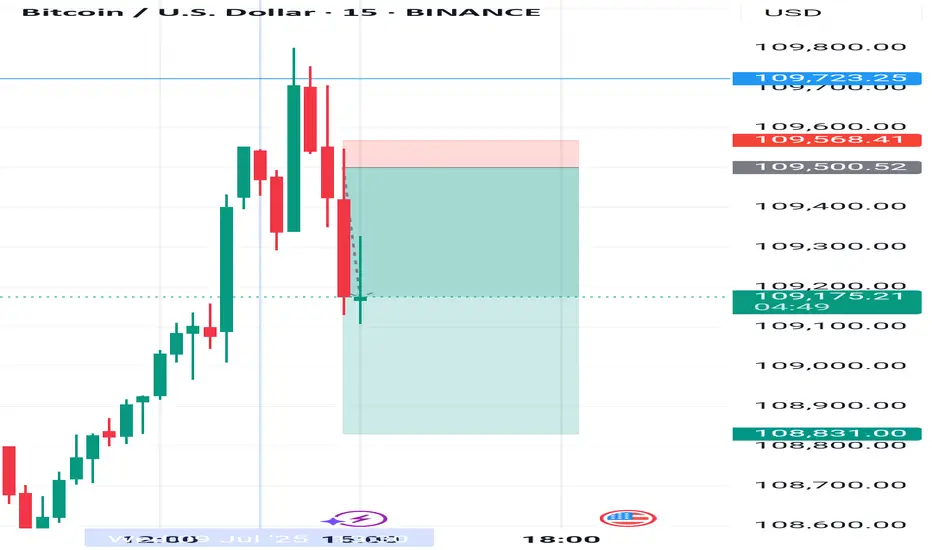
Btcusd techinical analysis.This BTC/USD 1-hour chart suggests a bullish breakout scenario. Here's a breakdown of key technical signals:
Key Observations:
1. Price Level: Current price is $109,582.1, with a recent rise of +0.59%.
2. Resistance Zones (Purple Boxes):
First resistance near $109,800 – $109,900.
Second (minor) resistance around $109,300 – $109,400.
Price is testing the upper resistance zone now.
3. Bullish W Pattern:
A sharp drop and recovery formed a “W” pattern—common before breakouts.
The neckline of this W is being challenged.
4. Trendline Breakout Projection (Blue Arrows):
The chart suggests a breakout projection towards $110,300 – $110,400.
This is based on the upward trajectory from the recent swing low.
5. Support Zone (Lower Purple Box):
Support established at $109,150 – $109,250.
If price

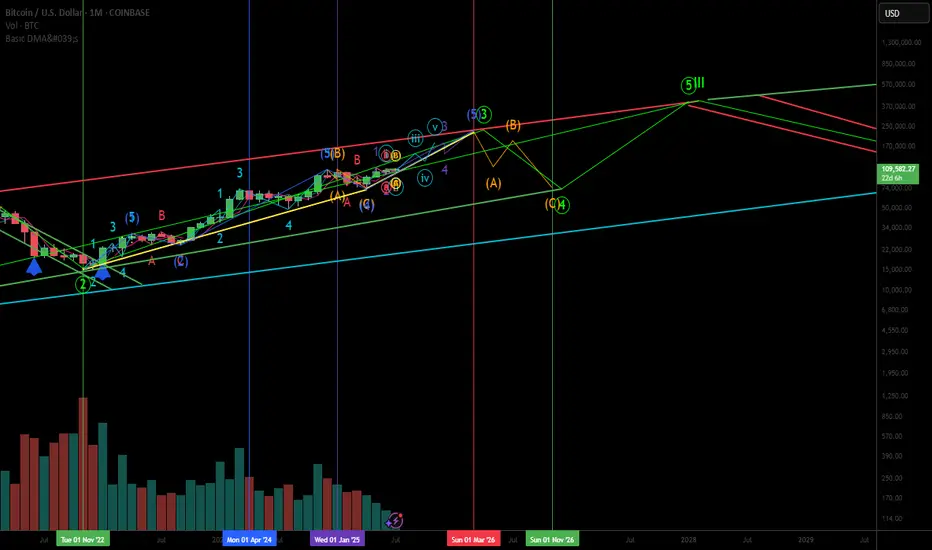
An Elliot Wave indicating a Bitcoin SupercyclePrimary cycle 3 ends approximately March 2026 at $225,000. Primary cycle 4 ends around Nov 2026 at $75,000. Primary cycle 5 and the end of cycle I ends near $400,000 in Jan 2028.
This illustrates Bob Loukas' latest thought toward an extended right translated bull Bitcoin cycle ending in early 2026 instead of the end of 2025. Then a shortened bear market that ends in Nov 2026, 4 years after the last bear cycle in Nov 2022.
Then a "left" translated cycle ending in Jan 2028 near $400,000 which completes Cycle I. It looks like a supercycle by combining the right translated current cycle with a left translated next cycle.
A good cycle strategy would be to take at least partial profit near $225,000, reaccumulate near $75,000 at the end of 2026 in anticipation of a big move up to near $400,000 by Jan 2028. A major sell at that point would be prudent. Loukas believes after a 12-16 month left translated cycle into early 2028 will be followed by a 2.5 year or more bear market to the end of 2030.
BTC about to cum?Just a reminder: These monthly candles may appear small, but they're all green for now. This doesn't look bearish; it looks like a buildup before an explosion.

Breakout July 10, 2025Price is getting compressed in a smaller higher pennant above the upper limit bull flag. I suspect that we see one more sharp pullback in mid-late August before achieving cycle pico top. Brace yourselves, tomorrow should be the day!
BITCOIN - SELL TO $86,000 (8H VIEW)I see selling opportunities right now for Bitcoin.
⭕️LQ Swiped Above Previous Wave 3 High ($109,000).
⭕️Wave 4 Complex Correction Complete (5 Sub-Waves).
⭕️(Wave 5 Impulse Bullish Move Complete (5 Sub-Waves of 1,2,3,4,5).
❌Invalidation Zone Above Wave 5 High ($112,140).
High risk trade as BTC could still head high for Wave 5 around $120- $130,000. Use strict risk management.

XRP breaks out: 19% rally in sightXRP has just broken out of an inverse head and shoulders pattern, a classic bullish setup that points to a potential 19% rally. The breakout comes at a time when the US is expected to deliver key crypto regulation updates by July 22. If the legal outcome is positive, it could fuel further upside not only in XRP but across the broader crypto market. This setup offers a strong risk-to-reward profile, especially if Bitcoin also breaks out of its current rectangle pattern.
This content is not directed to residents of the EU or UK. Any opinions, news, research, analyses, prices or other information contained on this website is provided as general market commentary and does not constitute investment advice. ThinkMarkets will not accept liability for any loss or damage including, without limitation, to any loss of profit which may arise directly or indirectly from use of or reliance on such information.

Analyst Highlight: Bitcoin Levels to Watch After new Highs $109KA close-up analysis of BTC's push beyond $109k: Short vs Long Mas, VWAP alignment, and potential retracement zones. Expert-scoped with easy-to-read annotations and key entry/exit gates- perfect for adding to your watchlist.

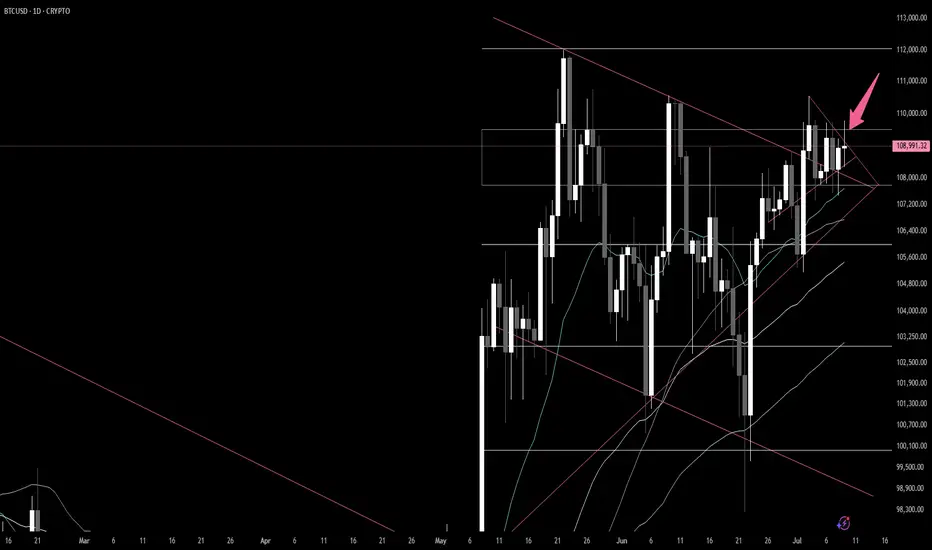
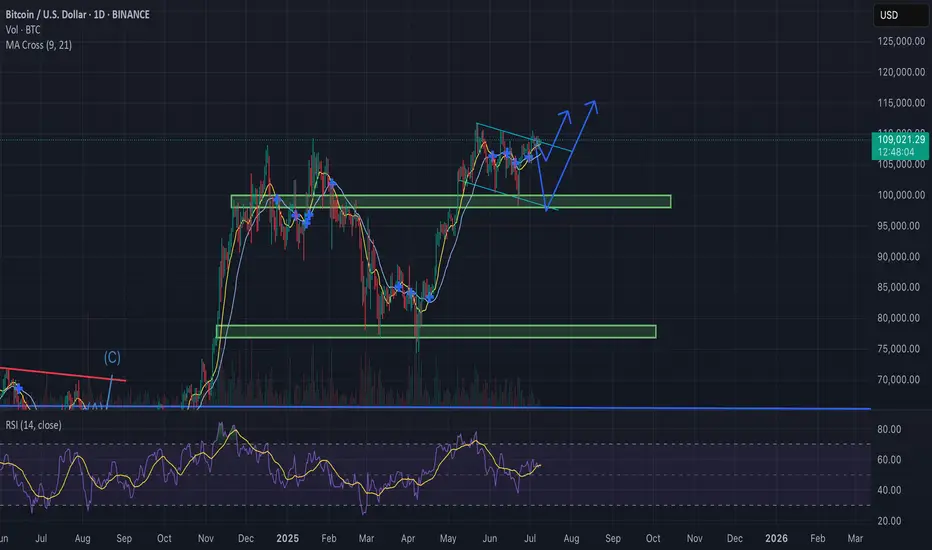
Bitcoin Update – Bullish Falling Wedge in Play?BTC/USD is currently trading near $108.8K, compressing within a falling wedge formation — historically a bullish continuation pattern, especially after a strong uptrend.
Why the Bias Remains Bullish:
Bullish MA Cross: Short-term MAs (9/21) are aligned for upside momentum.
Falling Wedge: Price compressing with lower highs and lows, coiling for a breakout.
RSI Strength: RSI (purple) remains elevated, supporting continued upside pressure.
Fundamental Catalysts:
Trump delays trade war announcements, reducing global uncertainty.
FOMC meeting in late July: Trump pushes for rate cuts, potentially bullish for risk assets like BTC.
If BTC breaks out above the wedge resistance with convincing volume:
Retest likely at ~$110K
Targets : $115K → $120K+

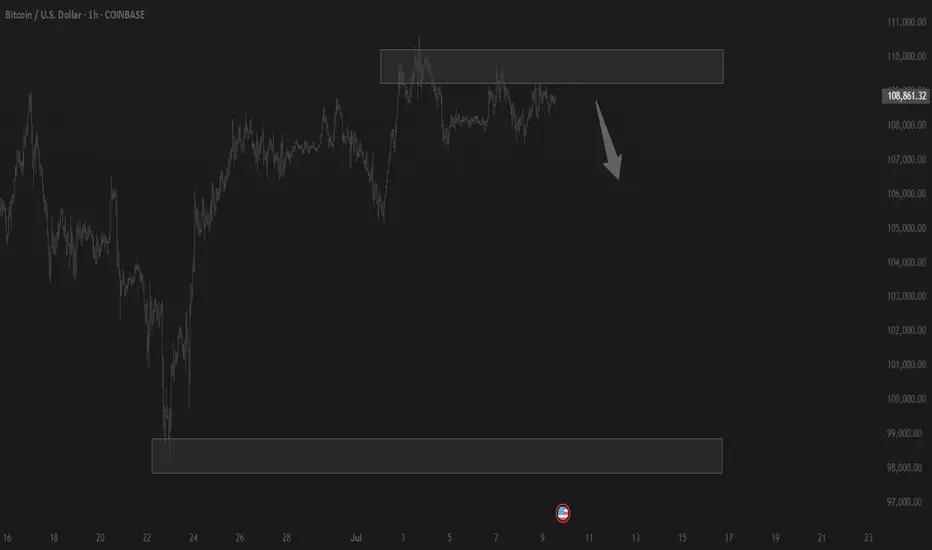
Trading balanceTrading balance The price of the asset has rebounded from the balance zone. With the prospect of growth into the resistance zone.
BTCUSD – Range High Retest at 110KBitcoin is consolidating below the 110,736.11 resistance after reclaiming support from the 102,558.1 zone. Price is holding a tight range, building pressure just under key resistance — a breakout above this could spark a move to new highs.
Support at: 102,558.1 🔽 | 91,357.7 🔽
Resistance at: 110,736.1 🔼 (range high)
🔎 Bias:
🔼 Bullish: Break and hold above 110,736.1 opens room for bullish continuation.
🔽 Bearish: A break back below 102,558.1 would suggest a potential shift toward 91,357.7 support.
📛 Disclaimer: This is not financial advice. Trade at your own risk.

possibility of uptrendIt is expected that the triangle pattern will form according to the specified paths, then there will be a possibility of a trend change and the beginning of the upward trend.
If the price crosses the support area, the continuation of the downward trend will be likely.