BTCUSD Short (Yesterday)I missed this one yesterday - BTC is now net short on the regression break. It bounced hard on the Iran/Israel news but is currently still short.
BTCUSD.P trade ideas

BTCUSDBTCUSD remains in a bullish leg with a projected target at 107,848, aligning with point B of a potential ABCD harmonic structure. Should price reach this level, we will closely monitor for a bearish reversal setup.
From a Smart Money Concepts (SMC) standpoint, we are identifying two key zones of interest for potential short entries:
A newly formed supply zone (order block) at 108,660,
The 107,848 level, corresponding with the anticipated completion of the B leg.
A valid short scenario will require confirmation through SMC triggers — such as a liquidity grab, followed by a break of structure (BOS) or change of character (CHOCH), ideally accompanied by displacement. Upon such confirmation, we will look to initiate short positions with appropriate risk management.

BTCUSD 6/23/2025Come Tap into the mind of SnipeGoat, as he gives you a nice quick analysis of Bitcoins current Price Action to determine Price's next move. THIS IS ONE YOU DON'T WANT TO MISS!
_SnipeGoat_
_TheeCandleReadingGURU_
#PriceAction #MarketStructure #TechnicalAnalysis #Bearish #Bullish #Bitcoin #Crypto #BTCUSD #Forex #NakedChartReader #ZEROindicators #PreciseLevels #ProperTiming #PerfectDirection #ScalpingTrader #IntradayTrader #DayTrader #SwingTrader #PositionalTrader #HighLevelTrader #MambaMentality #GodMode #UltraInstinct #TheeBibleStrategy

A TA Macro Look into Bitcoin to assess directionThis is a look into the macro developments happening currently in Bitcoin.
This is strictly a TA look into the big picture. We zoom out to Timeframes bigger than 1W.
At times zooming in to check (3 Day, 5 Day, maybe 1D) for potential swing trades.
I tend to look into things like price action, indicators, volume and other data to sway probabilities of where an asset may go and determine best opportunities of supply and demand zones based on my interpretations.
So jumping right in this is a look into price action on the 1 Month timeframe.
Notice trend lines drawn.
Notice the Ascending channel.
Notice the Blue rectangle zone.
Notice this months (June) Candle
Our current June candle is in a critical area.
We are around the horizontal resistance zone, indicated by red horizontal line.
This red horizontal resistance line is a powerful one.
Our previous interaction generated a massive Bearish engulfing monthly candle.
This area is not to be joked with and would urge to consider looking for more signs or better data to support continuation of bull run. If not a sell off is in the cards.
Notice our current June candle
Having equal length upper and lower wicks indicate that this month was neutral.
Bulls nor the Bears came on top.
If we close around this in 8 days.
Probabilities would be 50/50 just based on price action and candles for price movement in July.
We would need to look for other signs in indicators or something else, in other words look for confluence of multiple signs whether bull or bear.
The Ascending channel is also in my opinion over extended.
Notice the price action touch points on Green ascending support line.
The duration between touches is coming down.
2nd touch happened 365 days after first. Which was the initial part of Crypto bull market.
3rd touch happened 214 days after.
We are currently 61 days in after 3rd touch. Considering this and being logical, we could be getting close to another touch.
But consider also that the duration can extend well into in the 100's (of days), before we touch.
Notice also the Blue rectangle zone. This marks a side ways range of bitcoin.
The orange horizontal line is mid point of this blue zone.
A scenario could be that price goes to where the orange horizontal line meets the green sloping support line.
The confluence of these 2 support lines, can be a decent area for potential bounce (which can be temporary).
A break down of these 2 lines could also lead Bitcoin back down to the lower border of the Blue rectangle also indicated by Green horizontal line, which is a massive supply zone at the moment.
This scenario in my opinion would be a high probability trade by looking for bounce up but please keep in mind this does not mean a bull run would continue.
Look for more posts as things develop on Bitcoin.
DISCLAIMER: This is not financial advice, i am not a financial advisor. The thoughts expressed in the posts are my opinion and for educational purposes. Do not use my ideas for the basis of your trading strategy, make sure to work out your own strategy and when trading always spend majority of your time on risk management strategy.

Bitcoin Stock Chart Fibonacci Analysis 062325Trading Idea
1) Find a FIBO slingshot
2) Check FIBO 61.80% level
3) Entry Point > 100,622/61.80%
Chart time frame:C
A) 15 min(1W-3M)
B) 1 hr(3M-6M)
C) 4 hr(6M-1year)
D) 1 day(1-3years)
Stock progress:A
A) Keep rising over 61.80% resistance
B) 61.80% resistance
C) 61.80% support
D) Hit the bottom
E) Hit the top
Stocks rise as they rise from support and fall from resistance. Our goal is to find a low support point and enter. It can be referred to as buying at the pullback point. The pullback point can be found with a Fibonacci extension of 61.80%. This is a step to find entry level. 1) Find a triangle (Fibonacci Speed Fan Line) that connects the high (resistance) and low (support) points of the stock in progress, where it is continuously expressed as a Slingshot, 2) and create a Fibonacci extension level for the first rising wave from the start point of slingshot pattern.
When the current price goes over 61.80% level , that can be a good entry point, especially if the SMA 100 and 200 curves are gathered together at 61.80%, it is a very good entry point.
As a great help, tradingview provides these Fibonacci speed fan lines and extension levels with ease. So if you use the Fibonacci fan line, the extension level, and the SMA 100/200 curve well, you can find an entry point for the stock market. At least you have to enter at this low point to avoid trading failure, and if you are skilled at entering this low point, with fibonacci6180 technique, your reading skill to chart will be greatly improved.
If you want to do day trading, please set the time frame to 5 minutes or 15 minutes, and you will see many of the low point of rising stocks.
If want to prefer long term range trading, you can set the time frame to 1 hr or 1 day.

$BTC Bullish Momentum Building Bitcoin has successfully broken CRYPTOCAP:BTC Bullish Momentum Building
Bitcoin has successfully broken above both the $100K support and the 50 EMA at $103K, showing strong signs of bullish continuation. A retest of $103K may occur, but structure now favors the upside.
🔸 Support Now at 103,000 – 100,000 (Acting as Support):
The breakout above $103K flips this zone bullish. If a retest holds, it confirms strength and could launch the next leg up.
🔸 Upside Target: 110,324 and Higher
Now that BTC is trading above $103K, a move toward $110K+ is likely. If momentum continues, a breakout beyond the previous high could follow.
🔸 Risk Level at 103K:
As long as BTC holds above this level on retest, bulls remain in control. A break back below would weaken the setup.
🔸 Outlook:
🔹 Watch for a successful retest of $103K – that’s your long trigger.
🔹 Target zone: $108K → $110K+
🔹 Invalidation: Close back below $103K
Momentum shifting bullish — setup favors continuation higher unless invalidated. Stay alert for breakout volume.

BTCUSD ATH Hunt is onBTCUSD will shoot up very soon. A bullish flag emerging right in time. Trump announces ceasefire and potentially stops WW3, what a Hero. Stock up on some of this coin you're gonna need it.

BTC vs ETH LongBTC vs ETH ratio is now net long on the regression break.
I am not trading this trade.

BTC SHORT TP:97,500 23-06-2025We’re looking at a false bullish spike setup — that means it looks strong, but it’s all smoke.
Shorting between 102,500–103,600, targeting 97,000–97,800 with a solid 3.8 RR.
Timeframe: 4H.
Expected to play out in the next 24 to 30 hours, otherwise invalid.
There’s still a chance of manipulation to the upside, but we’re betting on rejection.
We don’t use indicators, we’re not out here drawing lines or cute little shapes — I just give you a clean trade.

Bitcoin,when it’s all said and done.Bitcoin has no reason to revisit under 100k before a new high. Although markets are manipulated by large players often, it’s usually to change market sentiment for those who are over leveraged and ignorant of the whale games. If it were to wick down to below 100k, I strongly believe it will reverse violently to the upside surpassing ATH. There will be no WWIII. Believe in righteousness and give peace a chance.

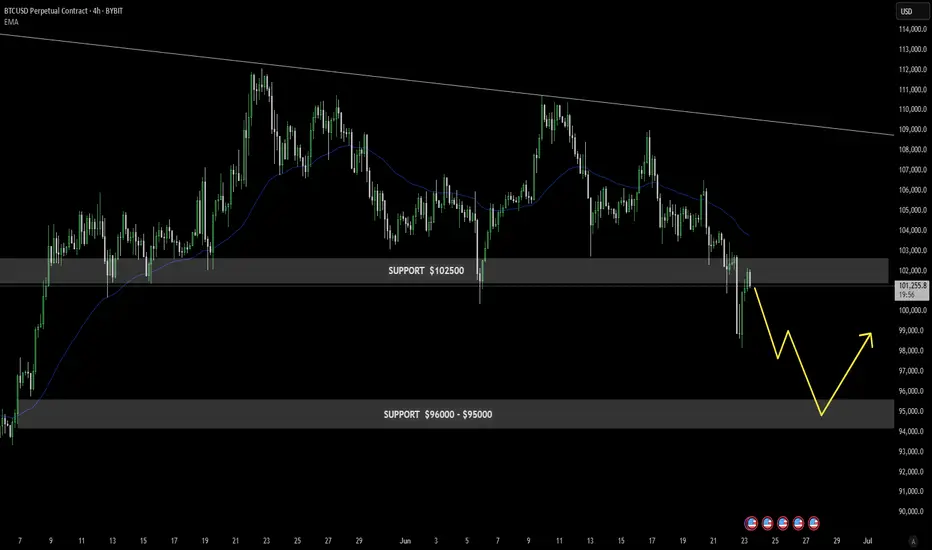
Bitcoin at the Edge: Breakdown or Bounce?Bitcoin is currently trading around $101,210, having failed to reclaim the $102,500 support zone, which has now flipped into resistance.
This rejection confirms continued bearish momentum, as reflected in the downward-trending EMA.
The next major area of interest lies between $96,000 and $95,000, where buyers previously stepped in. The chart suggests a probable move lower into this zone, followed by a potential bounce.
Unless BTC reclaims $102,500 with strong conviction, the short-term bias remains bearish, with traders eyeing the lower support for possible reversal or accumulation.
Bitcoin Wave Analysis – 23 June 2025
- Bitcoin reversed from round support level 100,000
- Likely to rise to resistance level 105,000
Bitcoin cryptocurrency recently reversed from the support area between the round support level 100,000, the lower daily Bollinger Band and the 38.2% Fibonacci correction of the upward impulse from April.
This support area was further strengthened by the support trendline of the daily down channel from May.
Given the clear daily uptrend, Bitcoin cryptocurrency can be expected to rise to the next resistance level 105,000.

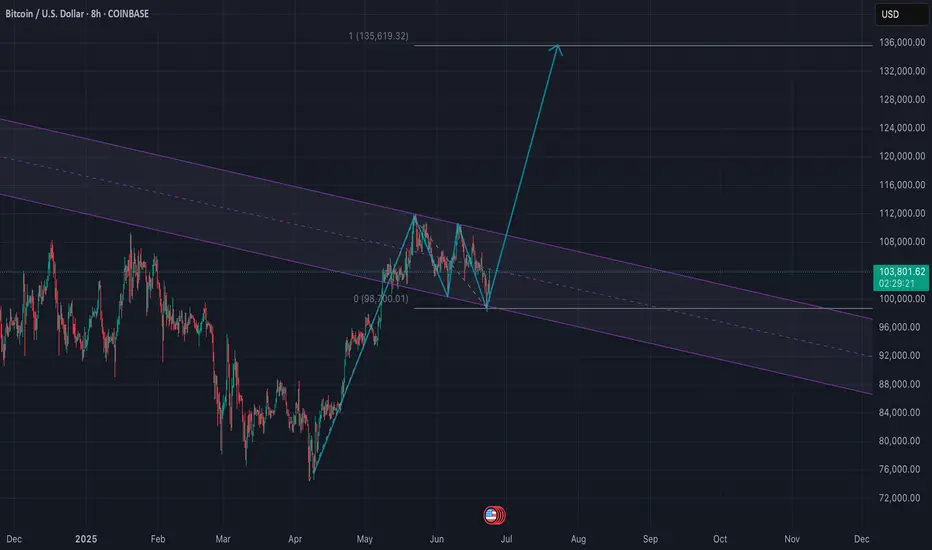
BTC USDT 135k TARGET. BTC USDT going to cross the 135k mark by the year end before cooling off.
HISTORY REPEATS ITSELF.

Next target, minimum $135kTo me this looks like a very obvious bull flag. Next target, $135k derived from the length of the flag pole and repeating it from the recent low.
BTCUSD This setup assumes institutional players:
Induce retail breakout trades at highs
Spike price slightly above the zone (stop raid)
Then dump into downside imbalance/liquidity
We’re riding that wave, not chasing price.
DYOR.

Bitcoin 1hr TIME Cycle Alright ladies and gentlemen the 1hr TIME Cycle is almost completed .
In the next 6 to 10 hrs (if not sooner) the 1hr Cycle will be completed and it will stop going up to start moving sideways and then start to rolling down for a test to the $100k line again and eventually a test to the recent low of $98k, so whatever the high it prints during that period of TIME that will be it, at least until the set up is ready again. We will follow with updates.
Book profits or at least protect capital with sl. Stay tuned
BTCUSD 4-Hour Analysis – Sell Setup IdeaCurrently, the trend on BTCUSD is bearish. On the 4-hour chart, I’m watching for a reaction at the Balanced Price Range (BPR) zone. This area aligns with a daily Rebalanced Breaker (-RB), adding higher time frame confluence.
In addition to the BPR, there’s an Order Block (OB) within the same region, and a nearby swing high, which strengthens the case for a bearish reaction. If price respects this zone, I expect continuation to the downside targeting the 98,000 and the 96,000 price level.

Bitcoin / U.S. Dollar 4-Hour Chart (BTCUSD)4-hour candlestick chart displays the price movement of Bitcoin (BTC) against the U.S. Dollar (USD) as of June 23, 2025, 03:45 PM CEST. The chart shows a recent sharp decline from a peak of approximately 104,443.81 USD to around 100,479.47 USD, with a current price of 102,035.20 USD, reflecting a 1.037.09% increase. Key levels include resistance around 104,000 USD and support near 100,000 USD, with notable volatility indicated by the candlestick patterns and a marked low point adorned with U.S. flags and a lightning bolt symbol.

Cup and Handle Hello Traders 👋 — Hope you're having a strong start to the week!
Let's dive into the BTCUSD Daily Chart 📈 — we’re looking at a Cup and Handle setup that's matured beautifully.
🔵 Price carved out a clean rounded base (cup), followed by a consolidation handle right below resistance.
🟠 The 200 SMA is holding as dynamic support.
⚡️ A confirmed break above 109K could launch price toward 130K+, with clear Fibonacci extension targets in sight.
Key Zones:
Handle Support: 100,472
Breakout Line: 109,360
Main Target: 130,867
Extended: 136K–144K
Structure ✅ | Momentum Building ⚡ | Risk Managed 🎯
Stay sharp, stay patient. Structure first — breakout next.

B/$We have already seen a level below $100,000.
I think there is still more to go before it turns up.
I don't see any resistance for a trend reversal at the moment.
So you can hold your short positions and just move your stop loss even lower.

BTC USD LONG RESULT Bitcoin Price dumped after holding both the resistance zone and Trendline, and on its way down held both Support zone and the major Support Trendline, from where I took the entry to the major resistance.
But price held the lower resistance zone and dumped massively from there.
Closed at B.Even though, stronger setups to come.

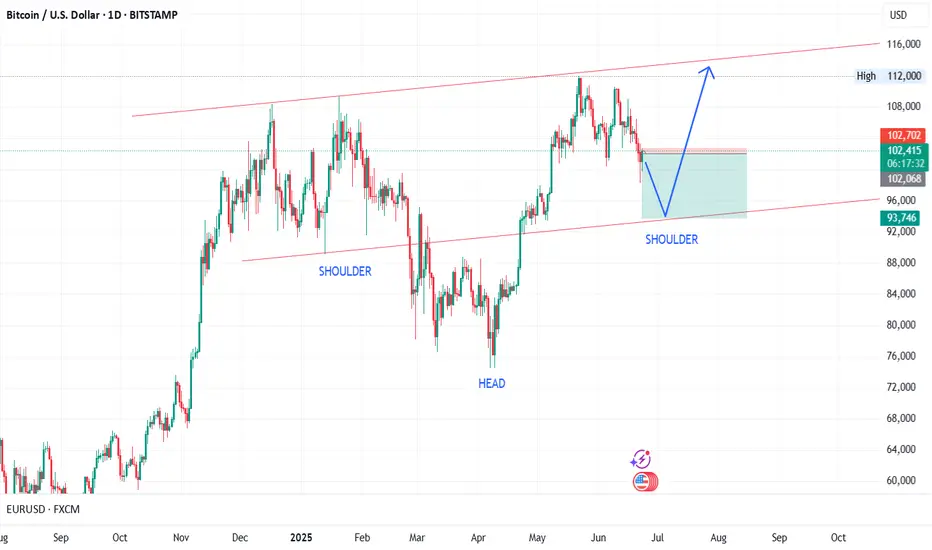
BTC short because head and shoulders pattern.It shows a baseline with three peaks with the middle peak being the highest. The head and shoulders chart pattern depicts a bullish-to-bearish trend reversal and it signals that an upward trend is nearing its end.
BTCUSD Continues Falling DownBitcoin (BTC) price remains steady above a key support level, trading slightly above $106,000 at the time of writing on Friday. The uncertainty looms as geopolitical tensions between Iran and Israel show no sign yet of an exit strategy from either side.
