BTCUSDBTCUSD also fell from a high level, reaching a high of around 119700, only 300 points away from the target of 120k. The price after the decline is now around 118600. Buying at a low level is the main focus. The reference buying point is 118500-118000. The target is above 120k. Stop loss 117300
BTCUSD.P trade ideas
Ethereum is Trending HigherSince April trough, Ethereum has risen by 179%, delivering a higher rate of return than Bitcoin at 66%. But most of our attention is on Bitcoin, breaking above the 120,000 level.
Why is Ethereum quietly gaining ground —and what does the future hold for Ethereum?
Mirco Bitcoin Futures and Options
Ticker: MET
Minimum fluctuation:
$0.50 per ether = $0.05 per contract
Disclaimer:
• What presented here is not a recommendation, please consult your licensed broker.
• Our mission is to create lateral thinking skills for every investor and trader, knowing when to take a calculated risk with market uncertainty and a bolder risk when opportunity arises.
CME Real-time Market Data help identify trading set-ups in real-time and express my market views. If you have futures in your trading portfolio, you can check out on CME Group data plans available that suit your trading needs www.tradingview.com

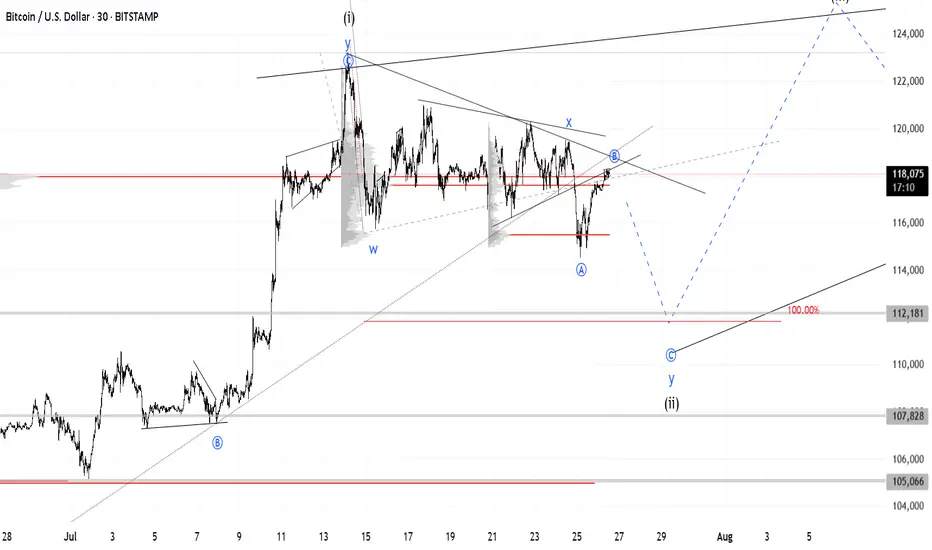
BTC at Multi-Factor Resistance: Wave Count Hints at Downside BTC is looking increasingly bearish as the price has risen to a resistance zone formed by multiple factors: trendlines, the POC (Point of Control), and moving averages.
The wave count also supports this bearish outlook / the bearish case.
Bitcoin ConsolidatesBitcoin continues to flex its strength, grinding higher and holding firm just below resistance at $123,231. After breaking out above $112,000 earlier this month with a burst of volume and momentum, price has cooled off slightly, consolidating in a tight range between $117K and $123K. This isn’t weakness – it’s digestion. A bullish pause. Traders are clearly eyeing the next move, and so far, the chart looks like it’s winding up for another push.
Support at $112,000 has held cleanly, and the 50-day moving average is trending steadily upward, now comfortably below price – a textbook sign of bullish structure. If $123K breaks, it could set off a new leg higher, potentially triggering another wave of FOMO. But even a drop back to $112K would keep the uptrend intact, with secondary support around $105K offering a strong safety net.
Volume tells the story too. It surged during the breakout and has since tapered off, which is exactly what you’d expect during a calm consolidation. In short: BTC looks healthy, poised, and still in charge. The next big move could be just around the corner – and right now, the bulls have the edge.

Total to 5T & BTC to...?Morning fellas,
No way BTC is stopping here. People are gonna get reckt shorting, and are not gonna believe where this price action is gonna stop.
TOTAL must reach anywhere between 4.5T & 5T, this spread across all Alts.
It has been a long time coming, and the party hasnt even started yet.
Hold your horses and trade thirsty, my friends!

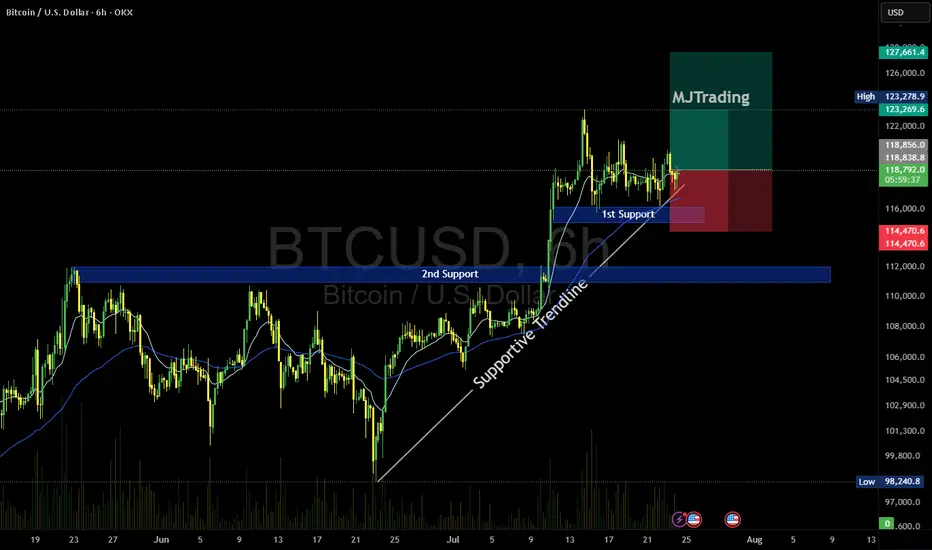
BTC/USD Buy Setup (6H Chart)📈 BTC/USD Buy Setup (6H Chart)
Strategy: Trendline Support Bounce
🔹 Entry
Price: $118,674.3
Reason: Price is bouncing off a supportive trendline and holding above the 1st Support zone.
🔻 Stop Loss (SL)
Price: $114,470.6
Reason: Below the 1st Support zone to protect against breakdown.
🎯 Take Profit Targets
TP1: $123,269.6
Reason: Near recent swing high, good for partial profit.
TP2: $127,661.4
Reason: Next resistance zone, ideal for full exit or trailing stop.
#MJTrading
#Bitcoin
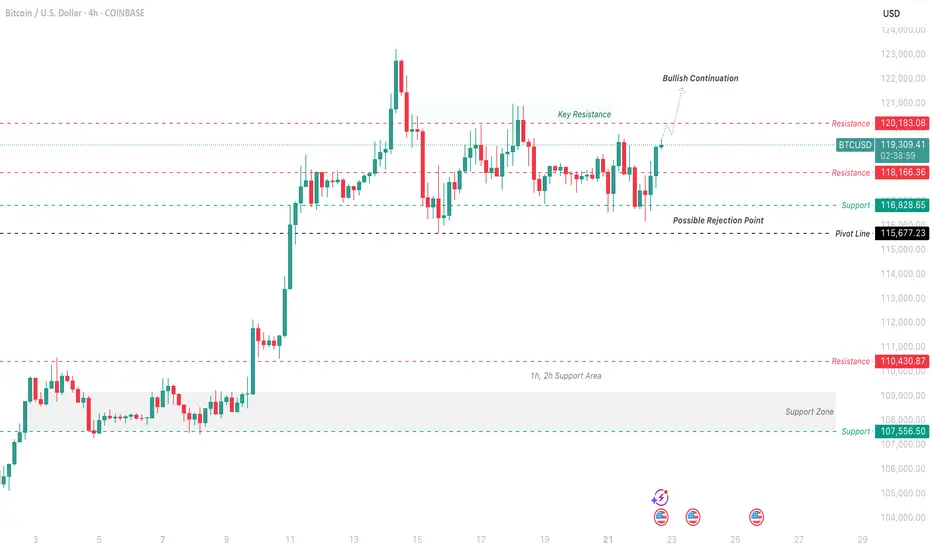
Bitcoin Price Analysis and Bullish Continuation PredictionThis analysis focuses on the Bitcoin/US Dollar 4-hour chart from Coinbase, highlighting a potential bullish continuation based on recent price action as of July 22, 2025. The chart shows a strong upward trend with a recent pullback, suggesting a possible rejection point near the pivot line at $115,672.23.
Putting myself in the reader’s shoes, I’d want to understand the key levels driving this prediction. The 1-hour and 2-hour support area around $107,656.23 has held firm, providing a solid base. The price recently approached the key resistance at $120,183.08, where it faced rejection, indicating a potential ceiling. If the price breaks above this resistance with strong volume, it could signal a continuation toward $123,000.00 or higher.
My thought process involves identifying the pivot point ($115,672.23) as a critical level. A bounce from this level, supported by the 1h/2h support zone, suggests bullish momentum. However, if the price fails to hold above $115,672.23 and drops below $107,656.23, it could invalidate this outlook, pointing to a deeper correction.
Profit Targets:
Short-term: $120,183.08 (key resistance)
Long-term: $123,000.00 (bullish continuation)
Stop Loss: $107,656.23 (below the 1h/2h support area)
These clearly defined targets and stop loss levels should help clarify the trade idea and manage risk effectively.

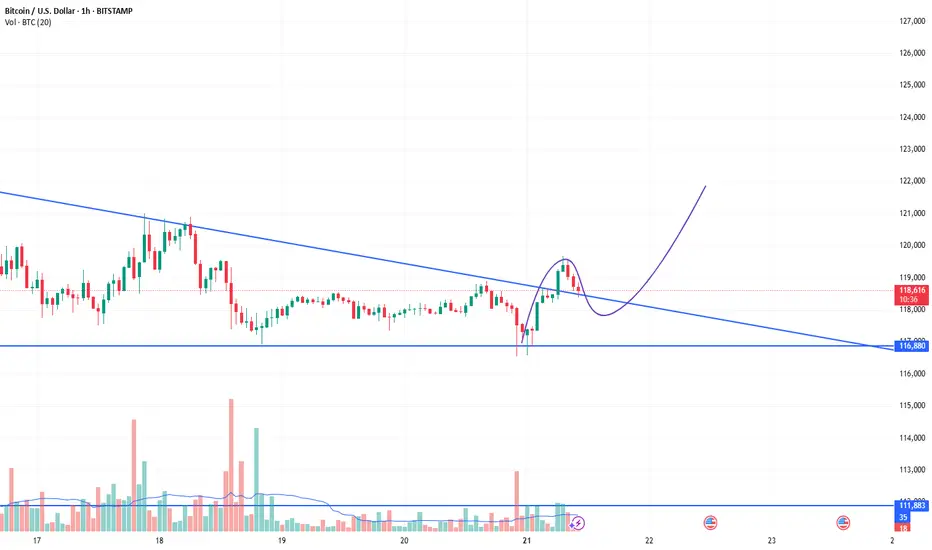
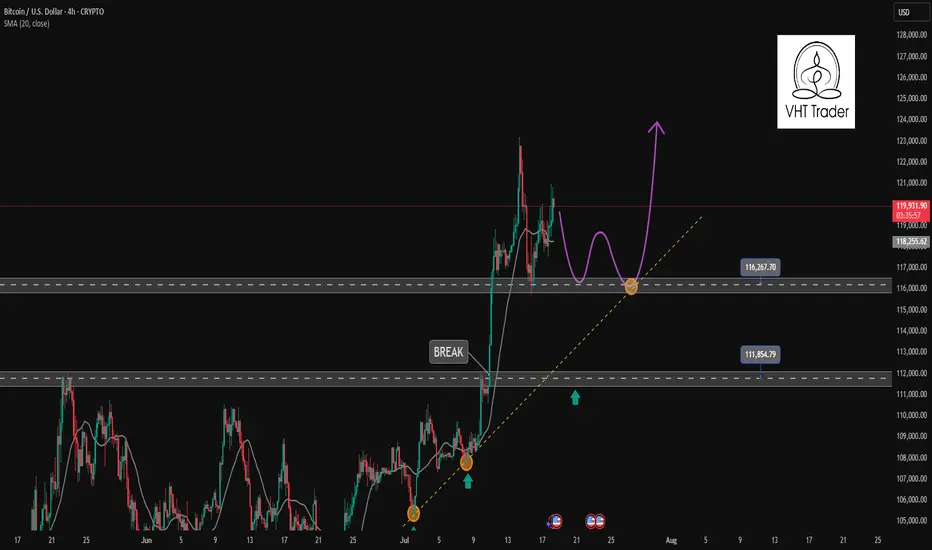
Find a recovery point to continue buying BTC✏️ CRYPTO:BTCUSD is trading near the all-time high. The trading strategy is to wait for some investors to take profit so that the price can return to the nearest support zones and continue to buy to the new all-time high zones.
📉 Key Levels
BUY Trigger: confirms the recovery from the support trend line 116000
BUY zone 112000 (Strong support zone)
Target 129000
Leave your comments on the idea. I am happy to read your views.
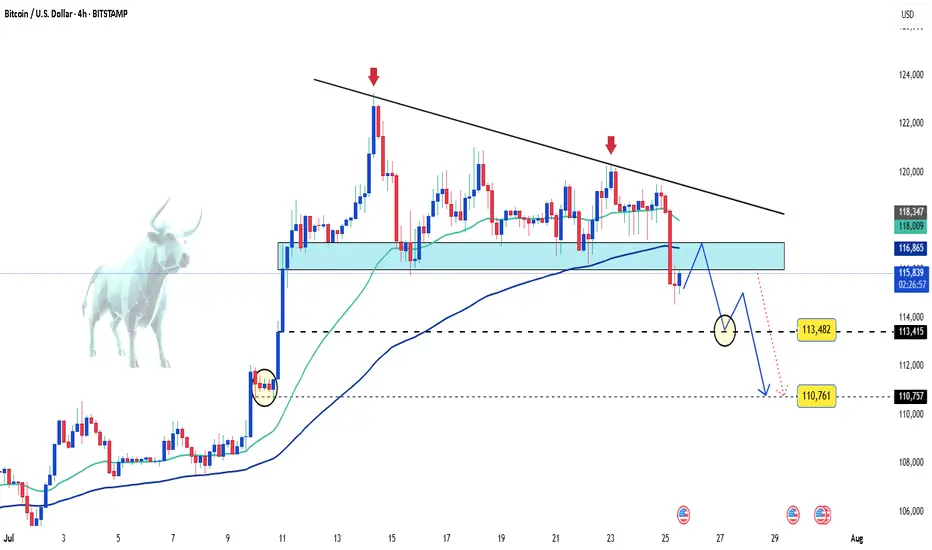
Bitcoin on the edge – Is a sharp drop coming?Bitcoin is keeping investors on edge as price action remains volatile and primed for an explosive move once news or capital flows ignite the market.
🌍 Latest market updates:
– Whales are back in accumulation mode, with on-chain data showing large wallets growing rapidly.
– The U.S. government has just transferred a significant amount of BTC to exchanges — is a dump coming?
– U.S. spot Bitcoin ETFs are witnessing record inflows after CPI came in lower than expected, fueling hopes that the Fed will pause further rate hikes this year.
📉 Technical outlook:
– On the H4 chart, BTC formed a tightening wedge pattern, which has now broken to the downside.
– A steep drop toward the 113,000 to 110,000 USD zone is entirely possible.
This looks like a classic break-retest setup — a golden window for strategic entries. If sell volume surges, it could be the perfect moment for bears to strike.
Stay sharp — and good luck!
Bitcoin BTC net -50 = mild bearish or neutral bias
Not strong enough alone to trade on — check price action, key levels, and other factors like ETF flows or macro news.
BTCUSD Technical Analysis | Smart Money Concept (SMC) BreakdownBTCUSD Technical Analysis | Smart Money Concept (SMC) Breakdown
🧠 Smart Money Market Structure Insight
📌 Key Elements Identified:
BOS (Break of Structure): Multiple BOS points indicate bullish intent early on. However, the latest BOS on July 14 followed by a significant drop signals a shift in momentum—possibly a distribution phase.
Liquidity Sweep: Price swept prior equal lows/liquidity before reversing, a typical Smart Money trap setup.
FVG (Fair Value Gap) / Imbalance: Identified around the mid-section of the chart—price filled partially but failed to hold, suggesting internal weakness.
Strong Support Zone (Demand Area): Marked between 115,000 - 114,640; this zone is anticipated to act as a springboard for bullish reversal.
📉 Current Price Action Observation:
BTCUSD is hovering around 118,152 - 118,560, moving sideways with lower highs indicating compression.
Price is projected to form a "W" pattern or double bottom in the shaded region.
Expected liquidity grab beneath 115,902 followed by potential bullish reaction targeting 121,562, as indicated by the white arrow.
🧩 Strategic Outlook & Potential Play:
🔻 Bearish Sweep First:
Market likely to sweep the support one more time, tapping into deeper liquidity pools between 115,000–114,640.
This is aligned with the concept of Smart Money hunting for retail stop-losses before reversing.
🔼 Bullish Recovery After Sweep:
Strong probability of bounce due to presence of:
Fair Value Gap (already tested),
Fresh demand zone,
Liquidity grab setup.
Projected Bullish Target: 121,562
Confirmation Needed: A strong bullish engulfing or BOS on lower timeframes near support.
🏷️ Conclusion:
This BTCUSD setup is a textbook Smart Money scenario: BOS ➝ Liquidity Grab ➝ FVG ➝ Reversal from Demand. Traders should wait for confirmation from the support region before entering long positions.

BSTI Triggered Buy SignalThe Bitcoin Swing Trade Indicator triggered a buy signal. None of the individual indicators have triggered a bottom, but the overall "risk" is below the trigger line.
Note: I know it is unfair to publish this idea when the BSTI isn't available to y'all, but what are you gonna do? It isn't quite ready for prime time, but I wanted to make y'all aware of the signal.

BTCUSD--SHORT--26_07_25--breaking orange trendline
--pullback and retest trendline between levels 119597,117411
--move down towards descending channel through 111658

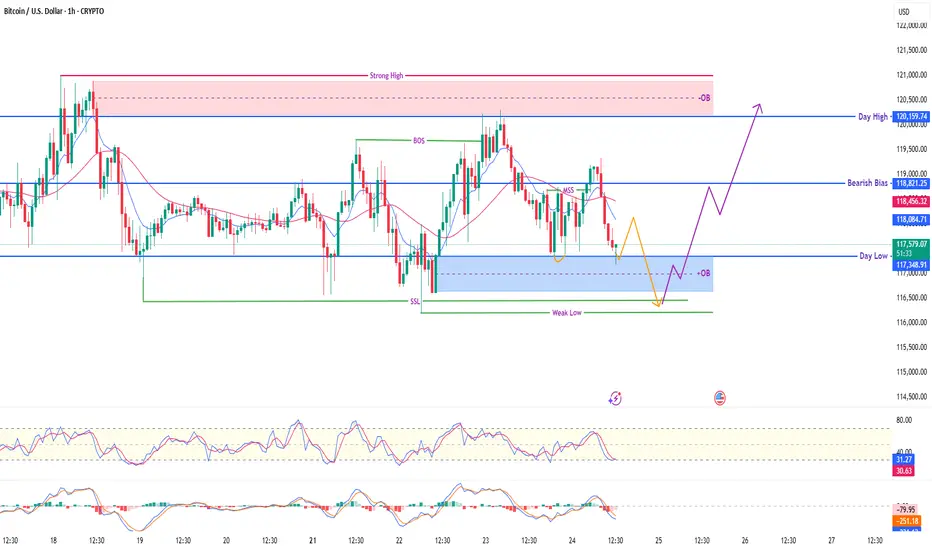
BTC/USD (1H) – Smart Money OutlookCurrent price testing a strong OB zone + Day Low support ($117,300–$117,400) after clean MSS and minor BOS. Structure signals liquidity manipulation and SMC play setting up.
🔍 Key Scenarios:
🟣 Bullish Reversal Case:
Bullish reaction from OB zone → long confirmation
Targets:
TP1: $118,800 (Bearish Bias)
TP2: $120,150 (Day High Liquidity Zone)
🟠 Bearish Continuation Case:
Weak Low + SSL gets swept
Price moves toward deeper POI zone ($116,300–$116,500)
Look for reversal confirmation from there.
📌 Confluences:
Clear OB zone with previous support reaction
SSL liquidity below current level
RSI near oversold
MACD showing early bearish momentum slowing
📚 Bias: Neutral to Bullish – Watching OB reaction for confirmation.
⚠️ Disclaimer: For educational purposes only. Always manage risk smartly.
BTCUSD has Breakout from major resistance of 110 K and now takinBTCUSD has Breakout from major resistance of 110 K and now taking pause by consolidation

BTC Bulls Defend Key Zone Eyes on $123K Breakout ExtensionBitcoin has successfully completed a breakout above the prior weekly high structure, followed by a healthy pullback which is currently unfolding into a bullish pennant formation. The key highlight is how price is retesting the neckline zone with precision, which now doubles as a strong immediate buyback zone.
The reaction from this level is already showing strong bullish momentum, with price gearing up to challenge the previous ATH. A breakout above that resistance should unlock the path toward the projected $116.5k and $123.4k targets as shown on the chart. Failure to hold the Immediate Buyback Zone opens the door toward the Strong Demand Zone, which remains a valid re-accumulation point within this bullish cycle.
Stay sharp. The structure remains intact unless the neckline fails decisively.

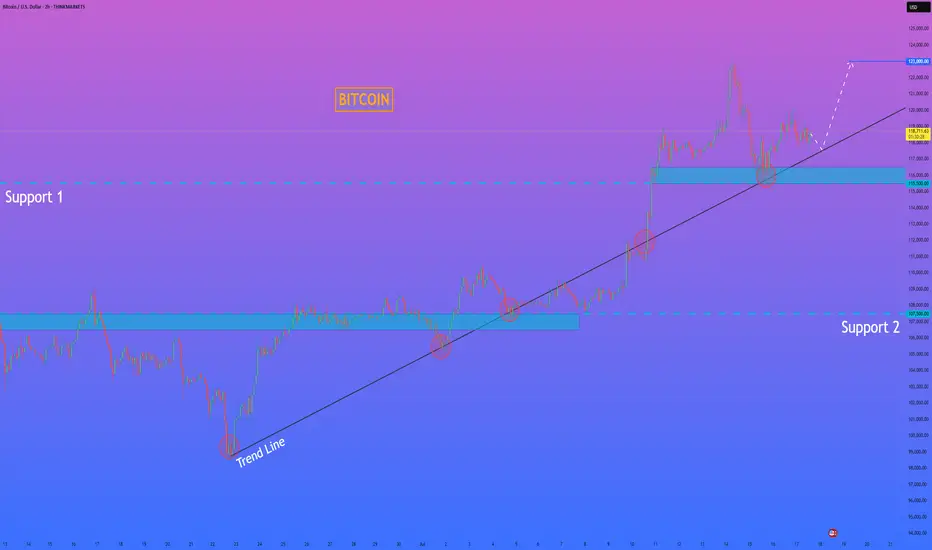
HelenP. I Bitcoin will correct to trend line and then start riseHi folks today I'm prepared for you Bitcoin analytics. The price has been trading in a strong bullish structure, clearly respecting the ascending trend line since the rebound from the 107500 level. Each time the price touched the trend line, it formed a higher low and continued the upward movement. After breaking through the important Support 1 zone (115500–116500), BTC made a strong impulse upward and reached a local high above 122000 points. Currently, the price is making a pullback and moving closer to the trend line again. This area has previously acted as a major point of interest for buyers, and now it's expected to play a key role once more. The support zone and trend line are converging, which makes this level critical for the next move. I believe BTCUSD will bounce from this area and continue its bullish momentum. My goal is set at 123000 points. Given the market structure, higher lows, and strong reaction from the support zones, I remain bullish and expect further growth from current levels. If you like my analytics you may support me with your like/comment ❤️
Disclaimer: As part of ThinkMarkets’ Influencer Program, I am sponsored to share and publish their charts in my analysis.
BTCUSD BUBBLE ABOUT TO BURST LOL ??? SELL SELL SELLLong term BTCUSD looks like BIG PLAYERS ARE TAKING PROFIT (about to dump this to retailers lol)
I see 15m signal sell with very good risk reward
BTCUSD its ready for correction i dont beleave we will see any NEW HIGHS from here
Let see how will pay out, only time will tell
Thanks

BTCUSD has boken up Trendline and SupportBTCUSD has boken up Trendline and Support, It may retrace futhur before regaining bullishness.

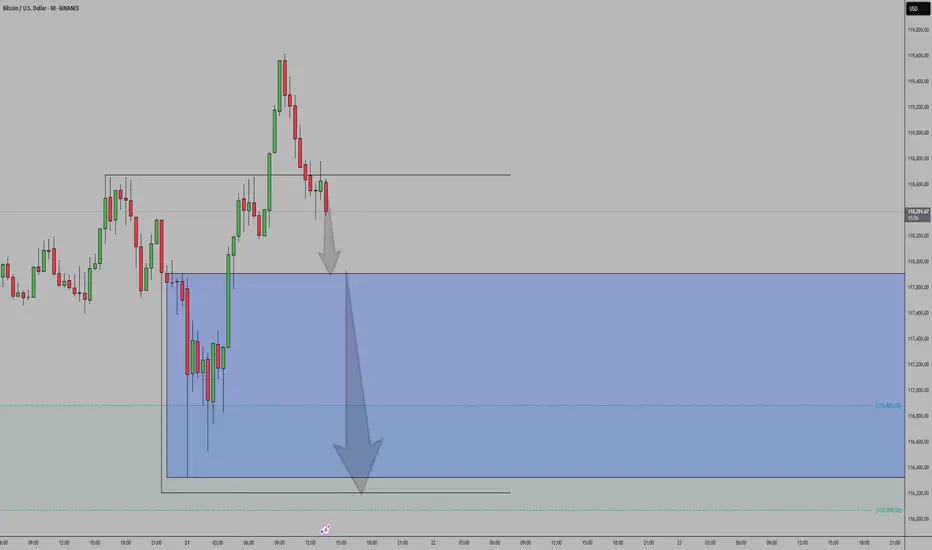
BTC/USD – 4H Technical and Fundamental AnalysisBTC/USD – 4H Technical and Fundamental Analysis
BTC/USD saw sharp downside pressure today, driven by a wave of long position liquidations—exceeding $800 million across the crypto market in the past 24 hours. The sudden shift triggered panic selling, dragging Bitcoin below its psychological and technical support near $116,000. Broader crypto market sentiment turned risk-off as large investors reduced exposure, accelerating the sell-off.
Fundamentally, the market remains cautious amid a lack of positive macroeconomic catalysts for risk assets. Speculation about stricter U.S. regulatory oversight and declining inflows into crypto ETFs also dampened sentiment. Combined with hawkish remarks from Fed officials, which keep interest rates elevated, appetite for high-risk assets like Bitcoin weakened further.
From a technical perspective, BTC/USD broke below the major support level of $116,000, confirming bearish pressure. This breakdown followed a period of consolidation, with price failing to maintain bullish momentum. A liquidity hunt appears to be underway, with price revisiting the zone to trap breakout traders before resuming its move.
We are now watching for a confirmed 4H candle close below the liquidity zone. Once confirmed, a short setup is validated, with targets aligned with the next key support zone.
📍 Sell Setup
Entry: Sell Limit at 115,980.00
Stop Loss: 117,985.00
Take Profit: 111,940.00
📌 Disclaimer:
This is not financial advice. Always wait for proper confirmation before executing trades. Manage risk wisely and trade what you see—not what you feel.

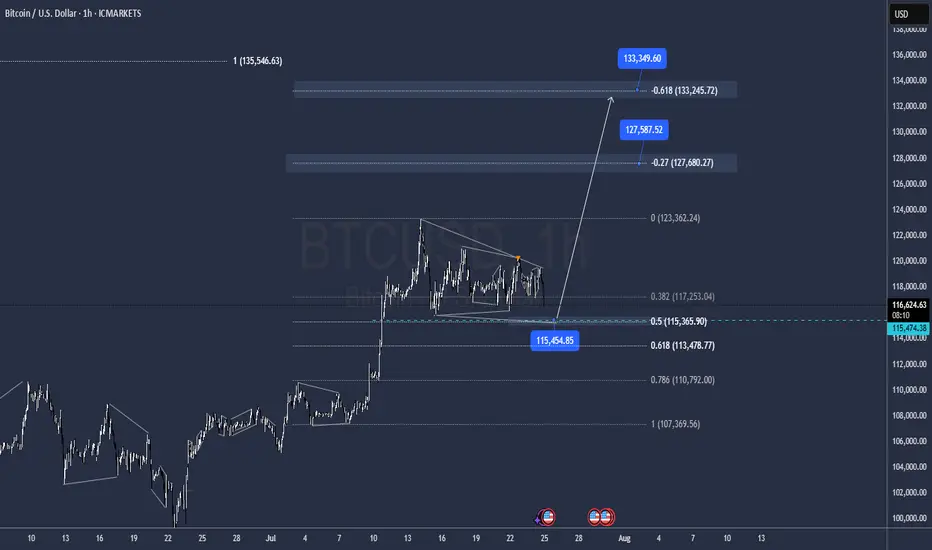
BTC Correction may be overOn a new look to the structure with the lat moves, it has the Potential to be over after tapping 115.500 and go for new Highs @ 127.500 / 133.000 as all internal impulses seeems to be matched.
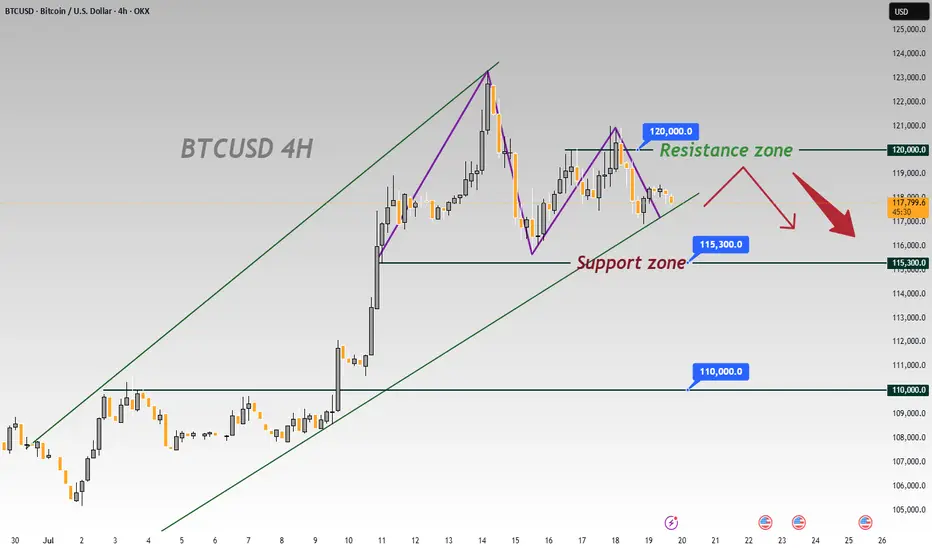
BTCUSD 4-Hour Chart Analysis: Range-Bound Trends & Key LevelsFrom the 4-hour chart of BTCUSD, the recent price movement shows obvious range-bound characteristics 📊. The upper zone around 120000 forms a key resistance level 🛑, where the bullish momentum has waned after encountering resistance 💨.
The lower level of 115300 is a significant support zone 🛡️. Previously, there was some buying support when the price retraced to this zone 👀. However, as the current price is pulling back from the resistance zone ↘️, if the bearish force takes the lead subsequently 🐻, the possibility of breaking below the 115300 support will increase ⬆️. Once it breaks below effectively 💥, the next key support level of 110000 will most likely become the target for the price to decline towards 🎯.
In terms of the short-term trend 📈, due to the obvious suppression from the resistance zone 🚧, the price will most likely continue the rhythm of testing the support downwards 🔽. In operation, one can pay attention to the breakdown situation of the support zone and layout trades accordingly 📝. Meanwhile, be alert to the possibility of a rebound after the price finds support in the support zone 🚀, and further confirmation of the direction needs to be combined with real-time K-line patterns 📊, trading volume 📈
🚀 Sell @119500 - 118500
🚀 TP 116500 - 115500
Accurate signals are updated every day 📈 If you encounter any problems during trading, these signals can serve as your reliable guide 🧭 Feel free to refer to them! I sincerely hope they'll be of great help to you 🌟 👇