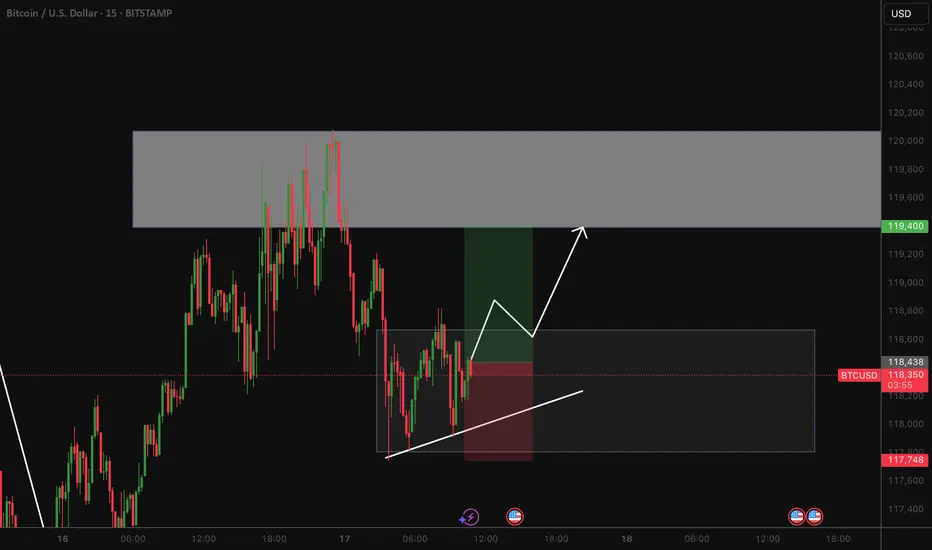
Bitcoin Breaks Out – The Final Test Has Begun 🚀🔥 Bitcoin Breaks Out – The Final Test Has Begun 💥📈
Boom! The breakout is here. After days of grinding under resistance, BTC has finally burst out of the channel — and all eyes are now on the monster level at $114,900.
📊 We spoke about this level again and again — the third macro test, the “HUGE-est Level EVER,” the battleground between Ultimate FOMO and End of Cycle.
⚠️ This breakout could lead to:
✔️ Acceleration to retest 114,900
✔️ A potential 3rd attempt to break the golden structure
✔️ Euphoria or exhaustion — no middle ground
🧠 Smart traders will remember:
– 8+ divergences still exist on higher timeframes
– The risk of failed breakout traps is high
– But this is what we’ve been waiting for: confirmation + continuation
🎯 If momentum holds, we may be on our way to test the upper macro structure. This is not the time to hesitate — it’s time to manage risk like a pro and track the flow.
💡 Catch up on the setup:
👉 Where Can Bitcoin Go? Part 8
👉 July 10th Market Outlook – Uncharted Waters
🗣️ It’s not about prediction — it’s about preparation.
We were ready. Are you?
One Love,
The FXPROFESSOR 💙
Disclosure: I am happy to be part of the Trade Nation's Influencer program and receive a monthly fee for using their TradingView charts in my analysis. Awesome broker, where the trader really comes first! 🌟🤝📈
BTCUSD.P trade ideas

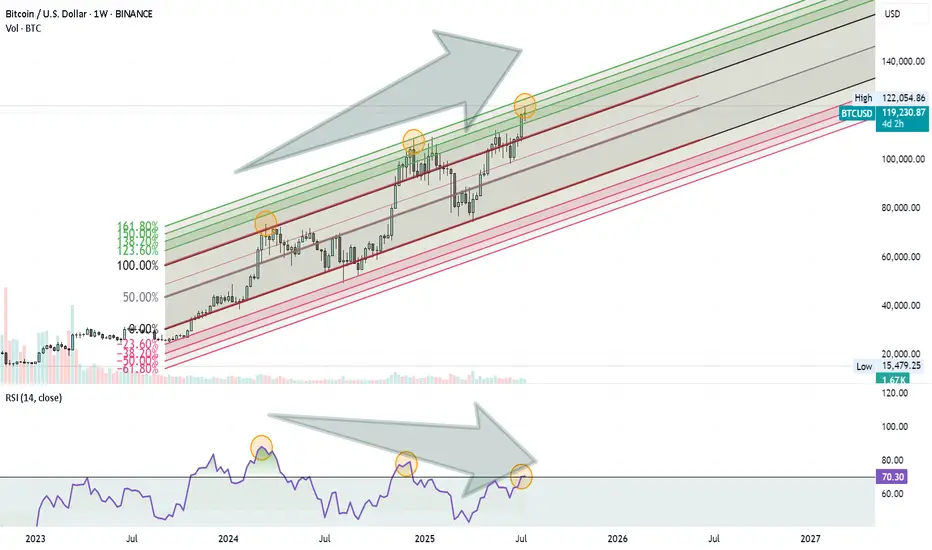
Bitcoin Rally Losing Steam?Bitcoin might be approaching a Turning Point . Here’s what I’m seeing on the weekly chart:
Price is moving inside an ascending Fibonacci channel.
It’s getting close to the 1.60 (160%) extension level, which has acted as a reversal zone before.
At the same time, the RSI is showing a clear negative divergence, suggesting that momentum is weakening.
These signs combined could mean we’re not far from a significant correction.
Nothing is confirmed yet, but it’s a setup worth keeping an eye on.
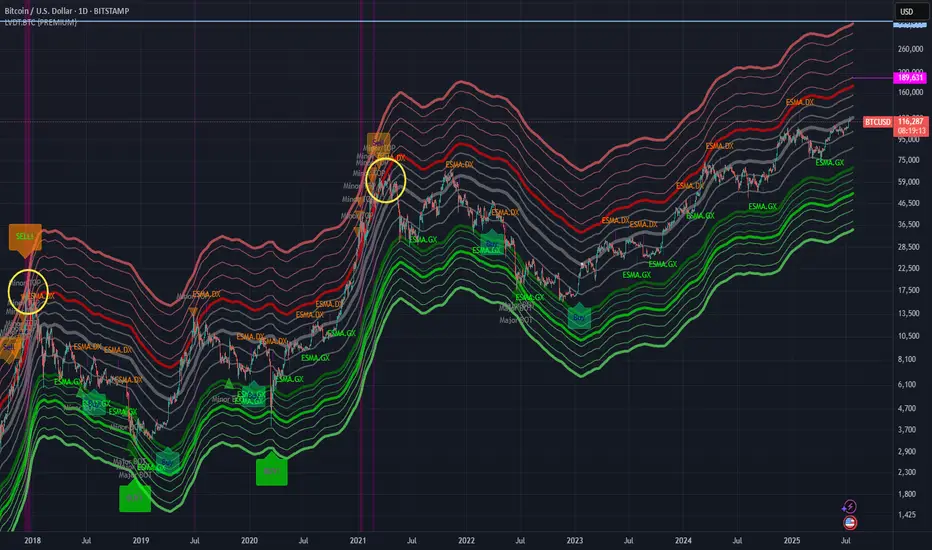
$300k+: LVDT estimated BTC ATH target this cycle.According to my old LVDT indicator, BTC should reach $300k or even higher at ATH this cycle.
The real parabolic (banana zone) run will only start when BTC touches the thick red line again.
Time to gradually DCA sell every time BTC pierces significantly above the thick red line (signaling a potential point of Blow-off-Top).
I plan to be updating this tread from time to time as the chart progresses until the absolute "Sell" signal is triggered.
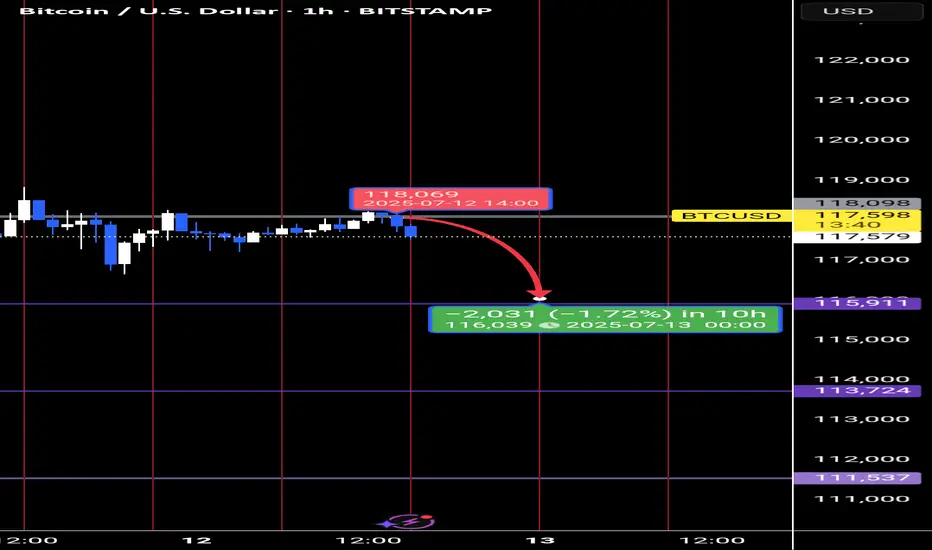
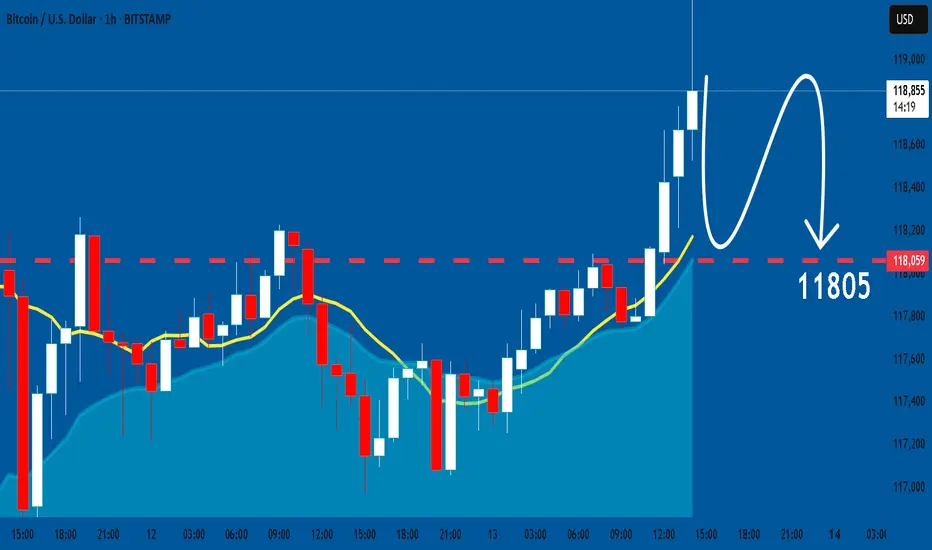
bitcoin will go down for the next 8hrs After sweep the liquidity above 118098. the price goes down for the correction . I expect it will reach the one hr order block at 115911.
Entry : 118098- 117500
St : 118200
tp: 116000
Bitcoin Price Prediction and TimelineThe Chart clearly shows everything. 100 days remain until the top. about 240000-260000

Bitcoin Hits First Target: What I Traded and What Comes NextBitcoin just hit my first target. I went long on BTC, XRP, Chainlink, and more. Booked profits and jumped into two new breakouts with better risk-reward. In this video, I break down my trades, the setup, and why I’m still bullish between 116K and 120K. I also explain how crypto deregulation and the Genius Act could fuel the next move.
Let me know in the comments how you traded this breakout.
This content is not directed to residents of the EU or UK. Any opinions, news, research, analyses, prices or other information contained on this website is provided as general market commentary and does not constitute investment advice. ThinkMarkets will not accept liability for any loss or damage including, without limitation, to any loss of profit which may arise directly or indirectly from use of or reliance on such information.

TARGET FOR BTC BUYERS OR LONGERSHELLO.
this is my targets for my btc buy in spot and my longs
hope you will find this helpfull
in the ATH we can only trade based on the fibo extentions
tell me if u need me to clear it more
thank you.

$BTC Rejection at 119K | Eyes on 112K Retest as RSI Cools DownBitcoin faces strong rejection near the $119K resistance zone, showing signs of a cooling market as the RSI exits the overbought territory. Historically, BTC tends to revisit key structural levels after such overheated moves. A favorable re-test zone lies between $114K and $112K, with $112K aligning closely with the previous all-time high — a psychologically significant support area.
Support levels to watch: $112K (favorable retest) and $110K (strong base).
As RSI continues to cool, keep an eye on bullish reactions around these levels for potential entries.
BTCUSD – Potential Head & Shoulders Forming⚠️If and only if the price break below $115,000
⚠️ BTCUSD – Potential Head & Shoulders Forming
Pair: BTC/USD
Timeframe: 4H
Pattern in Focus: Head and Shoulders
Key Neckline: ~$115,000
Confirmation Trigger: Only valid if price breaks below the neckline zone with strong volume
🧠 Idea Summary:
Bitcoin has formed what appears to be a classic head and shoulders pattern. The right shoulder is completing, and the neckline is clearly respected. A break below $115K could confirm this bearish setup, with a measured move pointing toward the demand zone between $108K–$109K.
📌 Watch for:
Volume spike on breakdown
Retest of neckline turning into resistance
Potential long setups only if price reclaims $119K+
Bias: Bearish if $115K breaks. Neutral until then.

Bitcoin -> The bullrun is not over!📣Bitcoin ( CRYPTO:BTCUSD ) is still totally bullish:
🔎Analysis summary:
A couple of months ago Bitcoin broke above the previous all time high. This was basically just the expected creation of new highs, perfectly following the underlying cycles. With respect to the long term rising channel formation, this bullrun on Bitcoin is just starting.
📝Levels to watch:
$100.000
🙏🏻#LONGTERMVISION
Philip - Swing Trader

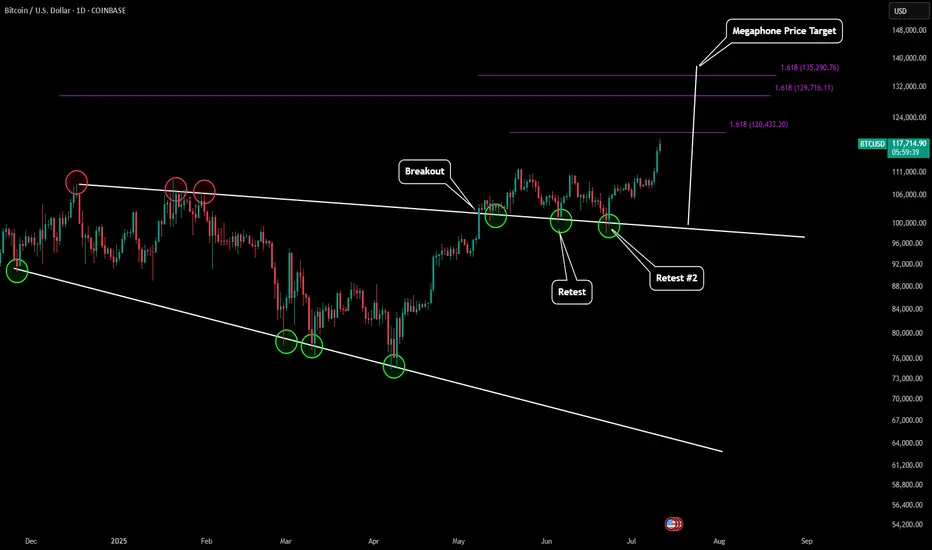
BTC - Next ATH Upside Price Targets After outlining the last low for BTC (which can be found here):
Now BTC is skyrocketing to new all time highs. Based on predictive Fibonacci modeling and also our price target of our macro megaphone pattern we can estimate where BTC's next top might be.
Our first target is just slightly above $120k. This would be our extension target of our most recent LFT trend.
If we take a look back at our last mid-macro trend it would give us an extension target slightly below $130k.
Our final target would be $135-136k which would be from our last high to our last low of our mid-macro trend. This is also in alignment with the full measured move of our megaphone pattern.
As more candle structure form around these levels we will update this prediction with even more precise targets. Happy All Time High everyone!
BTCUSD - GOOD SUPPORT ESTABLISHED?BTCUSD - GOOD SUPPORT ESTABLISHED?📈
Yesterday, after a record-breaking nine-hour House session, U.S. lawmakers passed three major crypto bills: CLARITY Act (294-134), which establishes a market structure for cryptocurrencies, GENIUS Act (308-122) that supports U.S. stablecoin innovation and an Anti-CBDC Surveillance State Act (219-210) that opposes central bank digital currencies. All of this supports crypto and especially Bitcoin.
Technically, BTCUSD looks bullish also, establishing a new bullish trend. I expect the ATH at 123,190.30 will be rewritten soon. Where will be the next stop, I've got no idea. To my mind, the best strategy here will be to buy on trend support, then transfer the stop loss at your entry point and sell o local hikes.
Stay tuned for the next report! 🔔

Bitcoin: Short term tradeHello,
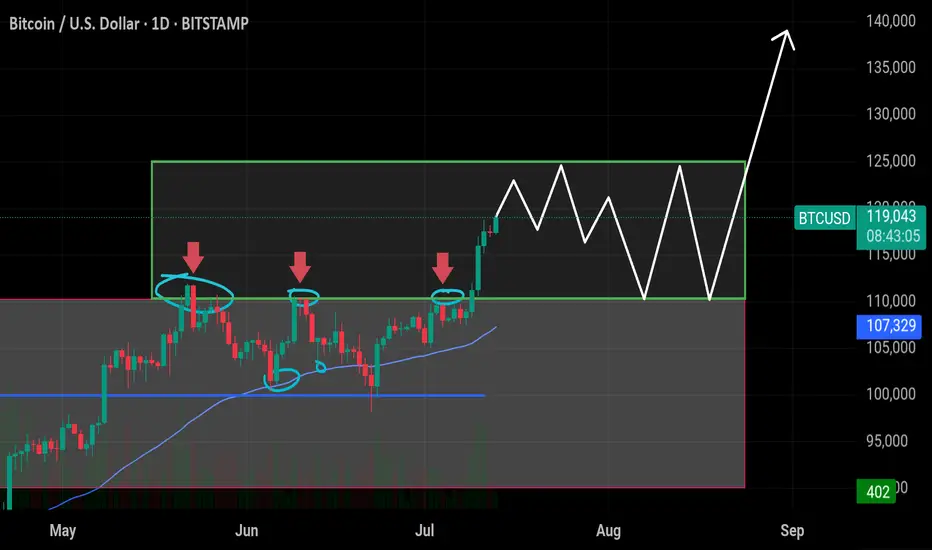
Cryptocurrencies, particularly major coins like Bitcoin, have experienced a volatile yet exhilarating rally in July 2025, reaching unprecedented all-time highs. This surge has attracted significant attention, drawing in new investors driven by fear of missing out (FOMO) and heightened market enthusiasm. While Bitcoin’s long-term potential remains robust, our analysis suggests a near-term correction is likely.
From a technical perspective, Bitcoin is currently undergoing a corrective phase as early investors capitalize on recent gains by taking profits. Chart patterns indicate the formation of a bullish flag, a continuation pattern that often precedes further upside after a consolidation period. We recommend that investors exercise patience and wait for the correction to fully develop. Optimal buying opportunities are anticipated around the $113,000 level, with a short-term price target of $130,000.
A key technical indicator, the Moving Average Convergence Divergence (MACD), is approaching a zero-line crossover, which could serve as a strong catalyst to confirm the resumption of Bitcoin’s upward momentum. We remain bullish on Bitcoin, maintaining an overweight position in our portfolio with a short-term target of $132,000.
Disclosure: I am part of Trade Nation's Influencer program and receive a monthly fee for using their TradingView charts in my analysis.
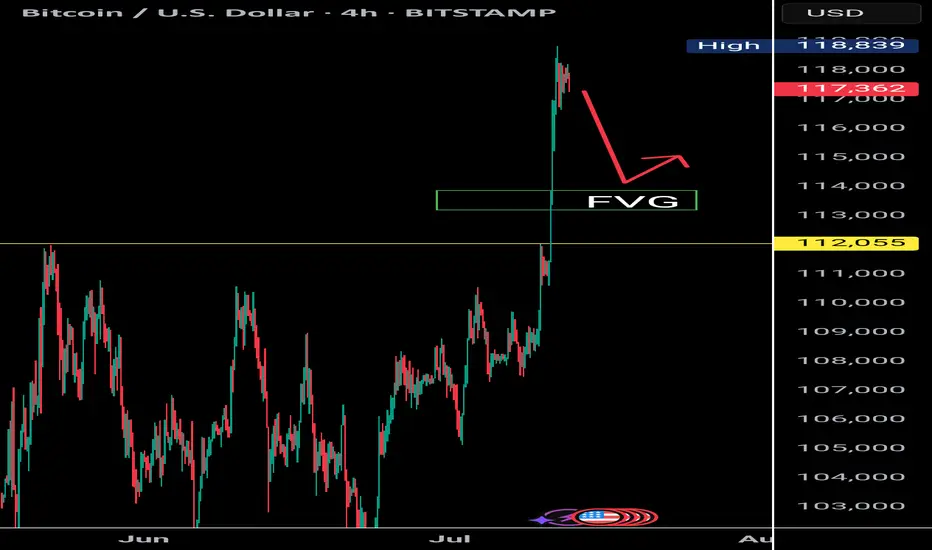
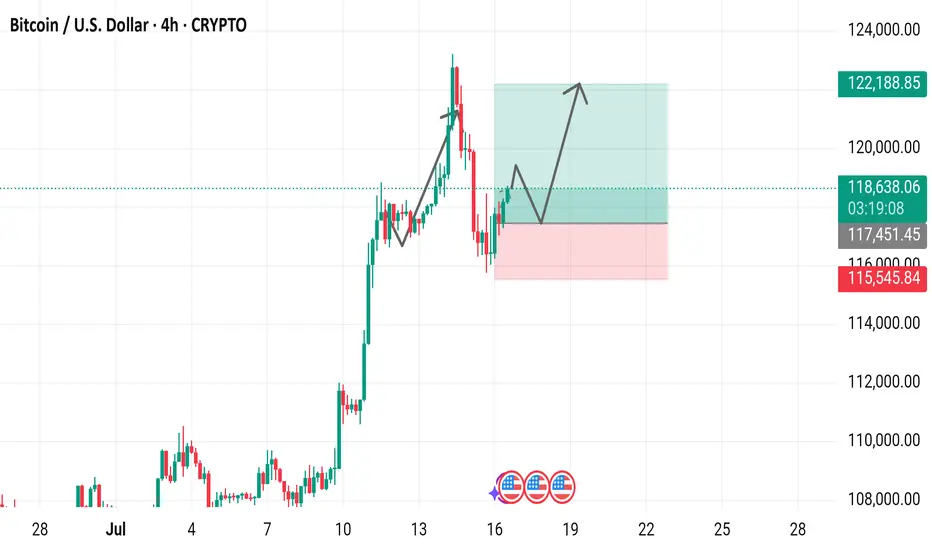
Bitcoin / U.S. Dollar 4-Hour Chart (July 2025)4-hour price movement of Bitcoin (BTC) against the U.S. Dollar (USD). The price has risen from 118,714.64 to 118,714.64 (+937.9 or +0.80%) over the period. Key levels include a support zone around 115,451.45 to 117,451.45 and a resistance zone near 120,000.00 to 122,188.85,
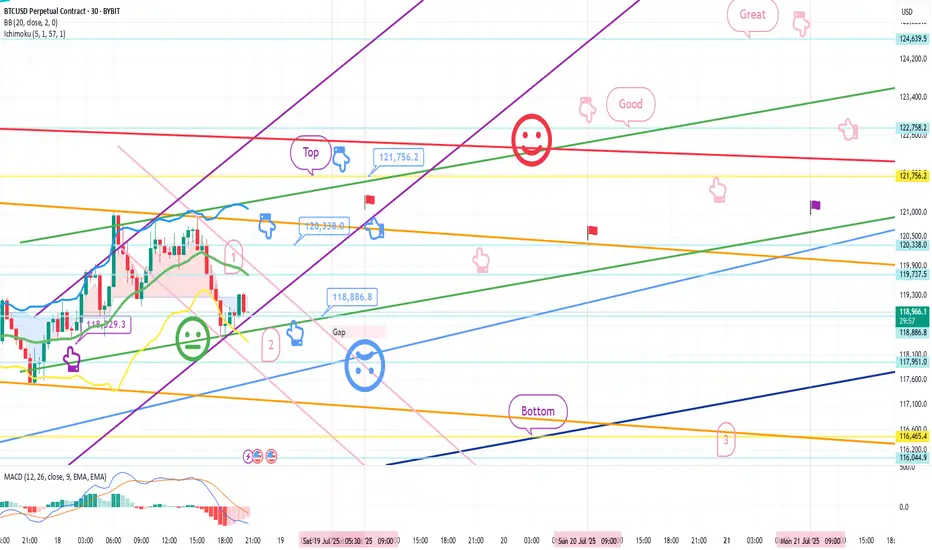
July 18 Bitcoin Bybit chart analysisHello
It's a Bitcoin Guide.
If you "follow"
You can receive real-time movement paths and comment notifications on major sections.
If my analysis was helpful,
Please click the booster button at the bottom.
Bitcoin 30-minute chart.
There is no Nasdaq indicator announcement today.
The mid-term pattern was broken in the morning wave,
but I proceeded as safely as possible.
At the bottom left, I connected the final long position switching section in the analysis article on the 15th with a purple finger.
*When the blue finger moves,
Bidirectional neutral
Short->Long or long waiting strategy
1. Short position entry section of $120,338 / Stop loss price when orange resistance line is broken
2. Long position switching of $118,886.8 / Stop loss price when blue support line is broken
3. Long position 1st target of $121,756.2 -> Target price in the order of Good and Great
If it falls immediately from the current position or
touches the top once and falls, it is a vertical decline condition.
If it falls immediately, it is the final long waiting in section 2.
(When the sky blue support line breaks, the stop loss price is the same)
From the sky blue support line break, the 6+12 section is where the mid-term pattern is restored,
and it is roughly the bottom section.
If the strategy is successful, I have left a simulation with a pink finger on the right,
so please check the switching and profit-taking section,
and operate safely in each position, long, short, and no position, based on whether the purple support line breaks from the current position.
From the green support line break, the low point of today's daily candle is broken,
so it would not be good for a long position, right?
Up to this point, please use my analysis article only for reference and use,
and operate safely with principle trading and stop loss price.
Thank you.
BTC - HYPERBOLIC FINISH This box here where we right shit in, what it really worth? You will never understand technical analysis if you think reading words in a little box mean something. BTC , next top mid frame with a throw over of center to $164,000. Then consolidation around the core to $138,000, then the hyperbolic finish to $187,500+. Nuf said. Good luck. Volatility will be high, but mainly move in one direction. Murrey Math, ( Which trading view wont let me display because its an unpublished indicator , Elliott Wave, Kumar Wave being used for this forecast.

BTCUSD: Bearish Continuation
The charts are full of distraction, disturbance and are a graveyard of fear and greed which shall not cloud our judgement on the current state of affairs in the BTCUSD pair price action which suggests a high likelihood of a coming move down.
Disclosure: I am part of Trade Nation's Influencer program and receive a monthly fee for using their TradingView charts in my analysis.
❤️ Please, support our work with like & comment! ❤️
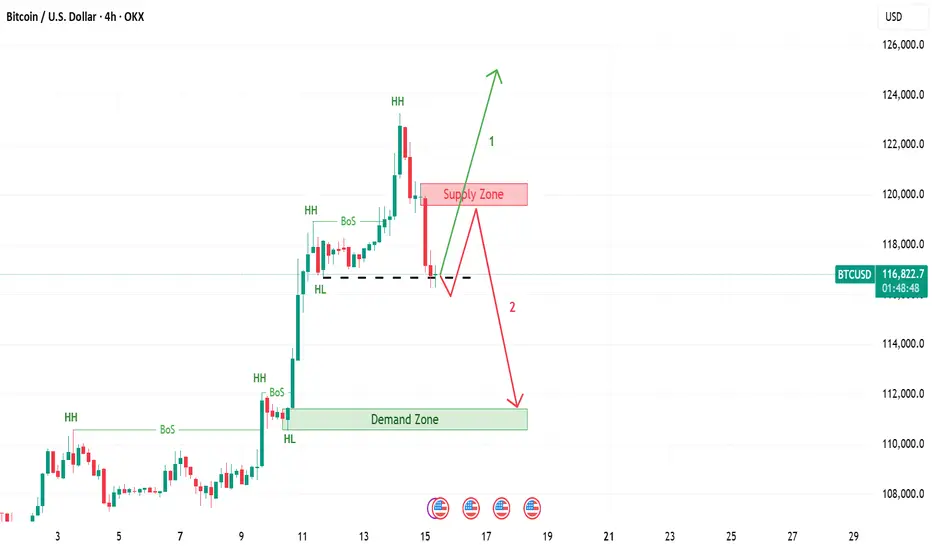
Bitcoin | 2 Scenarios If the 4 hour candle closes below last HL, then expect price return to supply zone and then go down till demand zone. If not, expect continuation of the upward trend, when 4 hour candle breaks last HH.
Which scenario you expect?
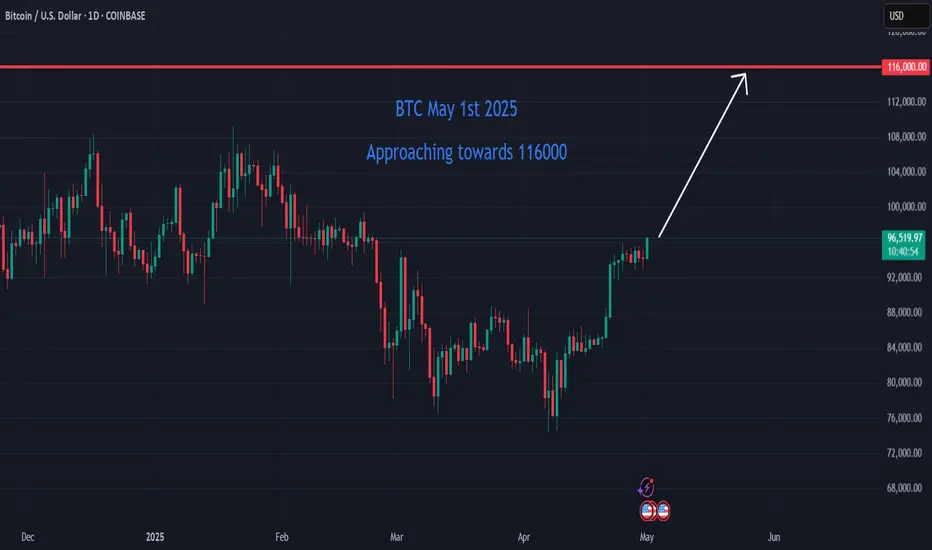
Bitcoin on the Brink: Short-Term Surge Toward $116K Bitcoin (BTC) is currently trading at approximately $96,390, approaching the $116,000 mark. Here's a short-term analysis using Cycle Analysis, Elliott Wave Theory, and Gann Analysis to inform potential trading strategies.
________________________________________
📈 Cycle Analysis: Mid-2025 Surge
Historical patterns suggest that Bitcoin tends to reach its peak between 518 and 546 days after a halving event. Given the most recent halving in April 2024, analysts anticipate a potential price peak around mid-2025, approximately 1.5 years post-halving. Notably, Bitcoin is currently about 35 days ahead of its typical cycle, indicating a possible acceleration in price growth.
________________________________________
📊 Elliott Wave Analysis: Wave 3 in Progress
Elliott Wave Theory suggests that Bitcoin is currently in the third wave of its bullish cycle, which is typically the most powerful and extended wave. Recent analyses indicate that the third wave is unfolding, with potential targets ranging from $114,500 to $120,500. A conservative estimate places the peak of this wave between $127,000 and $150,000
________________________________________
📐 Gann Analysis: Price-Time Equilibrium
Gann Analysis utilizes geometric angles to predict price movements. The "2×1 Fan" line, representing a 45-degree angle, is considered a fair value line. Historically, Bitcoin's price has peaked near this line during parabolic run-ups. Currently, Bitcoin's price is approaching this level, suggesting a potential peak.
________________________________________
🧭 Short-Term Trade Setup
✅ Entry Points:
• Accumulation Zone: $85,000 to $90,000
• Current Price: $96,390
🎯 Target Levels:
• Short-Term Peak: $116,000 to $135,000
• Medium-Term Peak: $150,000
⚠️ Risk Management:
• Potential Correction: After reaching the peak, anticipate a significant pullback, possibly 30–50%.
• Exit Strategy: Consider taking profits as Bitcoin approaches upper resistance zones.
________________________________________
🧾 Conclusion
Bitcoin is in the final stages of its current bullish cycle, with projections indicating a potential peak between $150,000 and $278,000. However, caution is warranted as market corrections are typical following such surges. Investors should consider taking profits as Bitcoin approaches upper resistance levels and prepare for potential pullbacks.
$BTC Ready to Explode – Targeting $125K+ Soon! Bitcoin has finaCRYPTOCAP:BTC Ready to Explode – Targeting $125K+ Soon!
Bitcoin has finally broken out of the previous resistance range (~$110K–$111K), where it was rejected multiple times in June. Now it's consolidating in a tight box, setting up for a big move.
🔸 Support $110k–$113k
This area was previous resistance and is now acting as strong support. Holding above this confirms bullish strength.
🔸 Upside Target: $125k
If BTC holds within the current range and breaks above, the next leg could push price toward $125K. A clean breakout could even extend toward $140K.
🔸 Short-Term Take Profits:
✅ TP1: $120,000
✅ TP2: $122,000
✅ TP3: $125,000
🔸 Risk Level at $110,000:
Break below this level would invalidate the bullish setup and increase downside risk.
BTCUSD Scalp Longwe´ve just created a nice bottom formation. If we can breake through the Daily open end get a long confirmation, there is a high potential for a long scalp trade
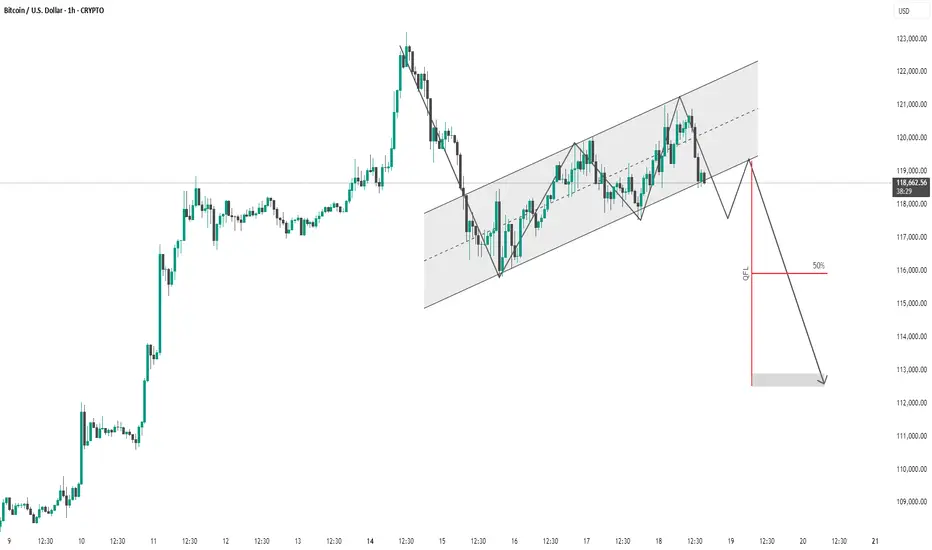
BTC #1-hour chart of Bitcoin (BTC/USD)This is a 1-hour chart of Bitcoin (BTC/USD) with a clear bearish outlook indicated by the analysis:
Key Observations:
Rising Channel:
Price has been moving inside an ascending channel.
Currently testing the lower boundary, suggesting potential for a breakdown.
Price Projection:
A sharp drop is anticipated after breaking the channel, supported by the downward black arrows.
The analyst anticipates a retest of the lower boundary followed by a rejection and continuation downward.
QFL Strategy Reference:
"QFL" (Quick Fingers Luc strategy) is marked with a red line, identifying a key support zone that price may break below.
50% level (retracement or zone midpoint) is noted for confluence.
Target Zone:
Final target appears to be in the $112,500 – $113,000 range.
Summary:
The chart presents a bearish thesis expecting BTC to break the ascending channel and fall toward a previous demand zone marked by the QFL level. The structure supports a short setup if the lower trendline fails to hold.
Risk Note: This is a speculative forecast; always confirm with volume, broader market context, or confirmation patterns.
thank u
BTC CUP and HANDLE?BTC made triple top not it is making cup and handle pattern. If it successfully brakes the handle it might reach to 120-122K
