Use Base-Anchored Fibonacci Retracement Formula🔹 Step 1: Base-Anchored Fibonacci Retracement Formula
🧮 Retracementₓ = Base + (Range × x)
Inputs:
• 🟢 Base = $74,458.42
• 🔴 High = $112,006.33
• 📏 Range = $112,006.33 − $74,458.42 = $37,547.91
📐 BTC Retracement Levels (Upward from Base)
1️⃣ Fib 0.236
= 74,458.42 + (37,547.91 × 0.236)
= 74,458.42 + 8,862.92
= $83,321.34
2️⃣ Fib 0.382
= 74,458.42 + (37,547.91 × 0.382)
= 74,458.42 + 14,362.66
= $88,821.08
3️⃣ Fib 0.500
= 74,458.42 + (37,547.91 × 0.500)
= 74,458.42 + 18,773.96
= $93,232.38
4️⃣ Fib 0.618
= 74,458.42 + (37,547.91 × 0.618)
= 74,458.42 + 23,285.25
= $97,643.67
5️⃣ Fib 0.786
= 74,458.42 + (37,547.91 × 0.786)
= 74,458.42 + 29,597.78
= $104,056.20
6️⃣ Fib 1.000
= 74,458.42 + 37,547.91
= $112,006.33
🚀 BTC Extension Levels (Beyond High)
📈 Extensionₓ = High + (Range × x)
1️⃣ Fib 1.618
= 112,006.33 + (37,547.91 × 0.618)
= 112,006.33 + 23,285.25
= $135,291.58
2️⃣ Fib 2.618
= 112,006.33 + (37,547.91 × 1.618)
= 112,006.33 + 60,767.17
= $172,773.50
3️⃣ Fib 3.618
= 112,006.33 + (37,547.91 × 2.618)
= 112,006.33 + 98,249.08
= $210,255.41
📊 Final BTC Levels
🎯 Target 🧭 Fib Level 💰 Price
TP1 0.236 $83,321.34
TP2 0.382 $88,821.08
TP3 0.500 $93,232.38
TP4 (High) 1.000 $112,006.33
TP5 1.618 $135,291.58
EXT2 2.618 $172,773.50
EXT3 3.618 $210,255.41
BTCUSD.P trade ideas
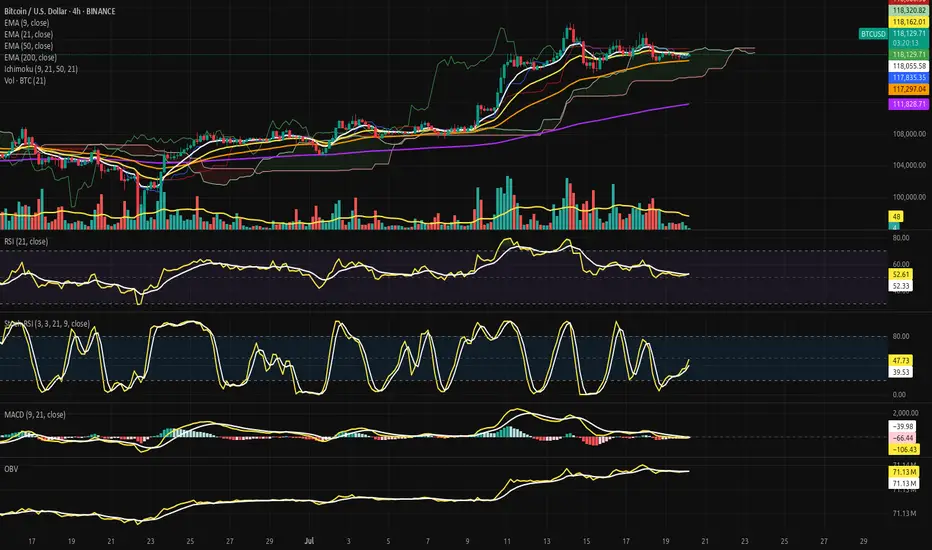
Bitcoin Suspended Beneath the Ichimoku Silence.⊢
⨀ BTC/USD - BINANCE - (CHART: 4H) - (July 20, 2025).
◇ Analysis Price: $117,919.29.
⊣
⨀ I. Temporal Axis - Strategic Interval - (4H):
▦ EMA9 - (Exponential Moving Average - 9 Close):
∴ Price is currently hovering just below the EMA9 at $118,035.43, showing weakening immediate momentum;
∴ EMA9 is now flat-to-downsloping, indicating short-term loss of control from intraday bulls;
∴ Recent candles have failed to reclaim closes above EMA9, reflecting micro-resistance and tactical fragility.
✴️ Conclusion: Logic sealed - EMA9 has lost command; tactical control has shifted to neutrality with bear undertones.
⊢
▦ EMA21 - (Exponential Moving Average - 21 Close):
∴ EMA21 currently sits at $118,164.50, acting as an overhead suppressor;
∴ The gap between EMA9 and EMA21 is compressing, signaling potential for either crossover or volatility breakout;
∴ Price action is now trapped between EMA9 and EMA50, with EMA21 forming the upper barrier of a tactical box.
✴️ Conclusion: Logic sealed - EMA21 serves as containment lid; rejection here confirms tactical indecision.
⊢
▦ EMA50 - (Exponential Moving Average - 50 Close):
∴ EMA50 rests at $117,262.74, offering foundational support within the current structure;
∴ Price has respected this level on multiple dips since mid-July, confirming its strategic function as mid-term equilibrium;
∴ The slope remains mildly upward - no sign of reversal, only compression beneath.
✴️ Conclusion: Logic sealed - EMA50 maintains its structural role as mid-range dynamic floor.
⊢
▦ EMA200 - (Exponential Moving Average - 200 Close):
∴ EMA200 remains well below at $111,765.30, untouched since early July;
∴ Its wide distance from price confirms that the broader structure remains in bullish territory;
∴ Its trajectory continues upward, anchoring the uptrend beneath all volatility.
✴️ Conclusion: Logic sealed - EMA200 secures the long-term structure; market remains elevated far above reversal threshold.
⊢
▦ Ichimoku Cloud - (9, 21, 50, 21):
∴ Price is currently within the Kumo (cloud) zone, defined between SSA and SSB - a region of ambiguity and compression;
∴ The Senkou Span A and Span B are nearly flat, signaling lack of directional command in the near term;
∴ Kijun and Tenkan lines are converged, offering no trend bias - equilibrium is dominating.
✴️ Conclusion: Logic sealed - Ichimoku confirms a neutralized compression state; breakout required for trend clarity.
⊢
▦ RSI (21) + EMA9 - (Relative Strength Index with Signal Smoothing):
∴ RSI value stands at (51.48), while the EMA9-signal rests at (52.25) - confirming a soft bearish crossover;
∴ The RSI has declined from its recent peak and now oscillates around the neutral 50-line;
∴ Momentum is waning without structural damage, indicating tactical cooling.
✴️ Conclusion: Logic sealed - RSI confirms suspended momentum; structural neutrality prevails beneath fading thrust.
⊢
▦ Stochastic RSI - (3, 3, 21, 9):
∴ Current values are: (%K = 35.33), (%D = 32.68) - with %K slightly above %D, forming a mild bullish crossover;
∴ The oscillator has just risen from oversold levels, indicating potential energy buildup;
∴ Prior cycles in this zone have produced false starts, so confirmation is essential.
✴️ Conclusion: Logic sealed - Stoch RSI hints at rebounding energy, but with fragile structure and low reliability.
⊢
▦ MACD - (9, 21, 9 - EMA/EMA):
∴ MACD Line = (–105.52), Signal Line = (–129.07), Histogram = (+23.55) - confirming a bullish crossover;
∴ The crossover occurred below the zero line, indicating a possible reversal from weakness rather than strength;
∴ Slope of MACD is positive but modest - insufficient to declare dominant shift.
✴️ Conclusion: Logic sealed - MACD is in bullish transition mode, but still recovering from beneath structural base.
⊢
▦ OBV + EMA9 - (On-Balance Volume with Trend Overlay):
∴ OBV currently reads (71.13M), and is slightly above its EMA9, signaling retention of volume without strength;
∴ Volume has not left the system - but neither has it surged; this is passive accumulation at best;
∴ No divergence exists for now, but lack of buildup implies neutral positioning.
✴️ Conclusion: Logic sealed - OBV is stable and neutral; no buyer escape, but no commitment surge either.
⊢
▦ Volume + EMA21 – (Volume Profile with Trend Average):
∴ Current volume bar = (13.91), sitting below the EMA21 baseline;
∴ The volume profile across recent sessions is declining - suggesting consolidation or exhaustion;
∴ No breakout volume spike has accompanied price stabilization - trend is under silent compression.
✴️ Conclusion: Logic sealed - volume fails to validate price levels; tactical fragility remains unresolved.
⊢
🜎 Strategic Insight – Technical Oracle:
∴ The H4 structure presents a state of compression beneath a neutral cloud, suspended between tactical short-term EMA's (9, 21) and safeguarded by a rising EMA50 backbone;
∴ Momentum oscillators (RSI, Stoch RSI, MACD) converge toward reactivation, yet none have broken decisively above neutral thresholds - reflecting potential, not power;
∴ Volume participation is inconsistent and fading, offering no confirmation for breakout - the market is in silent observation mode, not assertion;
∴ Ichimoku confirms indecision: price floats within Kumo, without command or breakout - equilibrium reigns;
∴ Price positioning remains elevated above the deeper structure (EMA200), but its current zone between EMA9 and EMA50 represents a coil of indecision;
∴ The overall condition is not bearish - but it is tactically suspended, lacking conviction, awaiting external ignition.
✴️ Conclusion: The Oracle confirms - the structure is intact, but tactical initiative is lost; the field is poised, not marching.
⊢
∫ II. On-Chain Intelligence – (Source: CryptoQuant):
▦ Short-Term Holder (SOPR):
∴ SOPR currently reads (1.001), meaning short-term holders are spending coins with no significant profit or loss - a signal of economic neutrality;
∴ The chart displays persistent lateral volatility around the (1.0) threshold since early July - no emotional dominance in market behavior;
∴ This pattern historically coincides with pre-expansion compression phases, rather than breakdown events.
✴️ Conclusion: Logic sealed - SOPR confirms behavioral neutrality among short-term holders; the market remains in a state of expectation, not realization.
⊢
▦ STH-MVRV - (Short-Term Holder Market Value to Realized Value):
∴ The metric is currently oscillating around (1.30), well above the danger zone at (1.0), but far below the euphoria threshold at (1.8);
∴ The structure reflects multiple euphoria rejections, followed by a return to balance - a classic cooling-off pattern without structural failure;
∴ Convergence between market price, realized value, and short-term cost basis indicates the market is retesting foundation zones.
✴️ Conclusion: Logic sealed - STH-MVRV confirms post-euphoric cooling with structural support intact; no active trend, no breakdown.
⊢
▦ Exchange Inflow Spent Output Age Bands - (All Exchanges):
∴ Inflows to exchanges have been consistently low in recent weeks, particularly among young coins (0d–1d, 1d–1w) - showing no urgency to sell;
∴ Aged outputs (>6m) remain dormant - long-term holders are not mobilizing;
∴ The absence of inflow pressure signals no macro panic or exit event, reinforcing the diagnosis of tactical compression.
✴️ Conclusion: Logic sealed - muted inflows confirm a lack of distribution catalysts; stable structure sustains the technical silence on the 4H chart.
⊢
🜎 Strategic Insight - On-Chain Oracle:
∴ All three on-chain metrics converge into a clear state of tactical equilibrium - not bearish, not euphoric, but suspended between action and observation;
∴ Short-Term Holder SOPR stabilizes at (1.001), marking a precise psychological stasis - profit-taking and panic-selling are both absent;
∴ STH-MVRV confirms a post-euphoria cooldown with structural preservation, implying that short-term holders have recalibrated expectations without abandoning their positions;
∴ Exchange inflows remain historically depressed, with no aged coins activating - a hallmark of silent markets preparing for resolution;
∴ The chain speaks softly: no exit, no aggression, no irrationality - only latency, and the potential energy of stillness.
✴️ Conclusion: The Oracle confirms - the on-chain architecture reflects suspended initiative; nothing is broken, nothing is charged - only paused.
⊢
𓂀 Stoic-Structural Interpretation:
▦ Structurally: Bullish;
∴ Price remains well above the EMA200 and EMA50, with no breach of long-term support;
∴ All EMA's (9, 21, 50) are compressing, but retain upward trajectory - confirming structural integrity;
∴ Ichimoku Kumo holds price within a neutral band, but does not reflect a breakdown.
⊢
▦ Momentum-wise: Suspended Compression.
∴ MACD shows bullish crossover from beneath, but lacks amplitude to confirm trend reversal;
∴ RSI is parked around 50 with a bearish signal crossover - signaling stagnation, not strength;
∴ Stochastic RSI is climbing out of oversold, but with no impulsive follow-through.
⊢
✴️ Final Codex Interpretation:
∴ The H4 structure is consolidating beneath short-term resistance and within equilibrium clouds;
∴ Momentum is rebuilding, but flow remains stagnant;
∴ Buyers have not exited, but neither have they re-initiated force;
∴ The chart breathes - but does not speak.
⊢
⧉
· Cryptorvm Dominvs · MAGISTER ARCANVM · Vox Primordialis ·
⚜️ ⌬ - Silence precedes the next force. Structure is sacred - ⌬ ⚜️
⧉
⊢
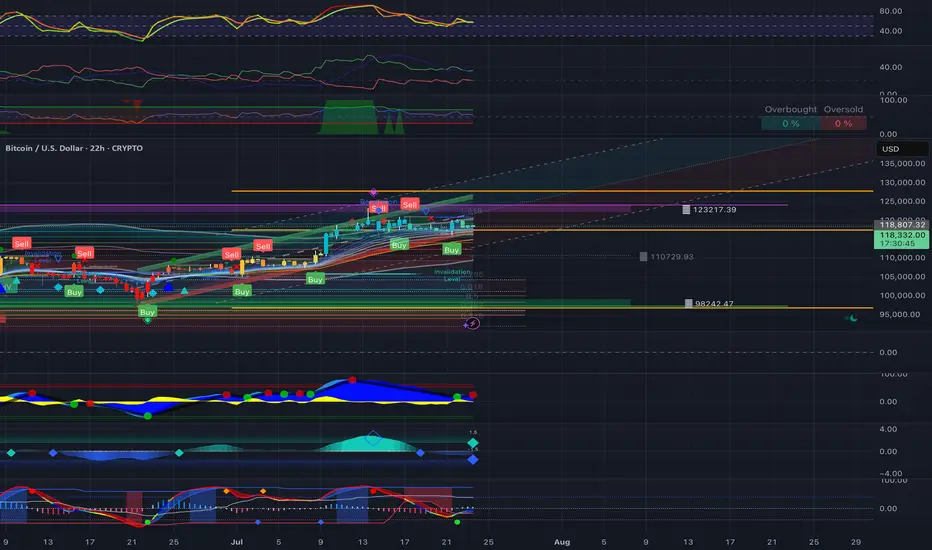
bitcoin technical chart movingwe are provide bitcoin next falling expected after big chance to buying level
Btcusd techinical analysis.Btcusd techinical analysis next move posibale at h1 time.not finchinal advice.

key area for bullsif bulls cant hold this we're going to test previous range VAH which is 110k
holding this will need to reclaim VAL
if it rejects Range VAL as a bearish retest we may lose this area.
if VAH (which is a CME gapfill) wont hold (imo if we go this far down it will nuke) theres a likelyhood to 103k
Im bullish i think we reclaim here but thought is not edge.
for now we have decent oscilator data.
SP will be king here, if it will pump btc will pump also.
i longed here

BTCUSD BUYING can expect a bullish move from bitcoin as it has dropped a fair amount and can extract a reversal to the up side due to being oversold
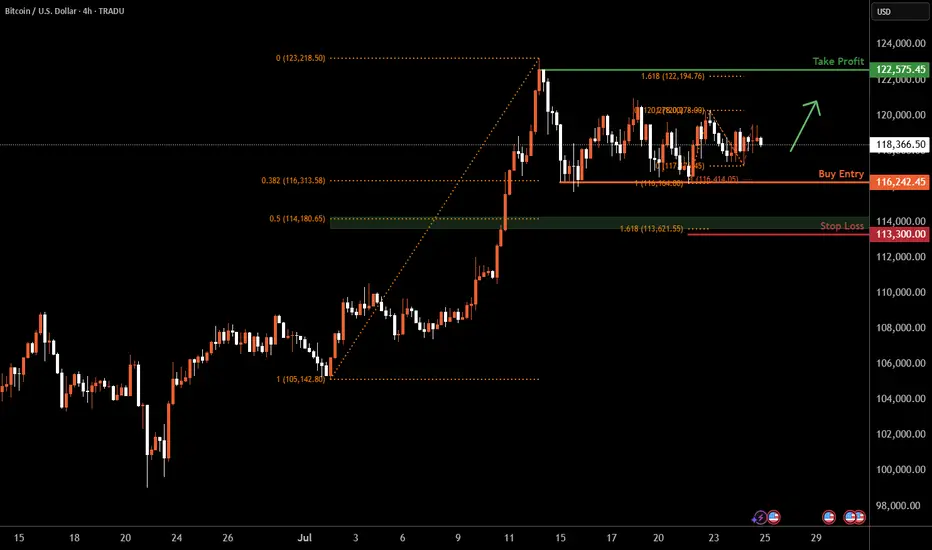
Bitcoin H4 | Falling toward a multi-swing-low supportBitcoin (BTC/USD) is falling towards a multi-swing-low support and could potentially bounce off this level to climb higher.
Buy entry is at 116,242.45 which is a multi-swing-low support that aligns with a confluence of Fibonacci levels i.e. the 38.2% retracement and the 100% projection.
Stop loss is at 113,300.00 which is a level that lies underneath a support zone that is identified by a confluence of Fibonacci levels i.e. the 50% retracement and the 161.8% extension.
Take profit is at 122,575.45 which is a swing-high resistance that aligns close to the all-time-high.
High Risk Investment Warning
Trading Forex/CFDs on margin carries a high level of risk and may not be suitable for all investors. Leverage can work against you.
Stratos Markets Limited (tradu.com ):
CFDs are complex instruments and come with a high risk of losing money rapidly due to leverage. 66% of retail investor accounts lose money when trading CFDs with this provider. You should consider whether you understand how CFDs work and whether you can afford to take the high risk of losing your money.
Stratos Europe Ltd (tradu.com ):
CFDs are complex instruments and come with a high risk of losing money rapidly due to leverage. 66% of retail investor accounts lose money when trading CFDs with this provider. You should consider whether you understand how CFDs work and whether you can afford to take the high risk of losing your money.
Stratos Global LLC (tradu.com ):
Losses can exceed deposits.
Please be advised that the information presented on TradingView is provided to Tradu (‘Company’, ‘we’) by a third-party provider (‘TFA Global Pte Ltd’). Please be reminded that you are solely responsible for the trading decisions on your account. There is a very high degree of risk involved in trading. Any information and/or content is intended entirely for research, educational and informational purposes only and does not constitute investment or consultation advice or investment strategy. The information is not tailored to the investment needs of any specific person and therefore does not involve a consideration of any of the investment objectives, financial situation or needs of any viewer that may receive it. Kindly also note that past performance is not a reliable indicator of future results. Actual results may differ materially from those anticipated in forward-looking or past performance statements. We assume no liability as to the accuracy or completeness of any of the information and/or content provided herein and the Company cannot be held responsible for any omission, mistake nor for any loss or damage including without limitation to any loss of profit which may arise from reliance on any information supplied by TFA Global Pte Ltd.
The speaker(s) is neither an employee, agent nor representative of Tradu and is therefore acting independently. The opinions given are their own, constitute general market commentary, and do not constitute the opinion or advice of Tradu or any form of personal or investment advice. Tradu neither endorses nor guarantees offerings of third-party speakers, nor is Tradu responsible for the content, veracity or opinions of third-party speakers, presenters or participants.
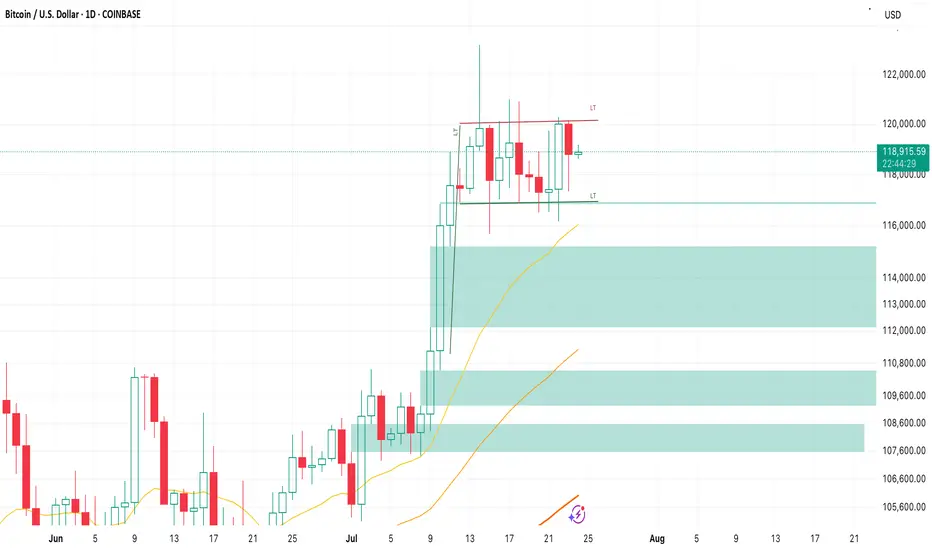
Bull Flag on BTCDecent sell-off today has been bought up nicely, my bullish thesis of
BTC and US equities remain.
- Bull Flag pattern forming on the daily
- Holding the 117k Support/FVG nicely
- Expecting some continued range-bound PA before the next leg-up begins
Second bull legI can sense a second bull leg forming right now. My last prediction was correct the market found some support from my demand zone but sadly it ripped right through it. Here is my second hope for a BTC bull run


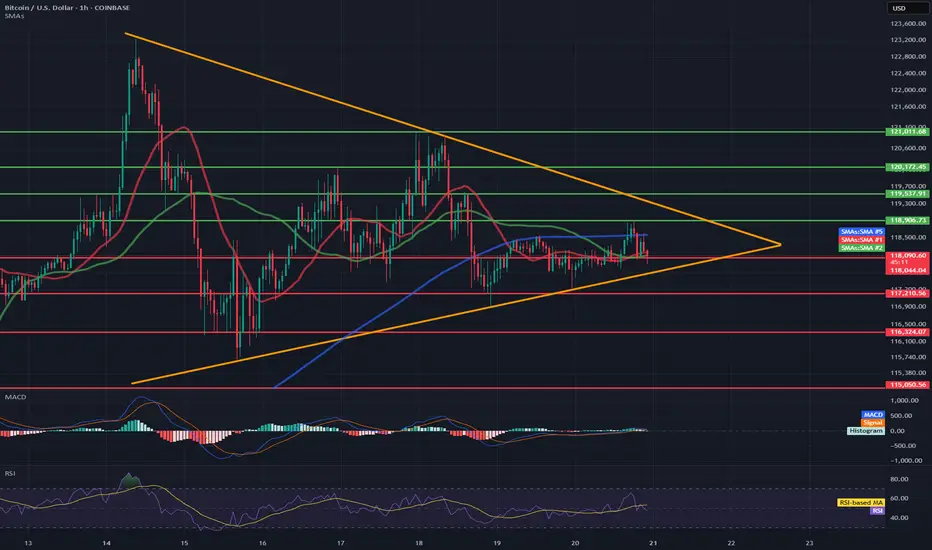
BTC/USD Short-Term🔷 Pattern: Symmetrical Triangle (Consolidation)
The price is inside the triangle formation (orange lines) and is approaching its completion.
An impending breakout (up or down) is highly probable within the next few hours.
📉 Support Levels (red lines):
117.210 – local horizontal support.
116.324 – 115.050 – strong demand zone (potential target in the event of a downward breakout).
📈 Resistance Levels (green lines):
118.900 – 119.700 – local resistance zone.
121.011 – 121.813 – higher target in the event of an upward breakout from the triangle.
📊 Technical indicators:
✅ RSI (Relative Strength Index):
Currently: 69.05 – close to overbought levels, but not yet at an extreme.
Potential for a short-term pullback unless a strong breakout occurs.
✅ MACD:
Signal lines are tightly intertwined, histogram flat → no dominant momentum.
Waiting for a breakout signal (bullish or bearish crossover).
✅ SMA:
Price currently below the 50 and 200 SMA for 1 hour → slight downward momentum.
The 50-SMA (red) is turning down, which may signal a continuation of the sideways or downward trend.
📌 Short-term conclusions (1–6 hours):
Scenario 1: Bullish breakout:
Confirmation: H1 candle close above 118,900.
Targets: 119,700 and potentially 121,000–121,800.
Scenario 2: Bearish breakout:
Confirmation: H1 candle close below 117,200.
Targets: 116,300, then 115,000–115,300.
📍 Watch for:
Breakout of the triangle boundaries with volume.
RSI behavior relative to the 70 level.
MACD crossover and histogram.
Do you think I'm joking ???As I said, Bitcoin broke the triangle, and now with a slight price correction, it could surge to $160,000, and you still think I'm joking!!
Previous analysis
Best regards CobraVanguard.💚

BTCUSD As BTCUSD fell back to 118k, we’ve some good break of structure to the downside with some good momentum seen from the H4 timeframe. Could this be giving us some good bearish sentiment? Or it’s just one of the mini-fluctuations pullbacks as they accumulate enough orders to push the BTCUSD markets even higher.

Reversal Zone: BTC Eyes $124.5K After Potential Liquidity SweepTechnical Analysis (4H Chart)
🔷 Pattern Overview:
Rising Channel: BTC is still respecting a long-term upward channel (black parallel trendlines).
Falling Wedge (Short-Term): Inside the channel, a falling wedge is forming—typically a bullish continuation signal.
The wedge is nearing completion, with a possible fakeout below support to the $110,500–$110,600 zone before a sharp rally.
✅ Price Expectation:
Bear Trap Likely: Price may dip to $110.5K support, triggering stop-losses.
Bullish Breakout Setup: If price rebounds strongly from $110K area, the wedge + channel pattern supports a move toward $124.5K–$125K.
Invalidation: Clean break below the channel and $110K could invalidate the bullish scenario.

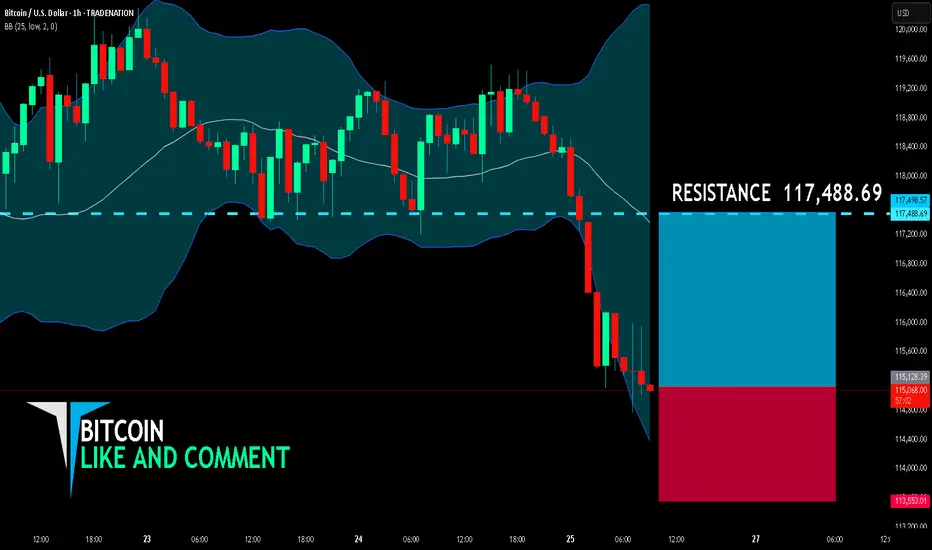
BITCOIN BULLS ARE GAINING STRENGTH|LONG
BITCOIN SIGNAL
Trade Direction: long
Entry Level: 115,128.39
Target Level: 117,488.69
Stop Loss: 113,553.01
RISK PROFILE
Risk level: medium
Suggested risk: 1%
Timeframe: 1h
Disclosure: I am part of Trade Nation's Influencer program and receive a monthly fee for using their TradingView charts in my analysis.
✅LIKE AND COMMENT MY IDEAS✅
Bitcoin: The Key Buying Level Near $112K Liquidity ZoneFenzoFx—Bitcoin consolidation extended into the bullish FVG, trading near $115,470.0. The 4-hour chart shows an indecisive candle, while the 200-day MA points upward, signaling bullish control.
The bullish outlook remains intact if price holds above the critical $112,000.0 support. However, current bearish momentum may drag price toward this level, potentially filling nearby FVGs.
Traders should monitor $112,000.0 for bullish setups, including break of structure and long-wick bullish candles.

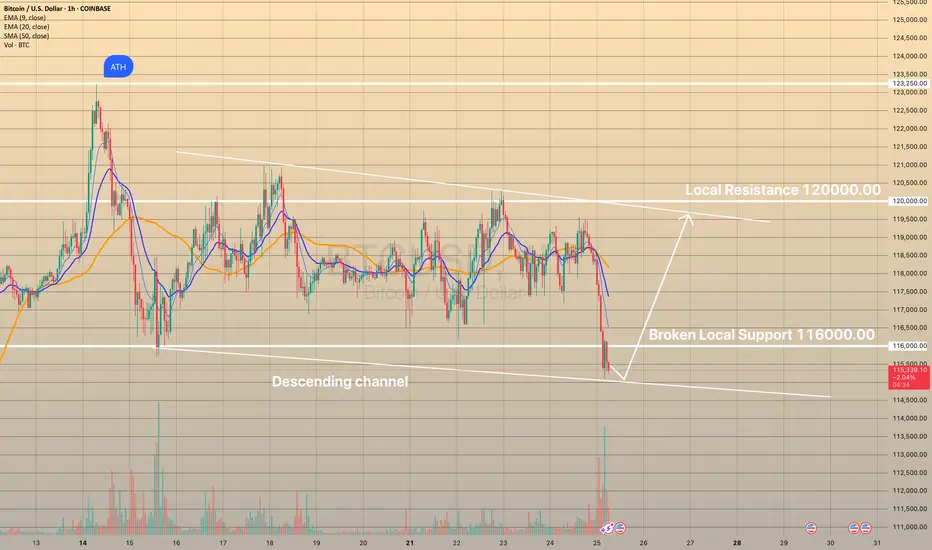
BTCUSD DROPPED BELOW LOCAL SUPPORTBTCUSD DROPPED BELOW LOCAL SUPPORT📉
Today bitcoin dropped below the level of 116,000.00 on high volume. However, the price didn't go somewhere far downwards and consolidates slightly below this level. Presumably, descending channel may be formed.
What is a descending channel?
A descending channel is a bearish chart pattern formed by two downward-sloping parallel trendlines connecting lower highs and lower lows in a pair’s price, indicating a consistent downtrend. It shows sellers are in control, with prices declining within a defined range.
Here I presume the price to rebound from lower border of the descending channel with possible movement towards upper border slightly below the 120,000.00 level.
Will the low of this BTC zone be used as a buy point?We have an imbalance high being tested. We know that this also represents the consolidation range low where both TPs and long entries will be triggered.
Will this be enough to send us back bullish or will be need further correction of the imbalance? I think there's a high probability of this with DXY also running into it's daily bearish imbalance range.
BITCOIN BULLISH WEDGE|LONG|
✅BITCOIN is trading in a
Strong uptrend and the coin
Has formed a massive bullish
Wedge pattern so we are
Bullish biased and IF we see
A bullish breakout we will
Be expecting a further
Bullish move up
LONG🚀
✅Like and subscribe to never miss a new idea!✅
Disclosure: I am part of Trade Nation's Influencer program and receive a monthly fee for using their TradingView charts in my analysis.

Continuation flag ?Looks like a continuation flag, thoughts?
ETH is in a pullback, BTC didnt have one,
looks like a strong bullish flag

Long -Market Moving in an uptrend
-Market consolidating at a support level
-Market has broken and tested counter down trend trendline.

More confirmation!Classic ABCDE pattern has formed. Is this the catalyst we've been waiting for to spark the next aggressive leg up?
