Bitcoin’s Incoming Bear Market!🚀 Bitcoin’s Bullish Phase: The Final Push Before the Fall?
Bitcoin is currently in the parabolic uptrend phase of its halving cycle, with price action closely following historical patterns. Since the last halving on April 15, 2024, Bitcoin has mined approximately 42,480 blocks, pushing the market closer to the 70,000-block threshold where the trend historically reverses into a deep bear market.
Based on historical patterns, Bitcoin’s next major bull market peak is expected around 150,000 USD, approximately 70,000 blocks post-halving (projected for August 2025). However, investors must prepare for what follows—a severe bear market fuelled by miner capitulation.
🔥The 70,000-Block Bearish Reversal: Why It Happens Every Cycle
1. The Mining Difficulty Trap & Rising Costs
Bitcoin’s mining difficulty adjusts every 2,016 blocks (~2 weeks) to maintain the 10-minute block interval.
As BTC price surges in the bull market, more miners join the network, driving competition and difficulty higher.
This raises mining costs and squeezes profit margins, making it harder for smaller miners to stay afloat.
✅ Bull Market (~0-70,000 Blocks Post-Halving)
High BTC prices offset increased difficulty, allowing miners to hold rather than sell.
Low sell pressure from miners keeps Bitcoin in an uptrend.
❌ Bear Market (~70,000 Blocks Post-Halving)
After BTC peaks, prices decline but difficulty remains high.
Mining costs remain constant, while block rewards drop.
Weaker miners can’t afford to mine at a loss and are forced to sell their BTC holdings to cover operational expenses.
2. The Snowball Effect: How Miner Capitulation Triggers a Crash
Once inefficient miners begin selling, a chain reaction unfolds:
1️⃣ Bitcoin price starts declining after the cycle peak (~12-18 months post-halving).
2️⃣ Miners struggle to remain profitable due to high difficulty and lower block rewards.
3️⃣ Miners begin offloading BTC to cover expenses, increasing supply in the market.
4️⃣ More BTC supply leads to further price drops, triggering panic selling.
5️⃣ Additional miners shut down operations, selling off reserves, further flooding the market.
6️⃣ Capitulation accelerates, causing a cascading effect similar to leveraged liquidations seen in past bear markets.
🔄 This cycle repeats until enough miners exit, difficulty adjusts downward, and BTC stabilizes.
3. Historical Proof: How Miner Capitulation Has Marked Every Bear Market
Each Bitcoin bear market aligns with major miner capitulation events. Here’s how past cycles have played out:
📌 2012 Halving: Bull top in late 2013, miner capitulation in 2014, BTC fell -80%.
📌 2016 Halving: Bull top in late 2017, miner capitulation in 2018, BTC fell -84%.
📌 2020 Halving: Bull top in late 2021, miner capitulation in 2022, BTC fell -78%.
📌 2024 Halving: Expected bull top in late 2025, miner capitulation likely in 2026?, BTC decline TBD but estimated to be around -60%.
🔹 In all cases, BTC topped ~70,000 blocks after the halving, followed by a deep drawdown driven by miner capitulation.
🔹 The selling pressure from miners perfectly aligns with the start of major market crashes.
4. The Accumulation Phase: What Follows the Crash?
After miners capitulate and difficulty adjusts downward, Bitcoin enters a sideways accumulation phase (~140,000-210,000 blocks post-halving).
Weaker miners have already exited, reducing sell pressure.
Surviving miners adjust to lower rewards and stop mass selling BTC.
Smart money (whales & institutions) begin accumulating at undervalued prices.
The MVRV ratio drops below 1, signalling a market bottom.
Bitcoin stabilizes, setting the stage for the next bull cycle.
This predictable recovery cycle lays the groundwork for Bitcoin’s next exponential rally into the next halving period.
The Bitcoin Bear Market Prediction for 2025-2026
✅ Bitcoin is currently on track to peak near ~$150,000 around 70,000 blocks post-halving (August 2025).
✅ Following this, BTC is expected to enter its bear market, with prices potentially falling to ~$60,000 (by December 2026).
✅ The primary catalyst for this crash will be miner capitulation, just as it has been in every prior cycle.
Final Thoughts
If history repeats, the Bitcoin market is set to follow a sharp parabolic rise to ~$150,000 before undergoing a 70,000-block miner-driven selloff into a multi-month bear market. Investors should be aware of this pattern and plan accordingly.
Sources & Data Validation
The insights presented in this article are based on historical Bitcoin price cycles, on-chain analytics, and mining difficulty trends from various sources, including:
Blockchain Data (Glassnode, CoinMetrics)
Historical BTC Halving Data (Bitcoin Whitepaper, Blockchain Explorers)
Market Analysis Reports (Messari, Arcane Research)
Macroeconomic Influences (Federal Reserve Reports, Global Liquidity Cycles)
Disclaimer: Not an Investment Recommendation
This article is for informational purposes only and should not be considered financial or investment advice. Bitcoin and cryptocurrency markets are highly volatile, and past performance is not indicative of future results. Conduct your own research and consult with a financial professional before making any investment decisions.
BTCUSD.PI trade ideas

7:1 R:R setup for BTCIt looks like BTC has completed its pullback and is now continuing its uptrend. This trade setup offers a 7:1 R:R with a target of 135K
Entry: 118,900
Stop Loss: 117,000
Target: 135,000
BTC: Buy idea: Bearish ChannelOn BTC we are in a bearish channel situation with a succession of numerous red candles. In such circumstances, we would have a high probability of seeing the market go up. This rise will be impressive if the resistance line is broken forcefully by a large green candle and followed by a large green volume. Good luck everyone!!!

BTCUSDWeekend price pump will fade expecting price to fall back to $110k region before we see a major price move to $130k
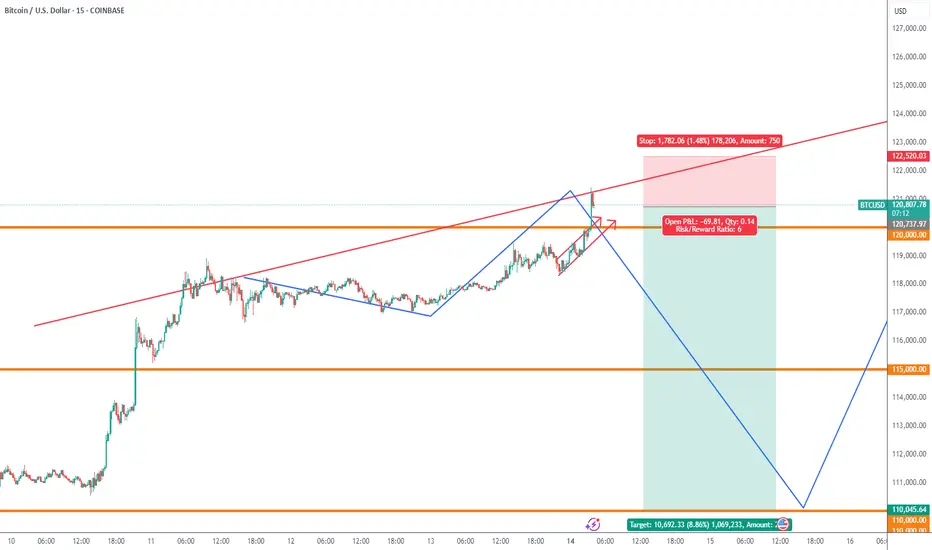
BTCUSDA short term Long biased although we favor the down side rather than the upside but we are trying to make some entry before we see major price retracement


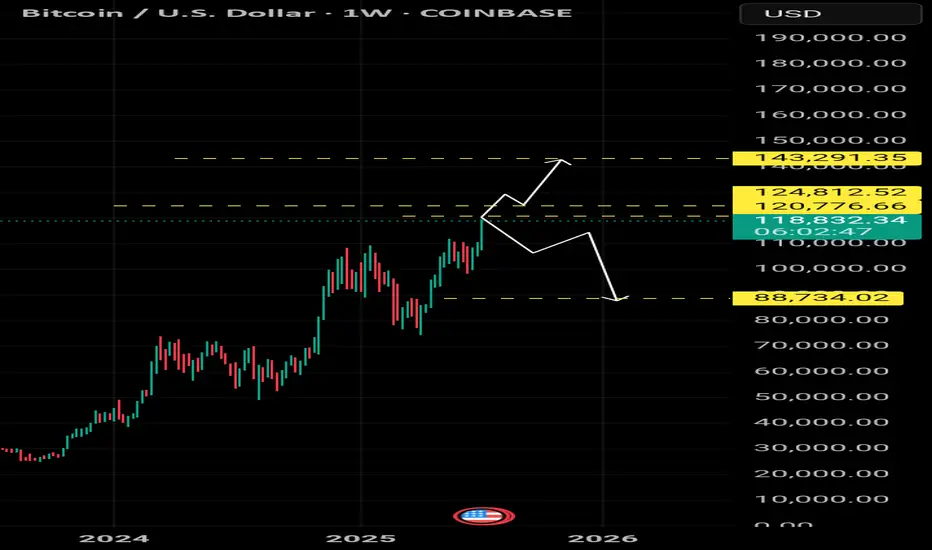
Btc levels 🔍 Dear TradingView community,
Here’s my outlook for Bitcoin in the upcoming weeks.
📊 The current levels are critical — they will determine whether the price continues toward higher targets or starts a deeper correction.
Stay sharp and manage your risk accordingly!
[UPD] Trend analysis: BTC / ETH / SOL / XRP and other Just recorded a new video overview of the crypto market and the current trend developments in major coins: CRYPTOCAP:BTC , CRYPTOCAP:ETH , CRYPTOCAP:SOL , CRYPTOCAP:XRP , CRYPTOCAP:LINK , GETTEX:HYPE , BSE:SUPER , $FLOKI.
Among the new assets on my radar I shared my view on the trend structure of $RENDER.
In my personal investment planning, I continue to treat any potential corrections into key support zones as opportunities to add or open new positions.
Thank you for your attention and I wish you successful trading decisions!
If you’d like to hear my take on any other coin you’re tracking — feel free to ask in the comments (just don’t forget to boost the idea first 😉).

Last chance to make profit from BTC with buying positionBullish flag
Strong resistance breakout
2 bull points
Position trade spot buying
Bitcoin completing timecycle on oct 2025 after that it would be 4th time if market again crash for around 70%
Manage your risk in both future and spot trading
Note: NO analysis would 100% profitable trading is the game of probability and risk management so follow your trading plan with proper risk reward and win rate.

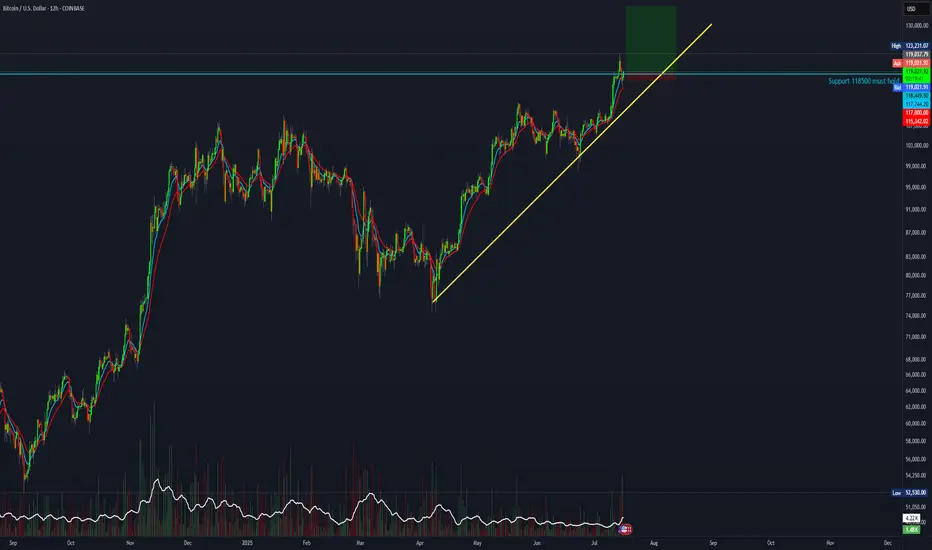
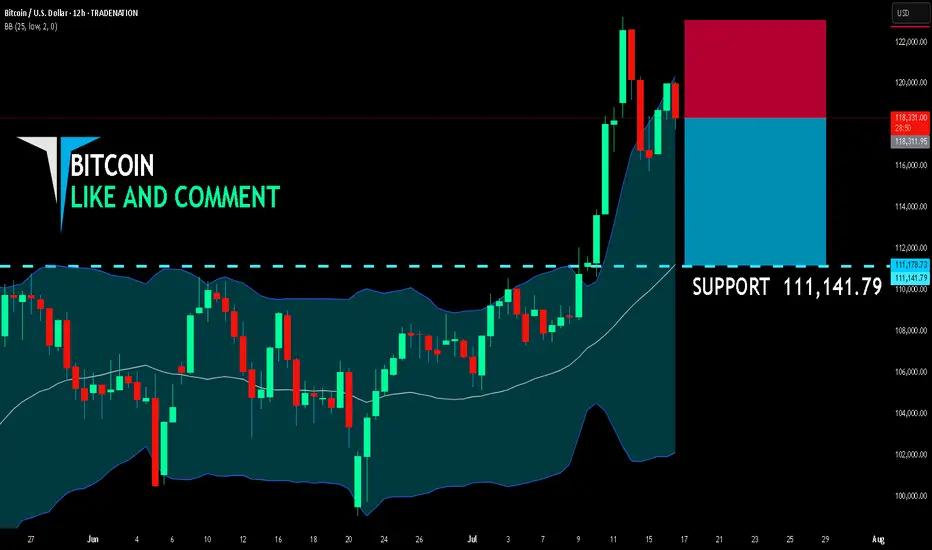
BITCOIN SHORT FROM RESISTANCE
BITCOIN SIGNAL
Trade Direction: short
Entry Level: 118,311.95
Target Level: 111,141.79
Stop Loss: 123,054.98
RISK PROFILE
Risk level: medium
Suggested risk: 1%
Timeframe: 12h
Disclosure: I am part of Trade Nation's Influencer program and receive a monthly fee for using their TradingView charts in my analysis.
✅LIKE AND COMMENT MY IDEAS✅
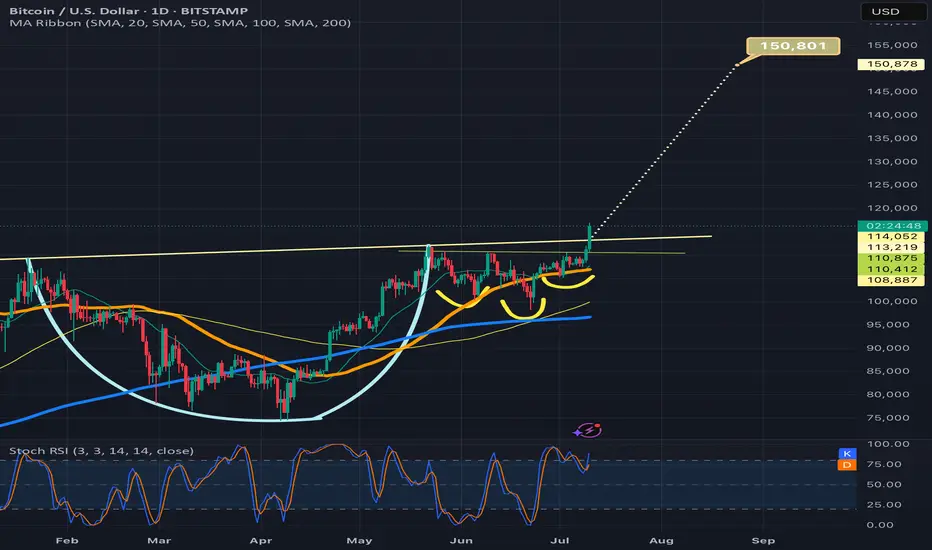
Btcusd breaking above cup and handle necklineIf it confirms the bullish breakout the target is 150k. Also by breaking above 116k and solidifying that level as strong support, we will trigger an even bigger inverse head and shoulders pattern (not shown here) with a breakout target around 208k! I will provide a link below to the chart I posted of that pattern. Thanks for reading, liking, and following. *not financial advice*
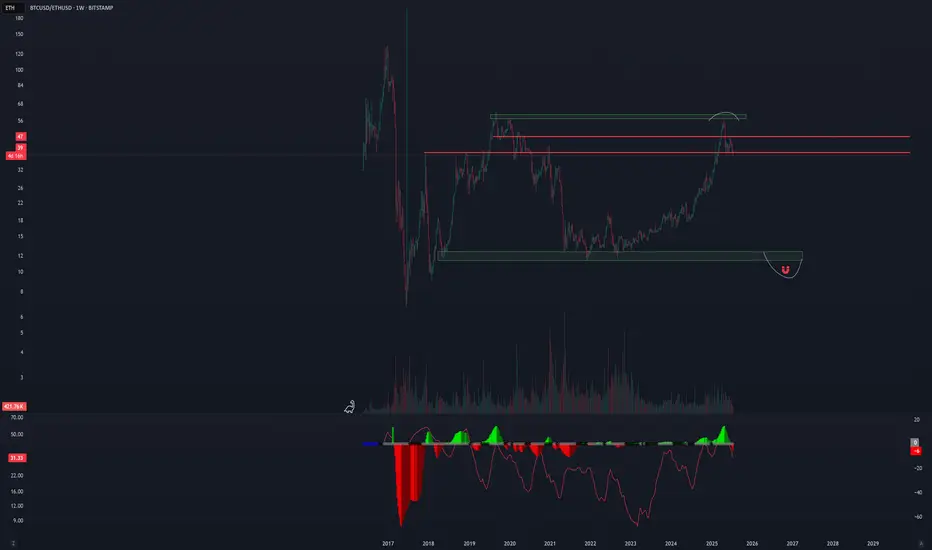
Alt Season uploadingAs BTC dominance is in a reversal key level, BTC/ETH also looks like in a reversal trend. Considering the total cripto market cap making ATH and breaking a heavy resistance, it seems like we are going to enter in a alt season. Let's see...
Bitcoin Buy Bias – On-Chain Confidence Still Has Room to RunThe On-chain Confidence indicator is showing signs of increasing sell pressure and profit-taking, but it still remains well below the historical peaks seen in previous bull market tops (2017 & 2021).
👉 This is a composite indicator combining several key on-chain metrics like RHODL Ratio, Puell Multiple, and MVRV, among others.
📊 The current level resembles early 2024 and early 2025, suggesting we are not yet at extreme sentiment levels.
If this indicator continues to climb toward its previous cycle highs, it may signal that we’re entering the final leg of this bull run. For now, there’s still room for upside momentum.

Btcusd techinical analysis.This chart shows the Bitcoin (BTC) / USD 1-hour timeframe on OKX, with several technical analysis elements:
Key Observations:
1. Price Action:
Current price: $117,334.1, showing a −2.14% decline.
Price has dropped from around $123,000 down to $117,000, indicating a sharp bearish movement.
2. Harmonic/Pattern Zones:
The chart contains harmonic pattern structures with Fibonacci ratios:
The large upswing has a retracement level of 0.9655, nearly a full retracement.
A downward channel/retracement touches 0.8416, indicating a deep pullback.
Another smaller retracement at 0.3716, a shallower correction.
3. Support and Resistance Zones:
Multiple horizontal purple zones mark areas of past price reactions:
Around 121,000, 119,000, and 117,000 levels.
Price is currently testing the 117,000 support zone.
4. Projected Price Path (Yellow Arrows):
The projected movement shows a potential bullish recovery:
Minor pullbacks are expected, followed by higher highs.
The target appears to aim back toward the 119,000 – 120,000 resistance zone.
5. Icons on Chart

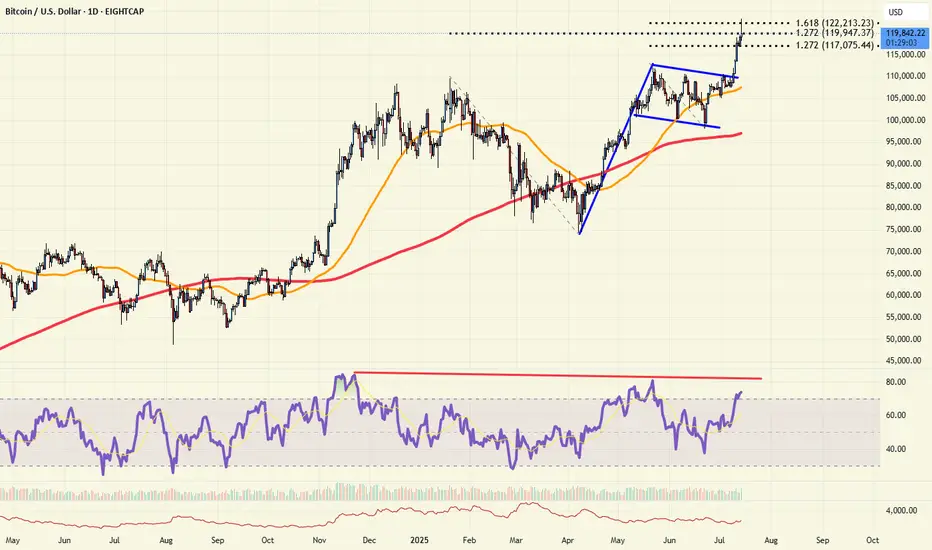
Retail in?After almost 3 decades as a trader, if there is one thing I have learned over the years, significant highs are made when sentiment is at extremes. Whether it is "mom and pop" or the "shoeshine guy" calling the top, it's when the buying (or selling) by retail is at a fever pitch. These days, you can't find a bear in Bitcoin, and the days on end of reports preaching "record inflows" is almost deafening.
Technically, Bitcoin is probing some key resistance today. It's stalled by the 161% Fibonacci extension of the recent early May highs to June lows. More importantly is the 127% extension of the January highs to April lows. RSI is very divergent as price hits new highs. And with sentiment at near extremes, bulls should be careful now. And a break back below the 112k level would be a very bearish "topping pattern" event.
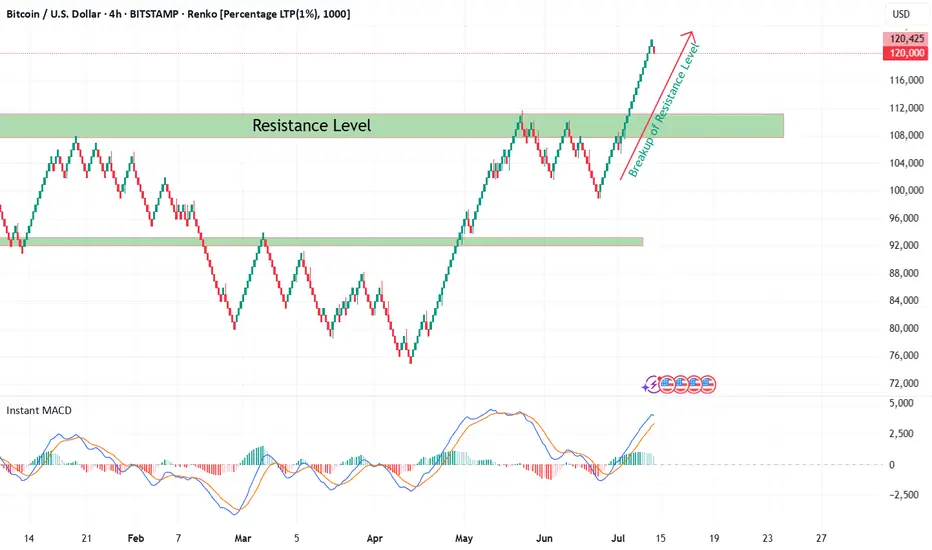
Bitcoin Renko Breakout Confirmation with CryptoQuant NetflowFrom late 2024 till now, Bitcoin (BTC/USD) was consolidating within a broad sideways range between well-defined support and resistance levels on the 4H Renko chart. During this time, market indecision was obvious as neither bulls nor bears could establish dominance.
Recently, BTC has decisively broken out above the major resistance zone at ~$108,000 — as seen with my custom Renko + Decision Tree + S/R Channel script ( ). This breakout above resistance technically suggests the end of range-bound price action and the potential start of a new bullish trend, especially when confirmed by on-chain data.
On-Chain Netflow Confirmation
As I originally highlighted in my CryptoQuant Netflow analysis (published under the username ‘cryptoonchain’ on CryptoQuant platform):
Total Exchange Netflow for Bitcoin has recently dropped to its lowest level since February 16, 2023 — at which point the last bullish cycle began.
Negative Netflow means more BTC is being withdrawn from exchanges than deposited, indicating reduced selling pressure and strong holder conviction.
Binance-specific Netflow also confirms massive outflows, a sign whales and large traders are accumulating and withdrawing funds from trading venues.
Historically, this combination — a technical breakout (Renko) and deep negative on-chain netflow (dataset: CryptoQuant) — has preceded major bull runs.
Summary
Based on both my Renko model and current on-chain flows:
The breakout above 108,000 resistance marks the start of a likely new uptrend for BTC (now 119,000).
On-chain data via CryptoQuant strongly supports the bullish scenario.
Invalidation
If BTC returns below $108,000 and consolidates there, this bullish outlook is invalidated and a reassessment is required.
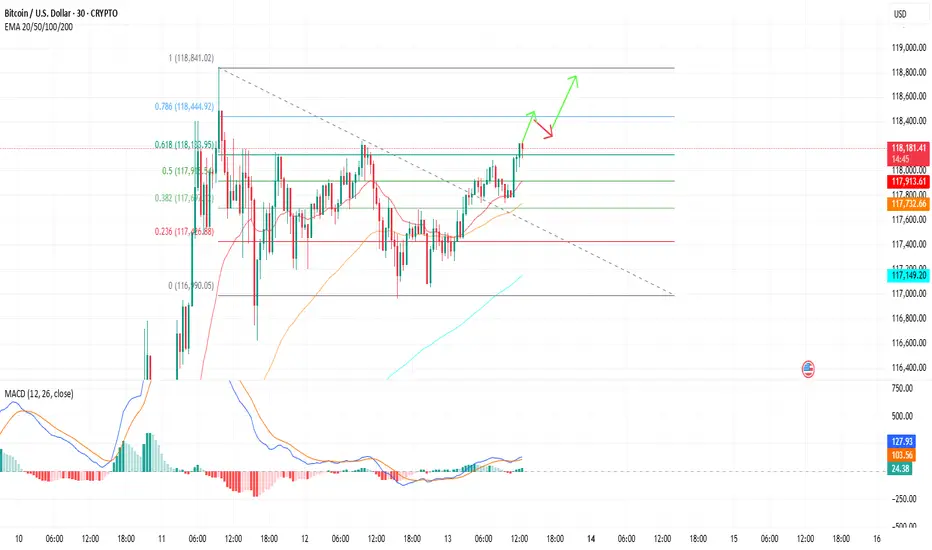
Btcusd techinical analysis.This Bitcoin (BTC/USD) 30-minute chart shows several key technical indicators and annotations, pointing to a bullish outlook. Here's a breakdown of the chart elements:
Key Elements:
1. Price Level:
Current price: $121,315.1
Change: +$2,178.0 (+1.83%)
2. Break of Structure (BOS):
Marked in yellow — indicates a shift in market structure from bearish to bullish.
It suggests a bullish trend continuation after this key resistance was broken.
3. FVG (Fair Value Gap):
The yellow "FVG" arrow points to an imbalance or gap between candle wicks that the market might return to for liquidity.
Often used as a potential entry point or pullback target.
4. Trendline:
The pink upward trendline shows current bullish momentum.
Price is currently testing or has broken above this trendline.
5. Bullish Flag/Channel:
Blue diagonal channel indicates a bullish flag or continuation pattern.
Price broke out upward from this flag — typically a bullish sign.
6. Fibonacci or Ratio Markers:
Numbers like 0.9612351706716865 and 0.305800778819... may

Ascending Inverse H&S on the BTC weekly chartThe longer it takes to break above this neckline the higher the breakout target will be. I have arbitrarily placed the measured move line at July 18th 2025. If the breakout were to happen on that day the measured move target is around 208k, which could take quite awhile to reach or if we entered a truly hyperparabolic blow off top we could reach such a target way quicker than when the dotted measured move line reaches it. *not financial advice*

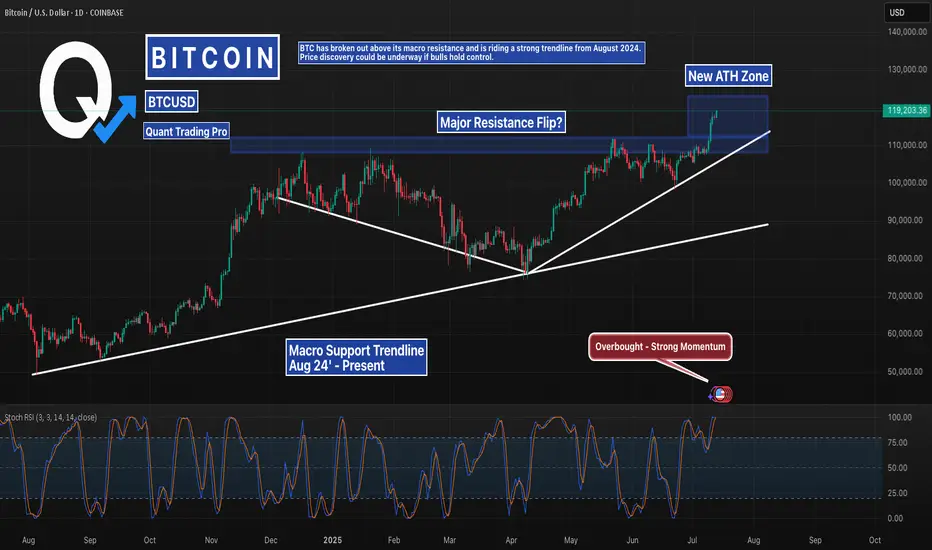
Bitcoin Breakout Confirmed – Eyes on Price DiscoveryBitcoin has officially flipped its macro resistance zone into support, continuing to follow a clean ascending structure from August 2024. With Stoch RSI pushing into overbought and no clear ceiling above, BTC may be entering a price discovery phase.
Stay alert for continuation or potential retest around $111K.
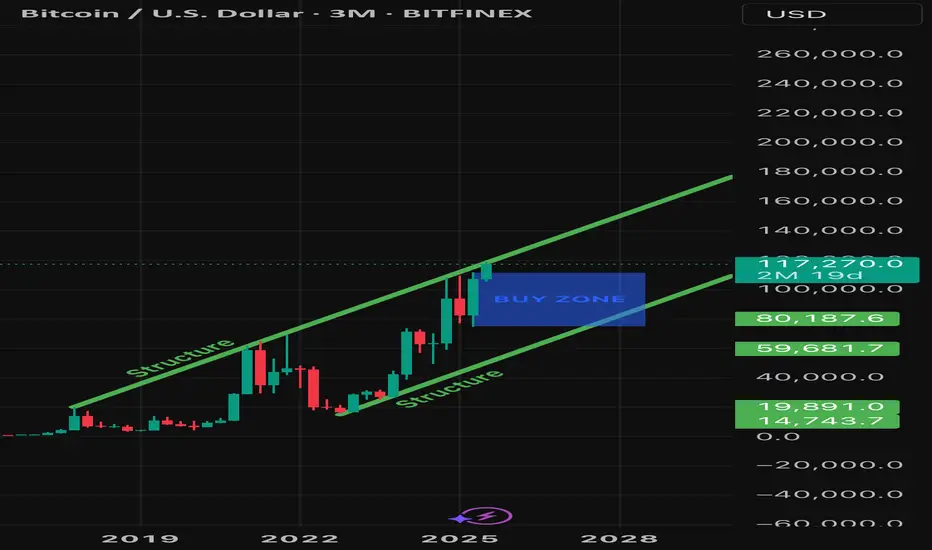
Bitcoin’s ForecastWho knows how high Bitcoin will go but my guess is between 300/350k. What I may know ahead of time is where price may fall, for the buy. I labeled the buy zone which I believe will trigger in January 2027 based off of the pattern Bitcoin has created. I’ve noticed a couple years ago that the best time to buy Bitcoin is in January, the year after being bearish. This is the pattern and you can check for yourselves: 3 years bullish, approximately 1 year bearish. January of 2027 may begin the next bull cycle that could last for 3 years. Stay tuned!

Btcusd techinical analysis.This chart displays a 1-hour candlestick analysis for Bitcoin (BTC/USD) on OKX, with a focus on harmonic pattern recognition and technical price projections.
Here's a breakdown of what the chart suggests:
---
🔷 Harmonic Pattern: Potential Bullish Bat or Gartley
The marked XABCD structure appears to form a harmonic pattern, likely a Bullish Gartley or Bat:
XA: Initial impulse leg.
AB: Retraces ~61.8–78.6% of XA.
BC: Retraces ~38.2–88.6% of AB.
CD: Extends to complete the pattern near the D point.
✅ Ratios like:
AB ≈ 0.618–0.786 of XA
BC ≈ 0.618–0.886 of AB
CD ≈ 1.272–1.618 of BC support this classification.
---
📈 **Ascending Triangle
