$BTC – Three Possible Scenarios in the Near FutureCRYPTOCAP:BTC – Three Possible Scenarios in the Near Future:
🔹 Optimistic: Growth up to $140,000
🔹 Conservative: Growth up to $112,000
🔹 Pessimistic: Decline to $75,000 – $85,000
🚨 Key Levels to Watch:
▪️ $112,000 — a breakout above this level could open the path to $135,000 – $145,000
▪️ $100,000 – $103,000 — if BTC drops into this zone, it could trigger a decline toward $85,000 – $95,000
▪️ $83,000 — falling to this level may indicate further downside to $30,000 – $50,000
BTCUSD.PI trade ideas

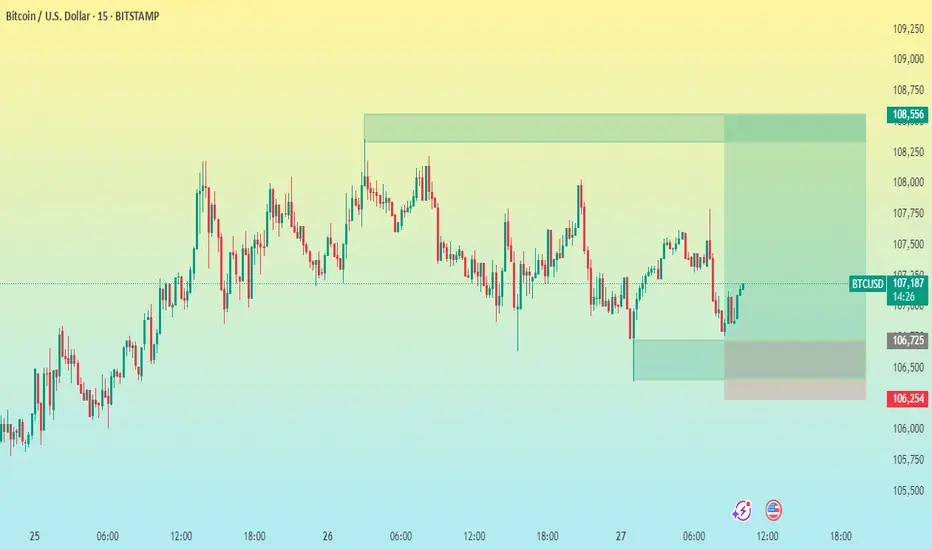
BTC/USD 15 M CHART PATTERN 🕵♂ Chart Context
Asset: Bitcoin (BTC) vs. USD
Exchange: Bitstamp
Timeframe: 15-minute
Date Range: June 25–27, 2025
Chart Type: Candlestick
---
📊 Technical Analysis
1. Trend
Short-term trend: Sideways to slightly bullish.
Market saw an earlier uptrend, then consolidation with lower highs and higher lows (forming a range).
Price is currently rebounding from the lower part of the range.
2. Key Levels
Entry Level: ~107,123 – likely where a long trade was entered.
Support Zone:
Minor: 106,725
Strong: 106,254 (stop-loss level, clear structure support)
Resistance Zone / Target: 108,556 – a prior high and possible supply zone.
3. Risk-Reward Ratio
Entry: 107,123
SL: 106,254 (−869 points)
TP: 108,556 (+1,433 points)
RR Ratio: ≈ 1.65:1 – acceptable for intraday trading.

BTCUSD – Major Decision Point at The Edge📍 By: MJTrading |||
Bitcoin has rallied sharply from ~$98K and is now testing a critical confluence zone — the top of the descending channel and a strong supply area, known as "The Edge."
EMAs are turning up, supporting bullish momentum
⏳ What’s Next?
At this stage, two scenarios emerge:
⚠️ This is a make-or-break zone:
🟩 Breakout above the channel signals trend reversal → next resistance: $111K
🟨 Rejection leads to a move back to the $103K or $100K levels
This setup offers a high-RR opportunity for both breakout traders and mean reversion players.
🧠 Trade the reaction at the edge, not the prediction.
Thanks for your attention...
Share your thoughts...
—
#BTCUSD #Bitcoin #CryptoTrading #TheEdge #BreakoutOrBounce #CryptoSetup #DescendingChannel #SmartMoney #TechnicalAnalysis #PriceAction #SwingTrade #EMA #RiskReward #MJTrading #4hChart #TrendDecision #SupplyZone

BTCUSD Descending channel breakout bullish possible from SupportBTCUSD Breakout Alert!
1H Timeframe Analysis
Bitcoin has broken out of the descending channel with a strong bullish candle — signaling a potential reversal from the key demand zone around 103,600.
📈 Technical Targets:
🔹 First Target: 108,000
🔹 Second Target: 110,000
This breakout could offer a solid long opportunity, but as always — manage risk wisely! ✅
💬 What’s your bias?
❤️ Like | 🔁 Share | 💭 Comment
📲 Join us for more real-time updates and insights!
#BTC #Bitcoin #CryptoTrading #TechnicalAnalysis #Breakout #BullishMomentum

BTC Breakout or dropBitcoin has been trading in a range from 97.5K-112K for some time we tested 97K weekend and we bounce over 10% but we fail to make a ATH, also Bitcoin has strong bearish divergences that hardly anyone pays key attention to and these are almost identical to 2021 cycle top.
I have draw the resistance line and support from 2021 my theory is that IF we invalidate the bearish divergences we can see price action between 145K + . I do not think we can see a 320K price per bitcoin this cycle this will maybe happen in 2028 or 2032 cycle. Now if we do not breakout and invalidate the bearish divergences we can see the price dropping back to test the major 2021 support which is around 78K-84K only when this support if broken and we close a full body weekly candle below it then this confirms bear market has started.
Price action has move almost 8X from the 2022 ATL which is a decent return if you bought and hold.
If you enjoy the TA feel free to join my network its absolutely FREE.

Bullish confirmation today on both the daily and 4hrly.Bullish confirmation today on both the daily and 4hrly.
4hrly Chart:
Caught the dip?

BTCUSD bull flag?Hi traders what is your opinion,are still bullish or pump n dump scares you?well amstil bullish wait for breakout n retest for safety entry if you are scared, I've been buying dips my first target is 120k,take Calculated risk n hold your trades,money management is your friend,I wish you all the best I don't have much to say but what I study is what is happening in the market.

BTCUSD: $110,000 Resistance as Key Battlefield for Bulls & BearsAfter BTC price broke below the $100,000 integer threshold, it rebounded near $98,000 due to DXY weakness and eased geopolitical tensions, currently challenging the $110,000 level. However, strong resistance exists at $110,000. Historical trends show that BTC tends to trigger pullbacks when rising to the $110,000 integer mark. If it fails to break through $110,000, shorting on rallies is still recommended.
BTCUSD
sell@108500-109500
tp:107500-106500
I am committed to sharing trading signals every day. Among them, real-time signals will be flexibly pushed according to market dynamics. All the signals sent out last week accurately matched the market trends, helping numerous traders achieve substantial profits. Regardless of your previous investment performance, I believe that with the support of my professional strategies and timely signals, I will surely be able to assist you in breaking through investment bottlenecks and achieving new breakthroughs in the trading field.

BTC daily bull flag formationBTC is looking bullish on the daily chart in my opinion. One more pullback might be in order before we test new highs on the daily chart. The 100 sma has crossed over the 200 sma and the 50 sma is crossing the 21 sma. The rsi is neutral at time of publication. This bullish breakout could occur in late july after a pullback in the near term.
I think bitcoin is setting up to make another all time high push as summer draws on.
Not financial advice. Do your own DD.
Thanks for viewing the idea.
Comment what you think is going to happen over the course of this summer.

Bitcoin 1hr Bullish Again?Hello ladies and gentlemen, is Bitcoin preparing for another 1hr Bullish TIME Cycle?
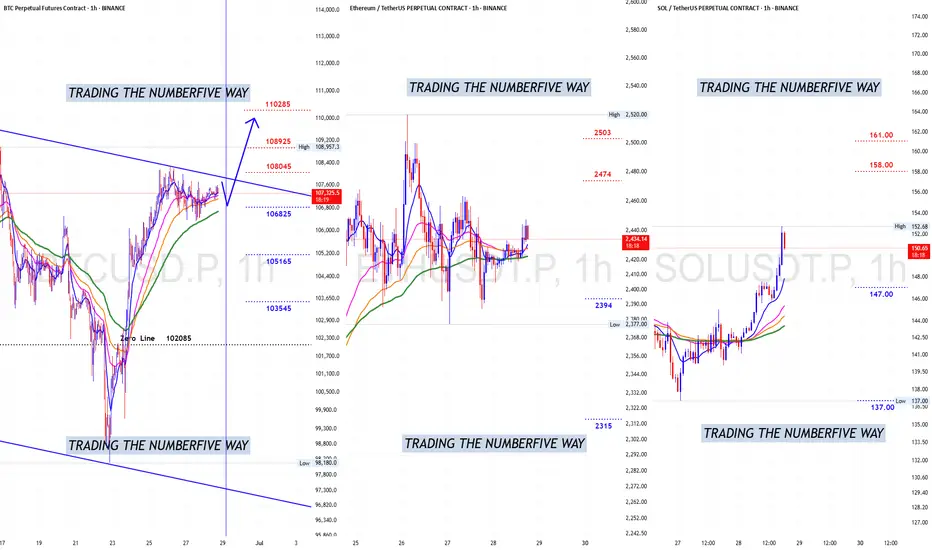
Well looking at the current 1hr Bearish TIME Cycle in progress and is well noticeable that bears just don't have power enough to push price down to its Zero Line $102085 and according to TIME left on bears side we can say that in the next 6hrs (if not sooner) the 1hr Bullish TIME Cycle will be re-taken again pushing price to above $109000, but don't expect much from next spike cause the Daily Bullish TIME Cycle is NOT ready yet but once it gets ready probably by end of first wee of July it will try to break the ATHs again, lets don't forget that the weekly still in a UPtrend direction and as long as the Zero Line is NOT breached then ATHs still on the table. Buckle up ladies and gentlemen cause wild...wild....wild volatility is coming back. Use lev wisely.
“DXY at 3-Year Low | Gold Slips, BTC Stalls – What PCE Data Meann this week’s Market Recap, we break down the key moves across the US Dollar Index (DXY), Gold (XAUUSD), and Bitcoin (BTCUSD) — and how they’re all being shaped by rising Fed uncertainty and looming U.S. inflation data.
🔹 DXY is hovering near 3-year lows as political pressure and expectations of Fed rate cuts weigh on sentiment.
🔸 Gold is slipping near 4-week lows as Middle East tensions ease and risk appetite returns.
🔹 Bitcoin remains flat but poised for a breakout, with macro data in the driver's seat.
We explain how each market is reacting, what traders are pricing in ahead of the upcoming PCE inflation data, and how to position yourself in the week ahead.
📌 Covered in this recap:
Market sentiment shifts and key news drivers
Practical insights for interpreting price action
What to watch in next week’s economic calendar
📊 Stay informed, stay prepared.
👉 Like, follow, and comment if you found this helpful. Let’s trade smart.

Bitcoin Analysis 23-Jun-25Bitcoin price in the weekend retested around 98,500$, this drop was mainly supported by the fear in the markets due to the escalations in the Middle East, & the US taking part in the War.
In this short analysis video, we will be discussing the Areas of interest and possible price movement we could see.
Disclaimer: easyMarkets Account on TradingView allows you to combine easyMarkets industry leading conditions, regulated trading and tight fixed spreads with TradingView's powerful social network for traders, advanced charting and analytics. Access no slippage on limit orders, tight fixed spreads, negative balance protection, no hidden fees or commission, and seamless integration.
Any opinions, news, research, analyses, prices, other information, or links to third-party sites contained on this website are provided on an "as-is" basis, are intended only to be informative, is not an advice nor a recommendation, nor research, or a record of our trading prices, or an offer of, or solicitation for a transaction in any financial instrument and thus should not be treated as such. The information provided does not involve any specific investment objectives, financial situation and needs of any specific person who may receive it. Please be aware, that past performance is not a reliable indicator of future performance and/or results. Past Performance or Forward-looking scenarios based upon the reasonable beliefs of the third-party provider are not a guarantee of future performance. Actual results may differ materially from those anticipated in forward-looking or past performance statements. easyMarkets makes no representation or warranty and assumes no liability as to the accuracy or completeness of the information provided, nor any loss arising from any investment based on a recommendation, forecast or any information supplied by any third-party.

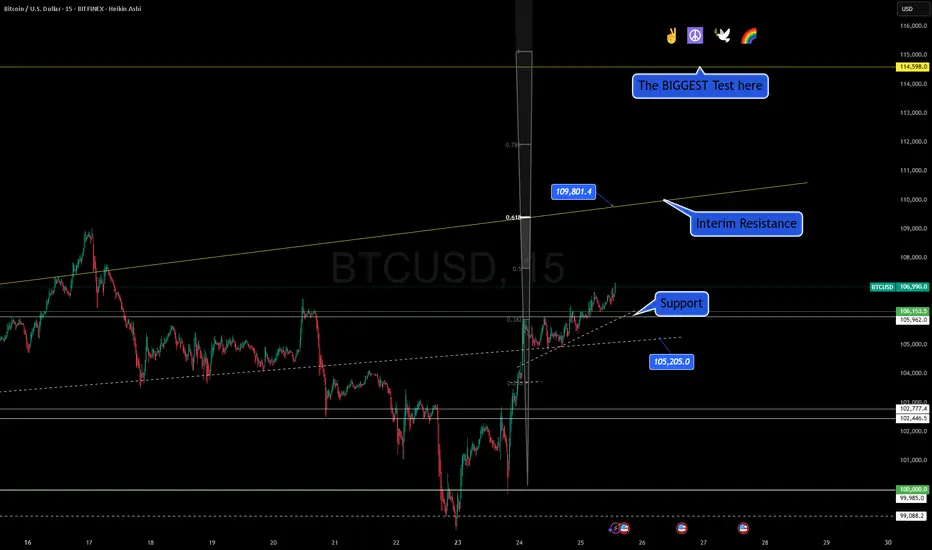
Updated Chart and Levels. Peace firstVideo:
🕊️💛 Bitcoin Love and Peace! Let's go 🚀🧘♂️
Hello Traders,
The world may be tense, but Bitcoin is offering a beacon of calm and opportunity. 🌍💡 We've established strong support at 106,153 and 105,962, and with peace settling in geopolitically and a softer tone from the Fed, the market is primed for movement.
📊 What I see:
Support is holding beautifully
Short-term breakout structure building up
Immediate resistance at 109,801
Bigger test zones at 113,800 and 114,598
Altcoins? They're sitting in the backseat. BTC dominance is around 65%, confirming that Bitcoin is the leader right now. If you're hunting momentum, this is where your focus should be.
As I always say—never long disaster, never short peace. And right now, with the War of 12 Days behind us, Bitcoin reflects hope and progress.
So let’s trade smart, stay grounded, and always remember—hate makes you part of the problem, love makes you part of the solution. Let’s build a world where even enemies become friends. 💞
One Love,
The FXPROFESSOR 💙
Disclosure: I am happy to be part of the Trade Nation's Influencer program and receive a monthly fee for using their TradingView charts in my analysis. Awesome broker, where the trader really comes first! 🌟🤝📈
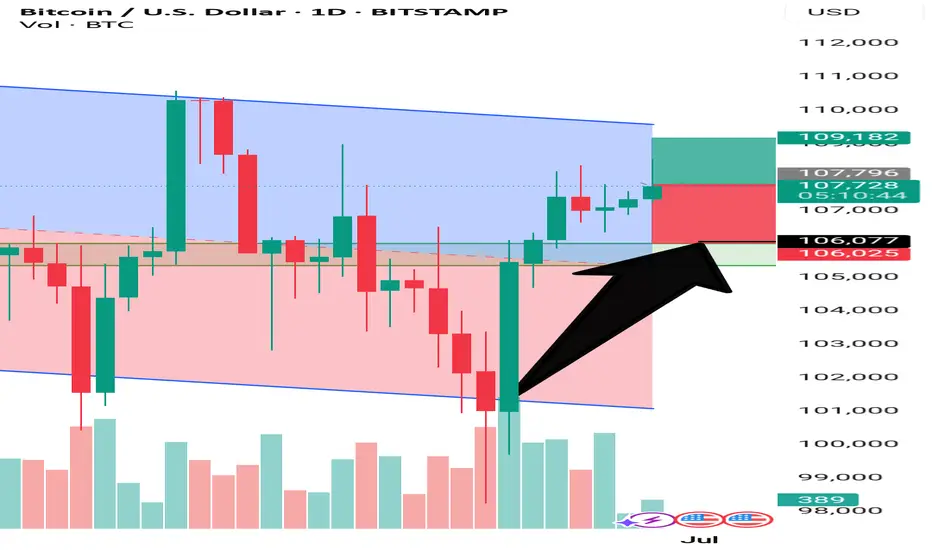
BTC/USD Consolidation Breakout Setup Chart Overview:
The BTC/USD chart shows a strong bullish impulse followed by a consolidation phase just below a key resistance level, suggesting a potential bullish continuation.
🔹 Key Technical Zones:
📍 Support Zone:
105,368 – 106,481 USD
This area acted as a strong demand zone where price reversed aggressively.
📍 Resistance Level:
107,439 – 107,840 USD
Price is currently consolidating just below this resistance, indicating a buildup for a breakout.
🎯 Target Zone:
110,683 – 111,394 USD
A clean breakout above resistance could push price into this target area.
🔹 Technical Signals:
✅ Bullish Flag Formation:
After a strong impulse move, BTC is forming a sideways range, indicating bullish accumulation.
⬆️ Breakout Potential:
A confirmed breakout and retest above 107,840 could validate a move toward the 111K region.
⚠️ Invalidation Point:
A drop below 106,481 would invalidate the bullish bias and may trigger a deeper pullback.
📌 Conclusion:
As long as BTC holds above the 106,481 support and breaks above the 107,840 resistance, bullish momentum is expected to continue toward the 111K zone. Traders should watch for a breakout confirmation and manage risk accordingly. 💹

major ouchieUS involvement in the middle east just might spell the end for the bull portion of this current halving cycle
this structure is looking very precarious

Barb WireBTCUSD is potentially entering in a Barb Wire, meaning bulls and bears are in equilibrium and any breakout to either side has a good chance of being a false breakout.
I'm going to stay out of it for now.
If price breaks through the bear TL and make a strong reversal bar at the All Time High, it could potentially be a good short trade with high RR.

BTCUSD looks heavyBTCUSD looks heavy. Resistance at 109000.
I guess we may see a corrective move lower towards 100000 in the coming weeks.
I would sell here, with a stop at 109000.

Inverse head and shouldersInverse head and shoulders to break up, retest ath, retracement to neckline, then on to new ath

CHECK BTCUSD SIGNAL READ CAPTAINsell Setup)
Entry Zone: Around 106850.00\106650.00
Stop Loss: 107400.00
Take Profits:
TP1: ~106000.00
TP2: ~105300.00
Final Target: 104550.00

Title: BTC Rejected at Channel Top – Downside Risk BuildsText:
Bitcoin is showing signs of rejection from the top of the descending channel near the 109k region. With selling pressure increasing and price struggling to break higher, there’s a strong probability of a downward move. If support around 106k fails, BTC could revisit previous lows and potentially head toward the sub-1M zone ("Azad"). Caution is advised as the market may be preparing for another bearish wave.
$BTC: Breakout Loading – Massive Opportunity Ahead! BTC is consCRYPTOCAP:BTC : Breakout Loading – Massive Opportunity Ahead!
BTC is consolidating within a major structure for 224+ days. Current price action is forming a bull flag, signaling strong potential for a breakout toward $120,000–$150,000. Short-term volatility expected, but long-term trend remains bullish.
🔸 Support at $90,000–$93,000:
Strong confluence in this region including CME gap, liquidity pools, and previous structure support. Rejection from $113K could trigger a flush into this zone. Long setups should be considered here. Whales are accumulating.
🔸 Upside Target: $120,000 – $150,000
Long-term breakout from consolidation range aligning with historical accumulation patterns and macro indicators like M2 lag. Break of $113K with strength opens doors to $120K+. Clean structure with confirmed support will fuel rally continuation.
🔸 Risk Level at $88,000:
If BTC breaks below $88K with volume and closes under structure, it would invalidate the bull flag scenario short-term and signal deeper correction.
🔸 Outlook:
Monitor price reaction near $113K. Prepare for fakeout and potential sweep into $90K–$93K zone. Place laddered long orders in that range for optimal R:R. If dip occurs, treat it as a gift entry. No bearish outlook unless macro conditions shift drastically. Momentum remains upward.
₿itcoin: PullbackBitcoin has experienced significant selling since Friday, briefly slipping below the $100,000 mark. We previously mentioned that a sharper pullback wouldn't surprise us. Whether prices will drop a bit further remains to be seen for the moment. Ultimately, we still expect Bitcoin to climb into the upper blue Target Zone (coordinates: $117,553 – $130,891) before a broader C-wave sell-off occurs, pushing the price down to the lower blue Target Zone (coordinates: $62,395 – $51,323). There, we anticipate the low of the larger orange wave a, which should mark the start of another corrective upward move. Afterward, we're preparing for the last downward leg of blue wave (ii). However, if Bitcoin directly surpasses the resistance at $130,891 – and thus our upper blue Target Zone – we'll locate it still in blue wave alt.(i) (30% probability).
📈 Over 190 precise analyses, clear entry points, and defined Target Zones - that's what we do.
