$BTC: Breakout Loading – Massive Opportunity Ahead! BTC is consCRYPTOCAP:BTC : Breakout Loading – Massive Opportunity Ahead!
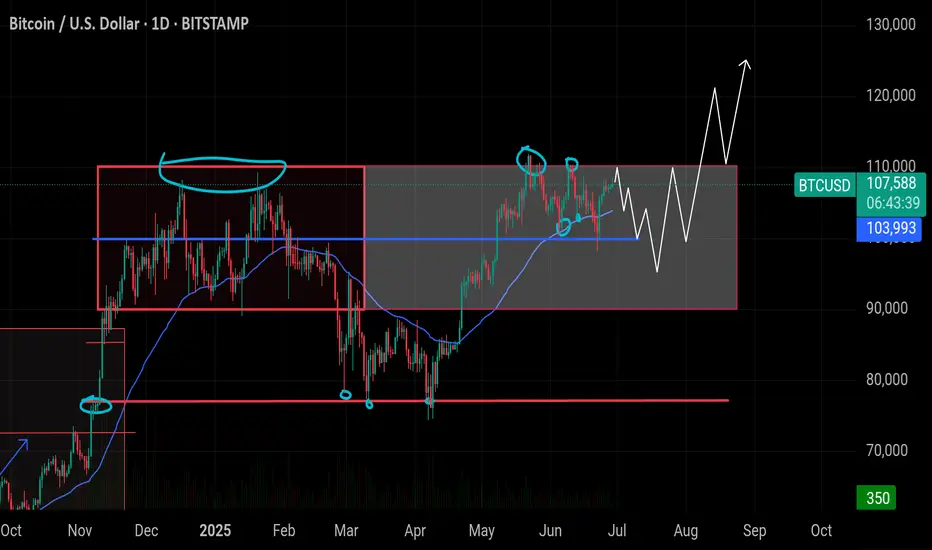
BTC is consolidating within a major structure for 224+ days. Current price action is forming a bull flag, signaling strong potential for a breakout toward $120,000–$150,000. Short-term volatility expected, but long-term trend remains bullish.
🔸 Support at $90,000–$93,000:
Strong confluence in this region including CME gap, liquidity pools, and previous structure support. Rejection from $113K could trigger a flush into this zone. Long setups should be considered here. Whales are accumulating.
🔸 Upside Target: $120,000 – $150,000
Long-term breakout from consolidation range aligning with historical accumulation patterns and macro indicators like M2 lag. Break of $113K with strength opens doors to $120K+. Clean structure with confirmed support will fuel rally continuation.
🔸 Risk Level at $88,000:
If BTC breaks below $88K with volume and closes under structure, it would invalidate the bull flag scenario short-term and signal deeper correction.
🔸 Outlook:
Monitor price reaction near $113K. Prepare for fakeout and potential sweep into $90K–$93K zone. Place laddered long orders in that range for optimal R:R. If dip occurs, treat it as a gift entry. No bearish outlook unless macro conditions shift drastically. Momentum remains upward.
BTCUSD.PI trade ideas
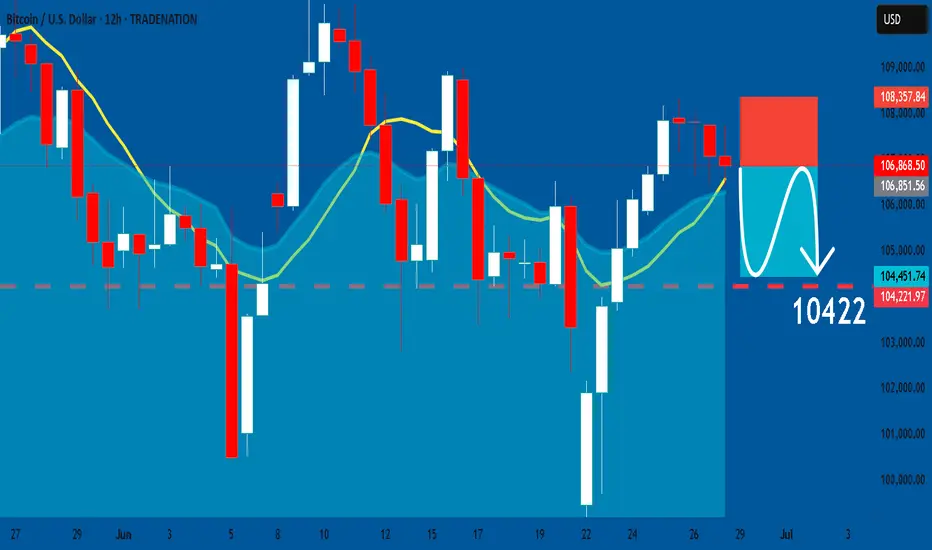
BTCUSD: Bearish Continuation & Short Signal
BTCUSD
- Classic bearish pattern
- Our team expects retracement
SUGGESTED TRADE:
Swing Trade
Sell BTCUSD
Entry - 10686
Stop - 10837
Take - 10422
Our Risk - 1%
Start protection of your profits from lower levels
Disclosure: I am part of Trade Nation's Influencer program and receive a monthly fee for using their TradingView charts in my analysis.
❤️ Please, support our work with like & comment! ❤️
BTCUSD is on a downtrendFrom the chart and from the technical analysis, we will see that btcusd is about to fall to 99000 or below. So, its time we enjoy btc as trader.
Reasons;
1] In 4 hr, we can see a third trendline is about to touch which is signal for sell.
2] Also, at the same point you can still see a horizontal resistance line, which is a signal for sell.
3] If the trendline below is broken, its also a signal to sell.
Always wait for a confirmation and trade responsibly. Thanks and don't forget to follow me for more good analysis.
A run down to the sea of stop loss before it goes up again?We could see a potential correction as we are seeing a double top with a temporary loss of momentum to the upside according to the RSI and volume. It's a valid trade until Trump says otherwise.
CHECK BTCUSD SIGNAL READ CAPTAINsell Setup)
Entry Zone: Around 107200.00 \107000.00
Stop Loss: 108000.00
Take Profits:
TP1: ~106400.00
TP2: ~105400.00
Final Target: 104600.00

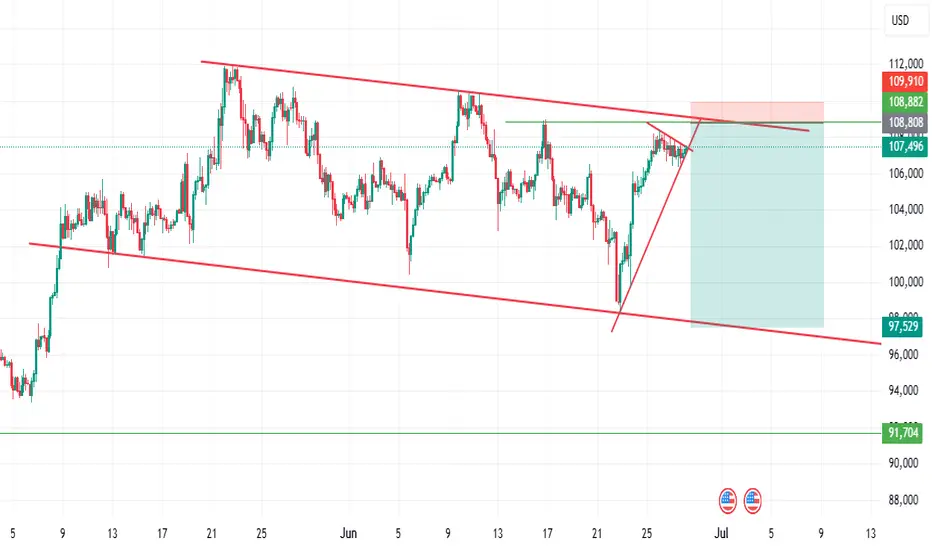
BTC/USD – Critical Reversal or Breakout?Bitcoin is currently trading around $107,500, pressing against the upper boundary of a rising wedge on the 1H and 4H charts. The structure remains fragile, with weakening momentum and conflicting signals between short and mid-term indicators.
📌 Scenario 1 – Bearish:
The current move likely completes wave (b) of an ABC correction.
Price has reached ~0.735 retracement at $108,358.
Breakdown of wedge support (~$104,600) could activate wave (c) toward $101K–$98K, or even the 1.618 extension to $86,000 (seen on daily).
📈 Scenario 2 – Bullish Alternate:
If BTC breaks and closes above $108,500, with volume, we may have invalidation of wave (b).
This opens the door for a wave (5) extension toward $113,000.
🔍 Key Indicators:
RSI on 1H is weakening, under 50.
OBV is flat – no accumulation spike.
QQE shows Buy signals but lacks follow-through.
Volume remains unconvincing for continuation.
🎯 Conclusion:
BTC is at a make-or-break level. A clean breakout and retest above $108.5K flips the structure bullish. Until then, wedge breakdown is the higher-probability play. Watch the $104.6K zone closely for direction confirmation.

Bitcoin sell short bigFirst, we are waiting for confirmation of the twin ceiling. After the support of 72,000 is broken, we will move towards 39,000.

BTCUSD LONG BULLISH FLAG📊 BTCUSD Trade Setup – 15m Chart
🔔 Shared by RKZ FX SIGNAL
We're currently monitoring a bullish setup forming inside a descending channel. Price is showing signs of accumulation near the demand zone around 106,640 – 106,700, with a potential bullish break from the falling wedge structure.
🟢 Trade Idea (Potential Buy Setup):
Entry Zone: Around 106,650 – 106,700
Stop Loss: Below 106,326 (below liquidity & demand zone)
Take Profit: Targeting supply zone between 107,980 – 108,250
Risk to Reward Ratio: ~1:3
🧠 Analysis Notes:
Price has tapped into a fresh demand zone and shown a short-term bullish reaction.
Still inside the descending channel, but momentum is building for a breakout.
Confirmation will be stronger once price breaks the midline and retests the top boundary as support.
🔔 Wait for price action confirmation at entry zone before entering. Avoid early entries.

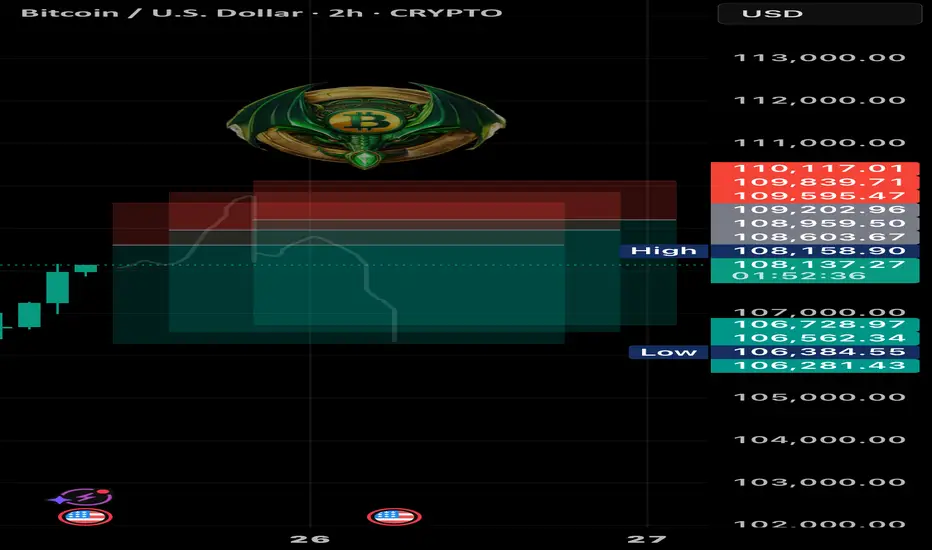
BTC SHORT TP: 106,300 25-06-2025Let’s be real — what’s coming looks like pure manipulation 😮💨
Setting a SHORT between 108,550 – 109,250, aiming for 106,200 – 106,550, with an average 3.3 RR.
🕑 Timeframe: 2H
⏳ Duration: 20–30 hours
Context: If you see a massive green candle… that’s not strength — that’s the short signal. Stops are pretty obvious in this kind of setup. Classic trap vibes loading.
If the move doesn’t happen within the estimated time, the setup is invalid.
We don’t use indicators, we’re not out here drawing lines or cute little shapes — I just give you a clean trade.
Bull-Flag within a Bull Flag means Exponential gains coming ???As of Friday, June 27, 2025, at 9:41:55 PM PDT, here's an analysis of Bitcoin:
Current Price & Performance:
Last Price: Approximately $107,280.10 (as of June 27, 2025)
Recent Performance: Bitcoin has been showing resilience above the $105,000 mark and has consolidated in a range between $100,000 and $110,000 recently, after hitting an unprecedented price of around $111,814 last month.
Bull Flag in a Bull Flag Pattern (Nested Bull Flags)
A "bull flag" is a bullish continuation pattern characterized by:
Flagpole: A sharp, strong upward price move.
Flag: A period of consolidation or slight retracement that forms a rectangular or parallelogram shape, typically with lower trading volume.
Breakout: A resumption of the uptrend with a strong move out of the flag, ideally on increased volume.
A "bull flag in a bull flag" (or nested bull flag) implies that a smaller bull flag is forming within a larger, ongoing bull flag pattern. This suggests a powerful, sustained uptrend where even the pauses for consolidation are themselves exhibiting bullish continuation characteristics.
Identifying this for Bitcoin:
To identify this pattern in Bitcoin, we would look for the following on a daily or higher timeframe chart:
1. The "Larger" Bull Flag:
Flagpole (Large): Bitcoin's overall parabolic run from its post-bear market lows to its recent all-time highs (e.g., $111,814). This multi-month or multi-year rally constitutes the significant "flagpole."
Flag (Large): The current consolidation phase Bitcoin is undergoing after reaching those all-time highs. This "flag" would be characterized by a broad trading range (e.g., between $100,000 and $110,000, or a wider range after its initial peak). This large flag would be a period of consolidation following the massive flagpole.
2. The "Smaller" Bull Flag (Nested within the larger one):
Flagpole (Small): Within this larger consolidation "flag," Bitcoin might experience shorter, sharper upward impulses. For example, if Bitcoin has a sudden 10% surge from $100,000 to $110,000 within the larger flag. This specific surge acts as the "flagpole" for the smaller flag.
Flag (Small): Following this smaller surge, Bitcoin then enters a mini-consolidation phase (a few days to a week or two), forming a tighter "flag" pattern within the broader trading range. This would be a slight downward or sideways channel on lower volume.
Breakout (Small): A breakout from this smaller flag would see Bitcoin push higher within the larger consolidation range, perhaps targeting the upper boundary of the larger flag (e.g., aiming for $110,000 or new highs).
Current Bitcoin State and the Pattern:
Based on recent market commentary and price action:
Overall Context: Bitcoin is in a long-term bull market, having recovered significantly from previous lows and testing all-time highs. This broad trend provides the context for large "flagpoles."
Larger Flag: Bitcoin's current consolidation around the $100,000-$110,000 zone, after its surge to $111,814, clearly fits the description of a large "flag" forming after a substantial "flagpole." This is a critical consolidation phase for the overall bull run.
Smaller Flag (Potentially Forming): Recent news mentions that Bitcoin surged over 10% since last Sunday (early June 2025) and has been consolidating between $100,000 and $110,000 for over three days. This description fits the start of a nested bull flag:
The 10% surge could be the smaller flagpole.
The consolidation for over three days within the $106,390 - $108,384 range after that surge could be the smaller flag formation.
If this smaller flag resolves to the upside, it would push Bitcoin towards the upper boundary of the larger flag ($110,000 to $112,000) or beyond.
Significance of a Nested Bull Flag:
Strong Underlying Momentum: The presence of a smaller bull flag within a larger one suggests exceptionally strong buying pressure and conviction among bulls. Even during periods of overall consolidation, traders are quick to accumulate on dips, leading to these smaller continuation patterns.
Layered Confirmation: It provides multiple layers of bullish signals. A breakout from the smaller flag reinforces the bullish bias within the larger flag, increasing the probability of an eventual breakout from the larger pattern.
Entry Opportunities: For traders, the smaller flags offer shorter-term entry opportunities within a larger trend, allowing them to capitalize on mini-surges as the broader consolidation unfolds.
Caution:
Confirmation is Key: Like all chart patterns, bull flags require confirmation. For the smaller flag, watch for a decisive breakout above its upper trendline on increasing volume. For the larger flag, the ultimate confirmation would be a sustained break above its all-time high resistance (around $112,000) on significant volume.
Volatility: Bitcoin is known for its volatility, and even continuation patterns can have false breakouts or deeper retracements than anticipated.
Volume: Volume confirmation is crucial. The "flag" portion should ideally show decreasing volume, while the "breakout" should be accompanied by a surge in volume.
In summary, Bitcoin appears to be currently in a large consolidation phase which could be interpreted as a significant "bull flag." Within this larger "flag," recent price action suggests the potential formation of a smaller, nested bull flag, where a recent mini-surge (small flagpole) is followed by a short consolidation (small flag). This indicates strong underlying bullish sentiment, with market participants potentially looking for a push towards the upper boundaries of the broader consolidation range.
This analysis is based on technical patterns and current market information. It is not financial advice. Always perform your own due diligence and consult with a financial professional before making investment decisions, especially in highly volatile assets like cryptocurrencies.

Unusual situation - Will you short BTCUSD?Going short is not the first thought when talking about BTCUSD, yet the 3 recent lower highs together with an "evening star" pattern are saying exactly that.
Will you take this offer?
What do you think?
Comment below, share your thoughts and analysis!!
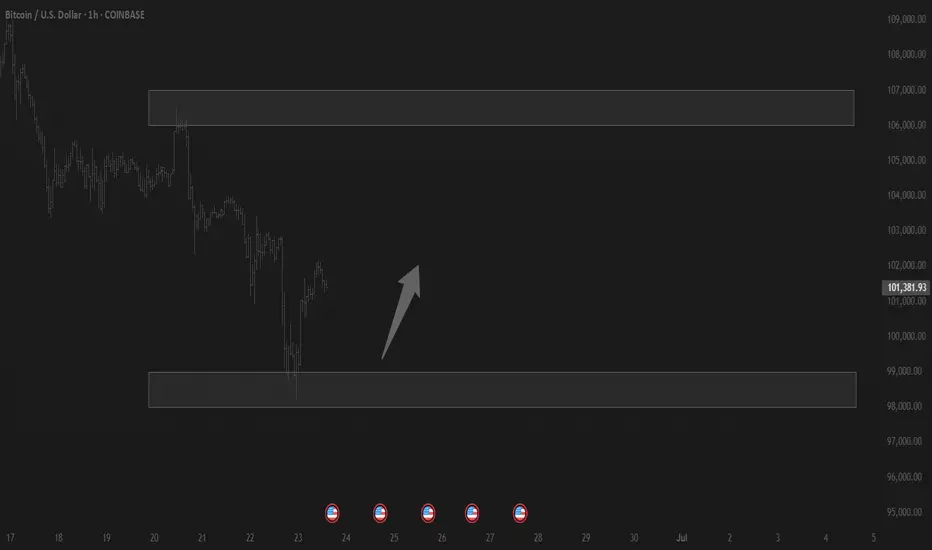
Market next target ⚠️ Disruption & Analytical Weaknesses:
1. Support Zone Already Broken (Wick Penetration):
The candlestick wick clearly pierced the support level drawn on the chart.
This indicates that buyers are weak at that level — the support is not holding firmly.
Relying on this support for a bullish bias is risky, as it may soon turn into resistance.
2. Volume Confirms Weakness, Not Strength:
The bounce from the support zone happens on low or declining volume, suggesting lack of strong buying interest.
A legitimate bullish reversal should be backed by a volume surge — here, that’s absent.
3. False Sense of Recovery:
The analysis shows arrows projecting straight up to the “Target” level, implying a smooth bullish recovery.
This is unrealistic given the recent choppy price action and repeated failures to hold gains above 107,200.
Price action suggests uncertainty or distribution, not clean bullish momentum.
4. Tight Range and High Volatility Ignored:
Price has been ranging between ~106,400 and ~107,600 with rapid whipsaws.
This kind of structure is often indicative of indecision, and setting a clear directional target without breakout confirmation is premature

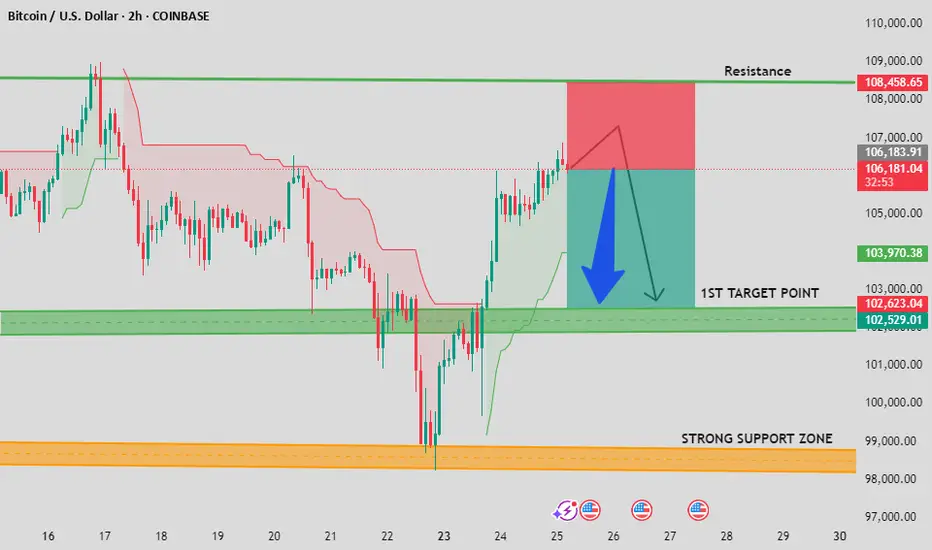
BTC/USD Resistance Rejection + Bearish Structure FormingBitcoin has reached a strong resistance zone near $107,500–$108,500, showing signs of rejection. Based on the 2H chart, price has formed a bearish pattern after a sharp rally, suggesting a potential short opportunity.
📊 Technical Confluence:
Resistance zone holding firm
Bearish engulfing candle at top
Overbought conditions + potential reversal
Price breaking back below local support
🔽 Target Zones:
1st Target: $102,500 – $102,600
Final Target (Strong Support Zone): $98,500 – $99,500
🕒 Watch for confirmation on lower timeframes before entry. Risk management is key.
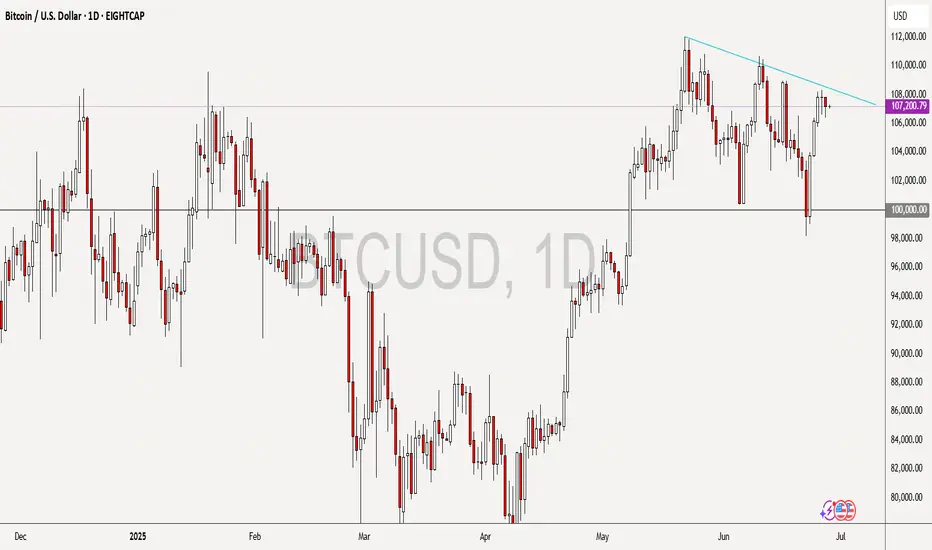
BITCOIN SHORT FROM RESISTANCE
BITCOIN SIGNAL
Trade Direction: short
Entry Level: 107,066.16
Target Level: 99,786.09
Stop Loss: 111,861.76
RISK PROFILE
Risk level: medium
Suggested risk: 1%
Timeframe: 1D
Disclosure: I am part of Trade Nation's Influencer program and receive a monthly fee for using their TradingView charts in my analysis.
LIKE AND COMMENT MY IDEAS

BTC: neutral case analysisBITFINEX:BTCUSD
Hello
Based on last 3 bull cycles and bear cycles, I did some calculations and this pattern is the result of it.
Take it with a pinch of salt, this might not even be close, but just past data gives me this fractal.
Here are the peak Bitcoin (BTC) prices for the years you mentioned:
2013: $1,156
2017: $19,497
2021: $67,566
We can now treat these as the values of the quadratic function:
a=1156 (for year 2013)
b=19497 (for year 2017)
c=67566 (for year 2021)
However, to apply the formula:
Price(x) = a⋅x2 + b⋅x + c
Using a quadratic fit to the BTC peak prices in 2013, 2017, and 2021, we get the following estimated prices:
2017: $19,497 (matches actual)
2021: $67,566 (matches actual)
2025: $145,363
Above is the AI calculation, I think it is about right.
Happy trading
Cheers

BTCUSD Analysis | Bearish Setup Unfolding?Bitcoin is trading within a descending channel, respecting lower highs and lower lows. The recent price action shows a sharp bounce from the $98,600 support zone, but the bigger picture still hints at potential downside.
🔍 Key Technical Insights:
Descending Channel remains intact – structure suggests bearish continuation.
Price bounced from $98,626 support, but is struggling below key resistance at $108,622.
A possible lower high formation near $106K–$107K could trigger the next drop.
Bearish projection remains valid if price fails to break above the descending trendline.
🟢 Upside Scenario: If bulls manage to break above $109K resistance, we could see a bullish reversal.
🔴 Downside Target: If the bearish setup confirms, we may revisit the $98,000–$99,000 support area once again.
📌 Plan Accordingly:
Wait for price action confirmation near resistance. Patience pays in volatile zones like this!
#BTCUSD #Bitcoin #CryptoAnalysis #TradingView #BTCUpdate #CryptoTrader #TechnicalAnalysis

BTCUSD: Minimum target for this Cycle is 150,000Bitcoin turned neutral again on its 1D technical outlook (RSI = 52.882, MACD = -410.600, ADX = 22.509) as it recovered the losses of the last 2 days thanks to the Truce announcement between Israel and Iran. The long term picture couldn't be more bullish however as it hasn't even hit the bottom red zone of the Logarithmic Growth Curves model. According to the Time Cycles that mark each Cycle High, the Top for this Cycle is estimated to be between October and December. By October 2025, the top of the first profit taking zone (lightest pink) would be $150,000. That is technically the bare minimum of Top that should be expected based on the current LGC model. Technically it can even hit $200,000 but fundamentals have to help a lot in this scenario (adoption, ETFs, rate cuts).
## If you like our free content follow our profile to get more daily ideas. ##
## Comments and likes are greatly appreciated. ##

Bitcoin's Bullish DriversThe four bullish drivers behind Bitcoin's rally:
1.Institutional involvement: BlackRock and other institutions have accumulated large positions through ETFs, with OTC inventory declining, creating a scarcity effect in the market.
2.Policy tailwinds: Escalating expectations of Federal Reserve rate cuts have enhanced Bitcoin's attractiveness under low-interest-rate environments.
3.Regulatory breakthrough: China's Guotai Junan International has obtained regulatory approval, opening a compliant channel for Chinese capital.
4.Technical support: The 50-day moving average has broken above the 200-day moving average, forming a "golden cross" that confirms the long-term upward trend.
BTCUSD
buy@106000~107000
SL:105000
TP:108000~109000
I am committed to sharing trading signals every day. Among them, real-time signals will be flexibly pushed according to market dynamics. All the signals sent out last week accurately matched the market trends, helping numerous traders achieve substantial profits. Regardless of your previous investment performance, I believe that with the support of my professional strategies and timely signals, I will surely be able to assist you in breaking through investment bottlenecks and achieving new breakthroughs in the trading field.

BTC Rebounds After 100000 Drop, Eyeing Short at 109500 Resistanc📈 BTC Rebounds After 100000 Drop, Eyeing Short at 109500 Resistance
BTC dropped below the 100000 threshold 🔻 and then rebounded near 98000 🔺. This movement is related to the decline of DXY and the reduction of geopolitical risks. Now, BTC is challenging the 110000 level 🔼. The overhead resistance is around 109500. First - time tests of the 110000 level typically trigger pullbacks, so we favor short positions here 📉
🚀 Sell@109500 - 108500
🚀 TP 107500 - 106500 - 105500
Accurate signals are updated every day 📈 If you encounter any problems during trading, these signals can serve as your reliable guide 🧭 Feel free to refer to them! I sincerely hope they'll be of great help to you 🌟 👇

Trading balanceTrading balance The price of the asset has rebounded from the balance zone. With the prospect of growth into the resistance zone.
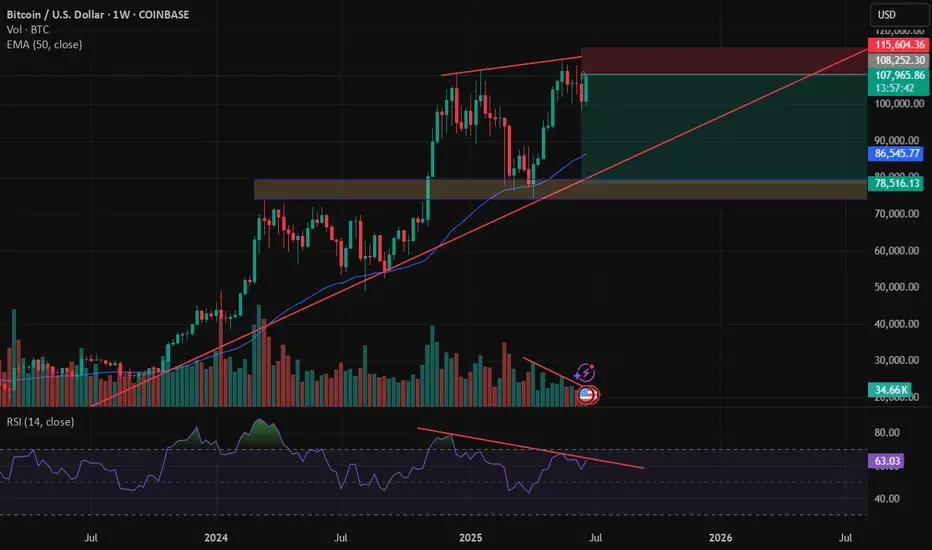
BITCOIN Trump and the 1D EMA100 saved the day!Bitcoin (BTCUSD) rebounded yesterday on its 1D EMA100 (green trend-line) and along with Trump's truce announcement between Israel and Iran, it sent the market into a buying frenzy and back above the $105k mark.
Technically, the 1D EMA100 isn't something to be ignored as since the November 2022 market bottom, each Bullish Leg (Channel Up) that started had a contact (or near) with it that resulted into a considerable bullish extension.
The 1st Channel Up even breached below it, but after rebounding, it reached the 1.382 Fibonacci extension before the next correction. The 2nd Channel Up rebounded exactly on the 1D EMA100, and reached the 1.618 Fibonacci extension. The 3rd Channel Up almost hit the 1D EMA100 and then rebounded to the 2.0 Fibonacci extension.
It is obvious that the pattern follows a progression and each Fib extension peak is higher than on the previous Channel Up. As a result, it is not unlikely to see a High even above the 2.0 Fib ext ($168k) on the current (4th) Channel Up, however on the short-term we would still welcome the 1.382 Fib 'minimum' expectation, targeting $130000.
Do you think we should at least be expecting that? Feel free to let us know in the comments section below!
-------------------------------------------------------------------------------
** Please LIKE 👍, FOLLOW ✅, SHARE 🙌 and COMMENT ✍ if you enjoy this idea! Also share your ideas and charts in the comments section below! This is best way to keep it relevant, support us, keep the content here free and allow the idea to reach as many people as possible. **
-------------------------------------------------------------------------------
💸💸💸💸💸💸
👇 👇 👇 👇 👇 👇

#202526 - priceactiontds - weekly update - bitcoinGood Day and I hope you are well.
#btcusd - bitcoin
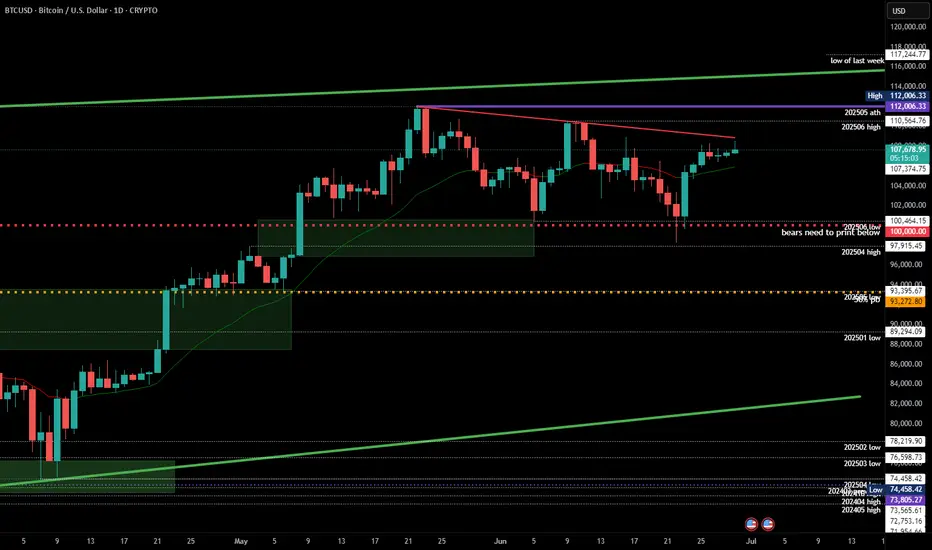
comment: Neutral since bears fumbled it again. Range is clear, don’t have much else to say about this. Bulls want 113k+ and bears need a strong daily close below 100k for more downside.
current market cycle: trading range
key levels: 100k - 115k
bull case: Bulls are still hopeful, that’s why we are still above 110k but the next touch could break it and I doubt many will hold long or scale into new ones there. Best bulls can get right now is to go sideways for longer and stay above 100k. I mean… Staying above 100k is as bullish as it get’s if you be honest. Same as last week since nothing has changed for the bulls. Trading range since mid May.
Invalidation is a strong daily close below 100k
bear case: Bears fumbled it again. Strong daily close below 100k or we won’t go lower. Right now odds favor the bears to go down from 107k to 100k but need more selling pressure.
Invalidation is above 110k
short term: As neutral as can be.
medium-long term - Update from 2025-06-29: Strong daily close below 100k will be the confirmation for more downside. First target below 100k is 97k the breakout retest and after that is the 50% retracement around 93k. I have no bullish for the next weeks/months. Once the gap to 97k closes we are likely in a bear trend again and I expect to hit at least 85k over the summer.
BTCUSD: Bulls Are Winning! Long!
My dear friends,
Today we will analyse BTCUSD together☺️
The price is near a wide key level
and the pair is approaching a significant decision level of 107,630.73 Therefore, a strong bullish reaction here could determine the next move up.We will watch for a confirmation candle, and then target the next key level of 108,207.06.Recommend Stop-loss is beyond the current level.
❤️Sending you lots of Love and Hugs❤️
