BTC Consolidates Above Pivot – Bullish Momentum Toward 113,770?BITCOIN OVERVIEW
Crypto Breakout or Crash? Powell's July Message Becomes the Deciding Factor
Federal Reserve Chair Jerome Powell’s testimony on Capitol Hill has intensified the uncertainty surrounding risk assets.
He emphasized that while inflation has eased significantly since mid-2022, it remains “somewhat elevated”, and the Fed is in no rush to shift its policy stance.
This leaves markets with a binary outcome: crypto breakout or macro-driven pullback—and July may be the turning point.
TECHNICAL OUTLOOK – BTC/USD
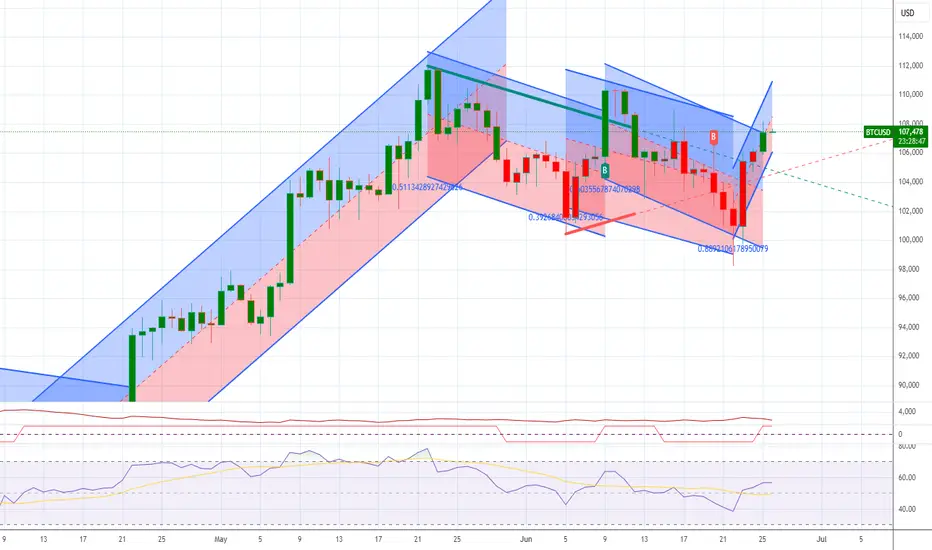
Bitcoin remains in bullish momentum, having stabilized above the pivot level at 107,750.
The price is currently pushing toward the key resistance zone between 108,950 and 110,360.
A breakout above this zone would likely lead to continuation toward the next ATH target at 113,770.
However, consolidation is expected between 108,950 and 106,320 until a breakout occurs.
Key Levels
Pivot Line: 107,750
Resistance: 108,950 → 110,360 → 113,770
Support: 106,320 → 104,150
BTCUSD.PI trade ideas

BTC Looking for a Wave 2 Reset Before the Real MoveBITSTAMP:BTCUSD looks like it just wrapped a clean ABC correction and kicked off a fresh 5-wave impulse. We’ve probably topped out on wave 1 heading into the weekend, Stoch RSI is flashing overbought, price is hitting resistance just under 108.3K, and we’re also seeing some bullish divergence creeping in.
I’m expecting a pullback from here, ideally into that 0.5–0.618 retrace zone (103.2K–104.4K). That would line up well with the mid-channel and EMA support. From there, we could be set up for a proper wave 3 breakout (as long as we don't get any more surprise tariffs or wars).
Fed still leaning dovish into Q4, even with some Q3 inflation and tariff noise. Rate cut odds ramp into Sept/Dec, so bigger picture looks constructive. In my eyes, the longer the FED holds off on these cuts, the longer this cycle extends.
Key zones I’m watching:
Support: 105.3K > 103.2K > 100.8K
Resistance: 108.3K > 112K > 114.5K+
If we dip and hold structure, I’ll be watching for confirmation to load into wave 3.

Bitcoin Order Book - How To Trade ItBitcoin Order Book Analysis | Massive BTC Liquidity Zones You Need to Watch
In this video, we break down the Bitcoin (BTCUSD) order book and highlight the biggest buy and sell levels currently driving market sentiment. These are the exact price zones where whales and institutions are placing large orders—often creating powerful support and resistance that can trigger breakout or reversal setups.
In This Breakdown:
• Where major buy/sell walls are forming in the BTC order book
• How order book depth can predict short-term price direction
• Real-time liquidity pockets traders are watching now
• Key price levels to watch for possible long/short entries
This is a must-watch if you’re actively trading BTC and want to track where the smart money is stacking their positions.
⸻
Tools Featured:
• BTCUSD real-time chart
• Order book heatmap / depth
• Liquidity zone visualizations
• Volume profile overlays
• Sentiment Tool
⸻
Use this insight to position your trades around high-probability reversal or breakout zones. Comment your BTC target below, and follow for daily pro-level crypto insights.
⸻
#Bitcoin #BTCUSD #OrderBookAnalysis #BTCOrderFlow #WhaleActivity #LiquidityZones #CryptoTrading #PriceAction #CryptoTA #BitcoinStrategy

Cup and Handle Hello Traders 👋 — Hope you're having a strong start to the week!
Let's dive into the BTCUSD Daily Chart 📈 — we’re looking at a Cup and Handle setup that's matured beautifully.
🔵 Price carved out a clean rounded base (cup), followed by a consolidation handle right below resistance.
🟠 The 200 SMA is holding as dynamic support.
⚡️ A confirmed break above 109K could launch price toward 130K+, with clear Fibonacci extension targets in sight.
Key Zones:
Handle Support: 100,472
Breakout Line: 109,360
Main Target: 130,867
Extended: 136K–144K
Structure ✅ | Momentum Building ⚡ | Risk Managed 🎯
Stay sharp, stay patient. Structure first — breakout next.

BITCOIN'S BIG BOUNCEBitcoin’s daily chart shows a textbook liquidity sweep followed by a strong recovery. After dipping below the critical $100,000 psychological level late last week, price tagged a low around $99,000 before reversing sharply. This move likely shook out overleveraged longs and trapped breakout shorts – setting the stage for a high-volume bounce. Importantly, BTC reclaimed both the $100,716 horizontal support and the 50-day moving average – signaling renewed short-term bullish momentum.
Currently, Bitcoin is trading just below the key resistance level at $105,787 – a price zone that has repeatedly acted as a ceiling throughout June. A decisive breakout and close above this level would likely open the door to a move toward the $112,000 range highs. Until then, $105,787 remains the level to beat. If price rejects from here, the $100K zone becomes crucial once again – with $92,817 as the next major support below.
Volume has been supportive on the bounce, suggesting real demand stepped in on the sweep of the lows. For bulls to maintain control, they’ll want to see continued strength above the 50-day moving average and a clear break of resistance. For now, the structure looks constructive – but the next couple of daily closes will determine whether this was just a relief rally or the start of a broader continuation higher. We are basically trading between two key levels in a small range.

BTCUSD printing a bullish flag BTCUSD printing a bullish flag expected to make a all time high, entry with a buy stop above the last HH, RR .75: .75

Bitcoin H1 | Potential bounce off an overlap supportBitcoin (BTC/USD) is falling towards an overlap support and could potentially bounce off this level to climb higher.
Buy entry is at 106,532.50 which is an overlap support that aligns closely with the 23.6% Fibonacci retracement.
Stop loss is at 104,600.00 which is a level that lies underneath a swing-low support and the 38.2% Fibonacci retracement.
Take profit is at 108,808.50 which is a swing-high resistance that aligns with the 127.2% Fibonacci extension.
High Risk Investment Warning
Trading Forex/CFDs on margin carries a high level of risk and may not be suitable for all investors. Leverage can work against you.
Stratos Markets Limited (tradu.com ):
CFDs are complex instruments and come with a high risk of losing money rapidly due to leverage. 63% of retail investor accounts lose money when trading CFDs with this provider. You should consider whether you understand how CFDs work and whether you can afford to take the high risk of losing your money.
Stratos Europe Ltd (tradu.com ):
CFDs are complex instruments and come with a high risk of losing money rapidly due to leverage. 63% of retail investor accounts lose money when trading CFDs with this provider. You should consider whether you understand how CFDs work and whether you can afford to take the high risk of losing your money.
Stratos Global LLC (tradu.com ):
Losses can exceed deposits.
Please be advised that the information presented on TradingView is provided to Tradu (‘Company’, ‘we’) by a third-party provider (‘TFA Global Pte Ltd’). Please be reminded that you are solely responsible for the trading decisions on your account. There is a very high degree of risk involved in trading. Any information and/or content is intended entirely for research, educational and informational purposes only and does not constitute investment or consultation advice or investment strategy. The information is not tailored to the investment needs of any specific person and therefore does not involve a consideration of any of the investment objectives, financial situation or needs of any viewer that may receive it. Kindly also note that past performance is not a reliable indicator of future results. Actual results may differ materially from those anticipated in forward-looking or past performance statements. We assume no liability as to the accuracy or completeness of any of the information and/or content provided herein and the Company cannot be held responsible for any omission, mistake nor for any loss or damage including without limitation to any loss of profit which may arise from reliance on any information supplied by TFA Global Pte Ltd.
The speaker(s) is neither an employee, agent nor representative of Tradu and is therefore acting independently. The opinions given are their own, constitute general market commentary, and do not constitute the opinion or advice of Tradu or any form of personal or investment advice. Tradu neither endorses nor guarantees offerings of third-party speakers, nor is Tradu responsible for the content, veracity or opinions of third-party speakers, presenters or participants.

103 to 101K trade and reverse H&S patternMorning folks,
So, our Thu setup is done perfect, both targets are met and even more. Now we consider two different fast trades on BTC.
Now context remains bearish and 103K is rather strong 4H resistance area. So, first trade is scalp "Sell" from ~ 103K with "at least" target of 101K. In fact, choosing of 101K as a minimal target is based on the 2nd trade.
2nd trade is potential reverse H&S is sentiment on the market will start changing. But this is not the fact yet. That's why I place downside arrow here as well, if H&S will not be formed or start failing, BTC could drop lower so, downside trade might be even better.

BTC is sliding to around 73k as a minimum target to 43kIt's just starting a downtrend inside a big Correction
Major Res. @ 114,000
Major Support @ 43,000
My decision is to go short @ spot price / Take profits @ 73,000 - 43,000 / Stoploss @ 114,000 - 116,000
This recommendation is to 3 - 6 months investors.
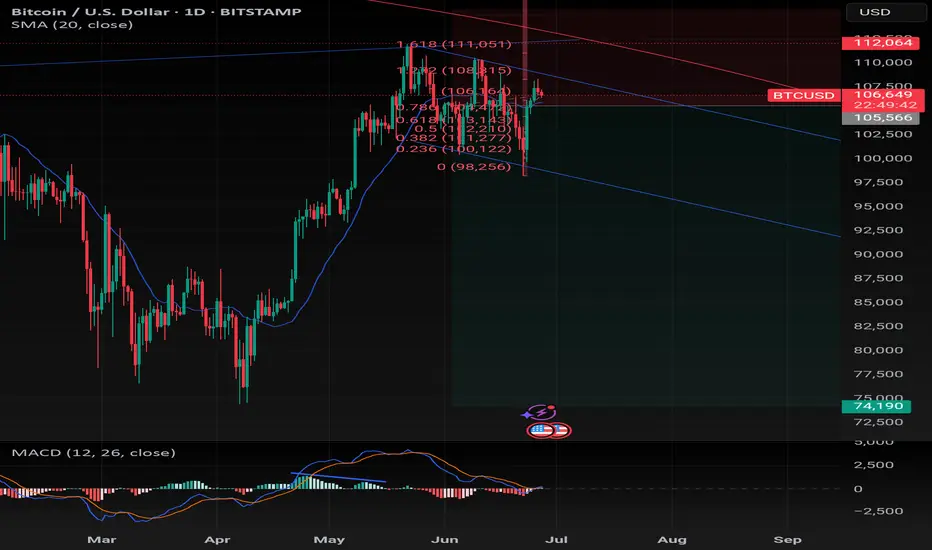
Bitcoin Top is In! Bear considerationsPrice has been carving out an unclear correction off the high. The recent structure has many squinting. Is it done or the calm before another wave of selling?
I am weighing two bearish scenarios here. One is more aggressive than the other. But both start with the same idea. No new high before another low.
Let’s start at the top.
The initial move down off the recent high could count as an impulse. Whether that is a wave 1 or a wave A is still up for judgment. Either way, that first leg sets a bearish tone at the larger degree.
Here’s where it gets interesting. The correction since then shows traits of a flat. A running one at the moment.
This opens the door to two active bearish projections:
A wave C collapse, implying a completed A B C correction and a downside resolution.
A wave 3 drop, for a possible top if this is an impulsive sequence.
That is the fork in the road. And it all hinges on the next move.
Right now, the smallest degree impulse off the low is doing some heavy lifting.
If that pivot holds and we only get an internal retracement like a micro wave 2, the door is still open for upside continuation.
But if that impulse gets invalidated, I would expect bears to press. First for a break below 100k, then toward the 95k area.
Here is how to think about it:
Hold the small impulse → Potential upside
Break the impulse base → Wave C or 3 likely underway
Context still leans bearish. Lower highs are still in play. But we are hunting a specific structure to confirm it.

BTCUSD short tradeAnalyst: Mosilar
BTC is trading near $107K with a key liquidity zone around $108,300 – $108,800. Max Pain for tomorrow’s options expiry sits at $102K.
Historically, BTC often gravitates toward Max Pain into expiry. A potential fade from the liquidity zone toward $104K and $102K could be in play.
Key Levels:
Liquidity Zone: 108,300 – 108,800
Volume Profile: 104,000
Max Pain: 102,000

BTC Rebounds After 100000 Drop, Eyeing Short at 109500 Resistanc📈 BTC Rebounds After 100000 Drop, Eyeing Short at 109500 Resistance
BTC dropped below the 100000 threshold 🔻 and then rebounded near 98000 🔺. This movement is related to the decline of DXY and the reduction of geopolitical risks. Now, BTC is challenging the 110000 level 🔼. The overhead resistance is around 109500. First - time tests of the 110000 level typically trigger pullbacks, so we favor short positions here 📉
🚀 Sell@109500 - 108500
🚀 TP 107500 - 106500 - 105500
Accurate signals are updated every day 📈 If you encounter any problems during trading, these signals can serve as your reliable guide 🧭 Feel free to refer to them! I sincerely hope they'll be of great help to you 🌟 👇

Bitcoin Drive up to 115k So currently BTC on the weekly and monthly is showing us a drive up to 115,700 then possibly seeing a correction major or minor then a drive up to 122k is what I am currently seeing at the moment
Kris Mindbloome Exchange
Trade Smarter Live Better

Market next target 📉 Disruption: Bearish Outlook Contradiction
1. Resistance Zone Rejection:
The price action is repeatedly failing near the 107,800–108,000 resistance zone.
The chart shows several long upper wicks, indicating strong selling pressure when BTC tries to move higher.
2. False Breakout Risk:
The recent bullish candle with a long lower wick could be a bull trap—designed to lure buyers before a reversal.
Price may retest the red box (support turned resistance) and fail to hold above it.
3. Volume Analysis:
Despite a small recovery, volume is not increasing significantly, which is not typical of a strong bullish move.
A lack of strong buyer volume could indicate exhaustion.
4. Lower High Structure:
The chart is still forming lower highs, a sign of a downtrend continuation unless it breaks above 108,000 convincingly.

Bitcoin Ready to Drop?Alright ladies and gentlemen after this nice Bitcoin run up is TIME to book profits if you still in the long trade cause this baby is about to drop.
Bulls don't stretch your luck too much, book your profits while you still have them.
What Bitcoin did was just extending its 1hr Bullish TIME Cycle that's all and it has an end so Bulls don't be greedy cause you're gonna be trapped.
Buckle up ladies and gentlemen and brace yourself for a wild ride down to $101000 once it gets there and most important HOW it gets there will tell us when and what the next move will be.
Take care everyone and enjoy the ride.
How about another RR2 Short?Lets try for a RR2 Sell..
Entry: 107100
SL: 108500
TP1: 106000
TP2:104800
See below for Reason and Full Analysis:

Bitcoin Looks StrongBitcoin continues to keep traders on their toes. After briefly sweeping the lows below \$100,000 earlier this week – an aggressive shakeout that likely liquidated overleveraged longs – it staged a sharp recovery. We’re now seeing price comfortably above the 50-day moving average, with back-to-back daily candles holding above the key \$105,787 level. That’s the type of reclaim bulls love to see.
What makes this move especially compelling is the volume profile. The bounce wasn’t some weak drift higher – it came on rising volume, suggesting real buyers stepped in to defend the lows. We’ve also seen consistent participation ever since – signaling that this might not just be a relief rally, but a potential shift in momentum.
Now the focus turns to resistance. The level to beat is \$112,000 – a zone that’s capped every major push this month. Break above that, and we’re no longer talking about recovering ground – we’re talking about new highs and possibly kicking off a much larger move. But before we get ahead of ourselves, this current consolidation near \$107K is healthy. If price can hang here for a bit, absorb selling pressure, and build a base – that’s often how the best breakouts form.
Of course, bulls don’t want to see \$105,787 lost again. That would make this whole move look like a failed breakout – and failed breakouts can get ugly fast. But for now, the technicals lean bullish. Bitcoin faked out the market, sucked in liquidity, and flipped key levels. Until proven otherwise, the bounce is valid – and the bulls have the momentum.

110K, maybe 112K at the bestMorning folks,
So, previous setup is done perfect, and BTC even reached 108K area. Now we think that upside potential is limited, at least in short-term. Price is coming to resistance area around 110K and previous top. Some intraday targets point on 112K area as well, but I wouldn't count now on something more extended.
The point is US Dollar stands at record monthly Oversold. So, its weakness in short term is limited as well. Besides, we're coming to very bumpy period of tariffs negotiations from 9th of July, debt ceil discussion and BBB voting, as early as tomorrow...
So for now, uncertainty and risk overcome the upside potential on BTC.

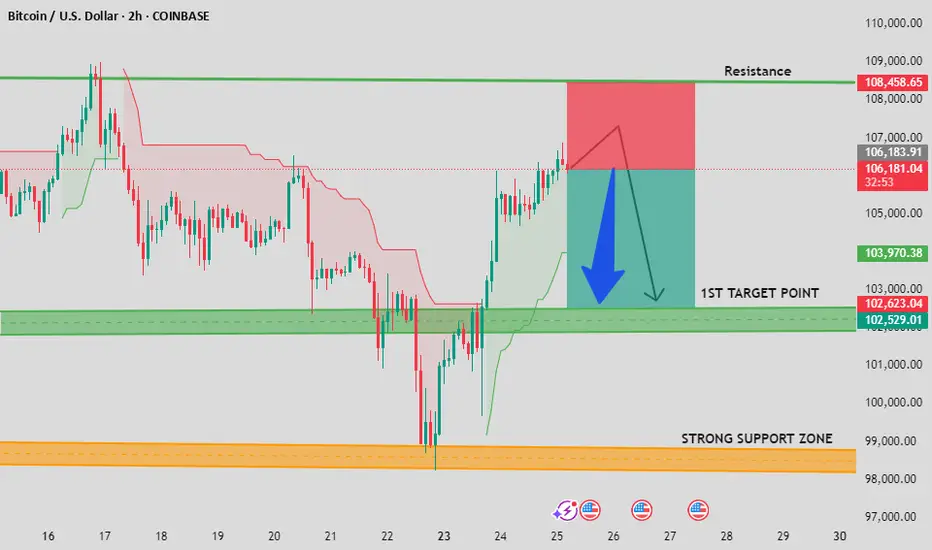
BTC/USD Resistance Rejection + Bearish Structure FormingBitcoin has reached a strong resistance zone near $107,500–$108,500, showing signs of rejection. Based on the 2H chart, price has formed a bearish pattern after a sharp rally, suggesting a potential short opportunity.
📊 Technical Confluence:
Resistance zone holding firm
Bearish engulfing candle at top
Overbought conditions + potential reversal
Price breaking back below local support
🔽 Target Zones:
1st Target: $102,500 – $102,600
Final Target (Strong Support Zone): $98,500 – $99,500
🕒 Watch for confirmation on lower timeframes before entry. Risk management is key.
BTC Short Re-entry with beautifull RR/Stop loss.Who follow our community know this trade story already- We got BE stoppage and now is most beautifull opportunity to make SHORT trade with very good RR / Stop loss.
If we will not see fast De-escalation with Middle East conflict we are going to 93k easy!
#BTCUSDT
We are reentering.
ENTRY: 105586
SL: 107262
TP: 96166.8
Follow me and you will see more and more good trade ideas
Please don't use big leverages and be carefull!

BTCUSD LongBTCUSD is now net long on the regression break.
I am not taking this trade as I already have a long position is in my long term holding.
Could BTC Hit \$160,000 Before 2026?
As of **June 2025**, Bitcoin trades near **\$61,000**. But based on historical patterns, market signals, and macro trends, here’s a bold scenario that could unfold:
**📊 Key Signals:**
* The **2024 Bitcoin halving** cut new supply by 50%.
* **Institutional Bitcoin ETFs** now control over 6% of circulating BTC.
* **U.S. rate cuts** expected Q3 2025 could trigger a flood of new capital.
* **Global unrest** pushing investors toward alternative stores of value.
**🔥 Mind-Blowing Prediction:**
If Bitcoin follows even half of its average post-halving surge, we could see **\$150,000 BTC before March 2026**.
That’s a **+145% gain from today’s price** — within historical norms:
* 📈 2020 post-halving: +300%
* 📈 2016 post-halving: +600%
**⚠ Risks remain:** regulations, market shocks, or ETF outflows could stall momentum.
**✅ Bottom Line:**
If Bitcoin’s history repeats (or even rhymes), \$150k is not impossible — and 2025 could be the setup year.
#Bitcoin #BTC #CryptoPrediction #CoinMarketCap

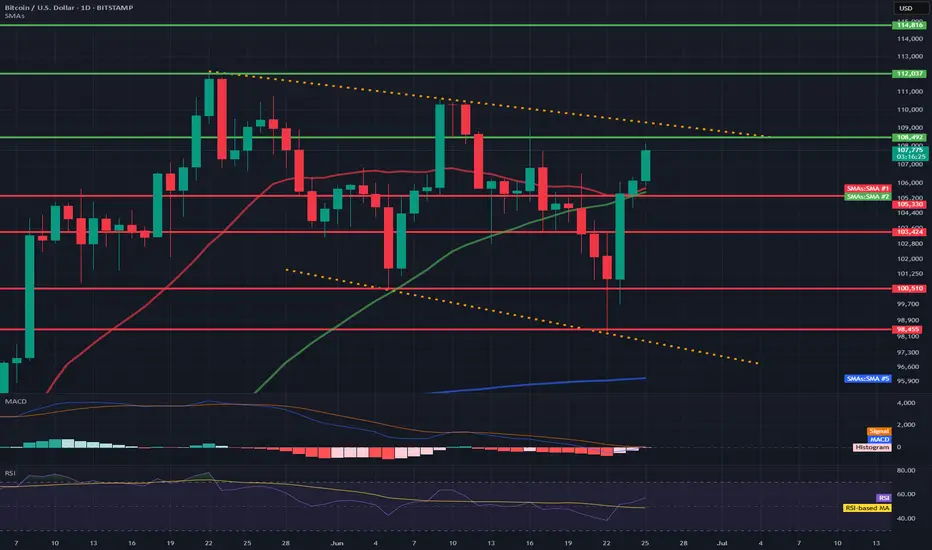
BTC/USD 1D Chart📊 1. Technical formation: Downtrend channel marked with orange lines
Upper trend line (resistance): ~108,200 – 110,000 USD
Lower trend line (support): ~98,455 – 97,000 USD
➡️ Such a formation usually ends with a breakout. The direction of the breakout will be key – currently, the price is testing the upper resistance line.
💵 2. Support and resistance levels
📈 Resistance:
108.202 – currently tested
112.037 – psychological level
114.816 – local top
📉 Support:
105.300 – SMA 50 + local support
103.424 – local lows
100.510 – key psychological support
98.455 – lower edge of the triangle
📉 3. Moving averages (SMA)
SMA 50 (green): currently as dynamic support (~105.300)
SMA 200 (blue): far below the price (~96.000), inactive in the short term
SMA 20 (red): price broke through it upwards – a signal of bullish strength
➡️ A bullish crossover took place between SMA 20 and SMA 50 → bullish signal.
📉 4. MACD (Momentum)
MACD line is approaching the intersection with the signal line from below.
The histogram is becoming less and less red → a potential intersection and a bullish crossover signal may occur any day now.
📉 5. RSI (Relative Strength Index)
Currently: 57.19
RSI is rising and approaching the overbought zone (70), but it is not overheated yet.
Exceeding 60 would be a signal of further bullish strength.
🔍 6. Volume and context
There is no volume marking on the candles, but:
The current bullish candle is strong and breaks through the key averages (SMA 20, 50).
This indicates buyer activity with technical support.
🟢 Bullish scenario (if a breakout occurs up)
A breakout above 108.200 with a close of the daily candle could open the way to:
112.037 (next resistance)
then even 114.816
🔴 Bearish scenario (false breakout)
A rejection from 108.200 and a drop below 105.300 → a possible return to:
103.424 or even 98.455 (lower triangle line)