BTC Short Re-entry with beautifull RR/Stop loss.Who follow our community know this trade story already- We got BE stoppage and now is most beautifull opportunity to make SHORT trade with very good RR / Stop loss.
If we will not see fast De-escalation with Middle East conflict we are going to 93k easy!
#BTCUSDT
We are reentering.
ENTRY: 105586
SL: 107262
TP: 96166.8
Follow me and you will see more and more good trade ideas
Please don't use big leverages and be carefull!
BTCUSD.PI trade ideas

Bitcoin are heading to 114k or 92k A quick little analysis on BTC, we can either push up higher to 114k levels breaking new highs is a must for price action to validate bill swing. However if we break a couple lows be prepared for 92k run down
Kris/ Mindbloome Exchange
Trade Smarter Live Better

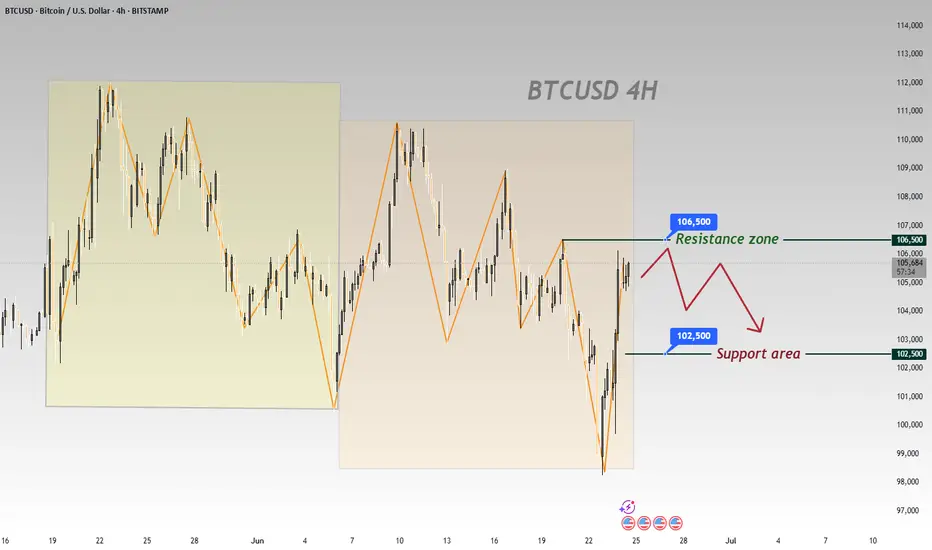
BTCUSD 4-Hour Chart Analysis: Range Bound with Bearish BiasFrom the 4 - hour chart of BTCUSD, the price movement shows obvious range - bound fluctuation characteristics 📊.
Currently, it is necessary to focus on the key resistance and support zones 🎯:
From a technical perspective, BTC is likely to oscillate repeatedly within the range in the near term 🔄, yet the overall trend leans bearish 🐻.
In the short term, opportunities for buying low and selling high within the range can be monitored 📈📉
⚡️⚡️⚡️ BTCUSD ⚡️⚡️⚡️
🚀 Sell@106500 - 105500
🚀 TP 104500 - 103500
🚀 Buy@102500 - 103500
🚀 TP 104500 - 105500
Accurate signals are updated every day 📈 If you encounter any problems during trading, these signals can serve as your reliable guide 🧭 Feel free to refer to them! I sincerely hope they'll be of great help to you 🌟 👇
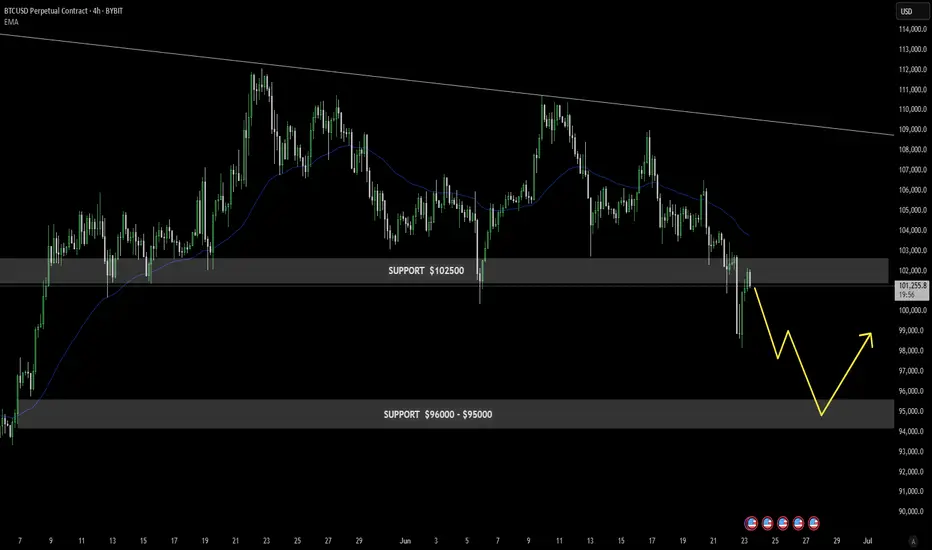
Bitcoin at the Edge: Breakdown or Bounce?Bitcoin is currently trading around $101,210, having failed to reclaim the $102,500 support zone, which has now flipped into resistance.
This rejection confirms continued bearish momentum, as reflected in the downward-trending EMA.
The next major area of interest lies between $96,000 and $95,000, where buyers previously stepped in. The chart suggests a probable move lower into this zone, followed by a potential bounce.
Unless BTC reclaims $102,500 with strong conviction, the short-term bias remains bearish, with traders eyeing the lower support for possible reversal or accumulation.
BTCUSD Bullish continuation pattern support at 101,780Trend Overview:
BTCUSD remains in a bullish trend, characterised by higher highs and higher lows. The recent intraday price action is forming a continuation consolidation pattern, suggesting a potential pause before a renewed move higher.
Key Technical Levels:
Support: 101,780 (primary pivot), followed by 100,380 and 98,184
Resistance: 109,170 (initial), then 111,600 and 114.140
Technical Outlook:
A pullback to the 101,780 level, which aligns with the previous consolidation zone, could act as a platform for renewed buying interest. A confirmed bounce from this support may trigger a continuation toward the next resistance levels at 109,170, 111,600, and ultimately 114,140.
Conversely, a daily close below 101,780 would suggest weakening bullish momentum. This scenario would shift the bias to bearish in the short term, potentially targeting 100.390 and 98,180 as downside levels.
Conclusion:
BTCUSD maintains a bullish structure while trading above the 101,780 support. A bounce from this level would validate the consolidation as a continuation pattern, with upside potential toward the 109,170 area. A breakdown below 101,780, however, would invalidate this view and suggest deeper corrective risk.
This communication is for informational purposes only and should not be viewed as any form of recommendation as to a particular course of action or as investment advice. It is not intended as an offer or solicitation for the purchase or sale of any financial instrument or as an official confirmation of any transaction. Opinions, estimates and assumptions expressed herein are made as of the date of this communication and are subject to change without notice. This communication has been prepared based upon information, including market prices, data and other information, believed to be reliable; however, Trade Nation does not warrant its completeness or accuracy. All market prices and market data contained in or attached to this communication are indicative and subject to change without notice.

$BTC Weekend Update - The Revenge of the BearsHello Fellow Gamblers,
Bears are in total control of BTC and are dragging the price lower and lower. Our 1st target has been hit so my eyes are now turning towards our 2nd target right above 93k. In the Video I talk about a possible Target 3 that could happen if we break below 93k.
- I am currently watching for a possible move up towards 103k to fill any FVG previously opened, I might be early but it is never early enough to be mentally prepared for it.
- I expect an accumulation to happen above 93k. That would lead us to a reversal and continuation of the bullish trend.
- Levels to watch: 93.1k, 97.5k,101k, 103.4k, 106.6k.

BTC Drowdown SELL SETUPIf we will not see fast De-escalation with Middle East conflict we are going to 93k easy!
SELL SETUP
ENTRY: 103364.0
SL: 107635.0
TP: 93384.0
Follow me and you will see more and more good trade ideas
Please don't use big leverages and be carefull!

BTCUSD 4-Hour Analysis – Sell Setup IdeaCurrently, the trend on BTCUSD is bearish. On the 4-hour chart, I’m watching for a reaction at the Balanced Price Range (BPR) zone. This area aligns with a daily Rebalanced Breaker (-RB), adding higher time frame confluence.
In addition to the BPR, there’s an Order Block (OB) within the same region, and a nearby swing high, which strengthens the case for a bearish reaction. If price respects this zone, I expect continuation to the downside targeting the 98,000 and the 96,000 price level.

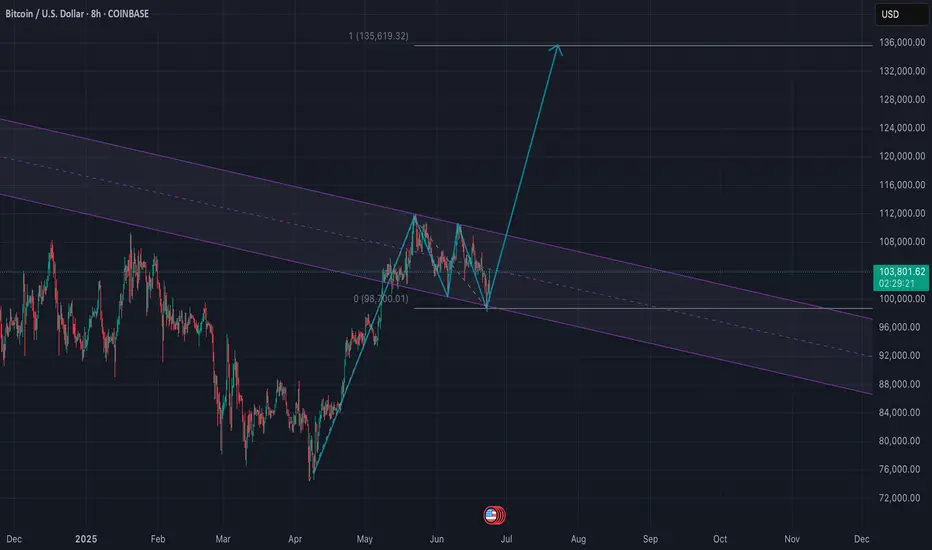
BTCUSD: Deja Vue from last halvingsWithin this Cycle we have a mixed price behaviour from the last 2 halvings , so if this continues ws should see a huge surge within the next few days/weeks. I expect Maximum Aug/Sept/Oct with 280-320 K . Mut we might get back to 80K next year. Be prepared

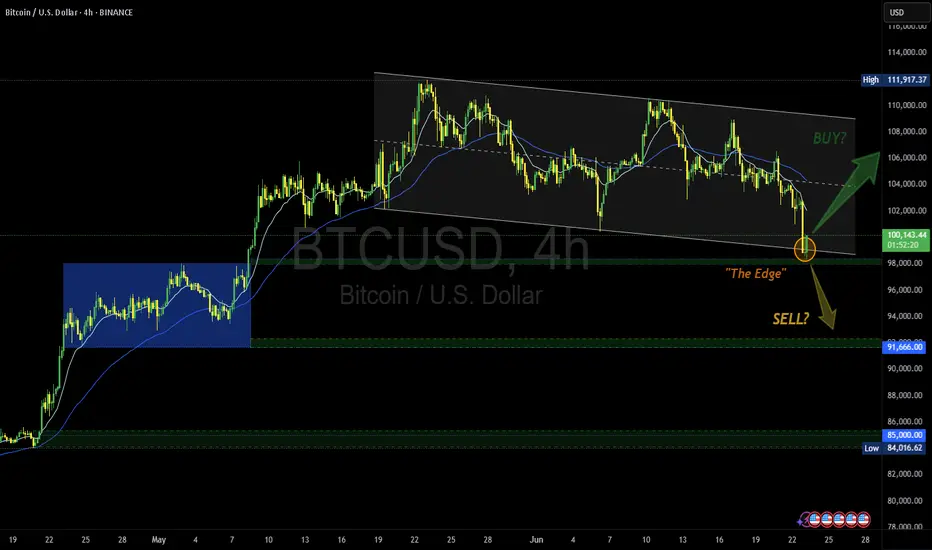
Another Edge - Decision time | Buy? or Sell? share your opinionTitle: BTCUSD: At The Edge – Decision Time Looms
Idea: Bitcoin is currently flirting with "The Edge"—a key decision zone near $98,000 where trend dynamics could shift sharply. After touching the lower boundary of a descending channel, BTC is testing support that could mark either a springboard for a bullish reversal or a trapdoor for further downside.
If bulls reclaim territory above the descending resistance line and push toward $104,000, we may see a trend breakout and renewed upside momentum. Confirmation with volume would strengthen the case for a long position, targeting the $111,917 level.
However, failure to hold "The Edge" could open the door to a swift move lower toward the $91,666 then $85,000 support zone, especially if accompanied by broader risk-off sentiment.
Trade Plan:
• Long above $100K with confirmation and strong volume;
target $111,917.
Stop below $97K.
• Short on breakdown below $97K with bearish momentum;
target $91,666.
Stop above $100K.
Watching: Volume spikes, macro news, and behavior around the channel boundaries.
🚀 Will Bitcoin bounce off the edge—or fall into the abyss?
#MJTrading #BTC #Bitcoin #Buy #long #chart #signal #forex
BTCUSD Short (Yesterday)I missed this one yesterday - BTC is now net short on the regression break. It bounced hard on the Iran/Israel news but is currently still short.

BTCUSD ATH Hunt is onBTCUSD will shoot up very soon. A bullish flag emerging right in time. Trump announces ceasefire and potentially stops WW3, what a Hero. Stock up on some of this coin you're gonna need it.

Next target, minimum $135kTo me this looks like a very obvious bull flag. Next target, $135k derived from the length of the flag pole and repeating it from the recent low.
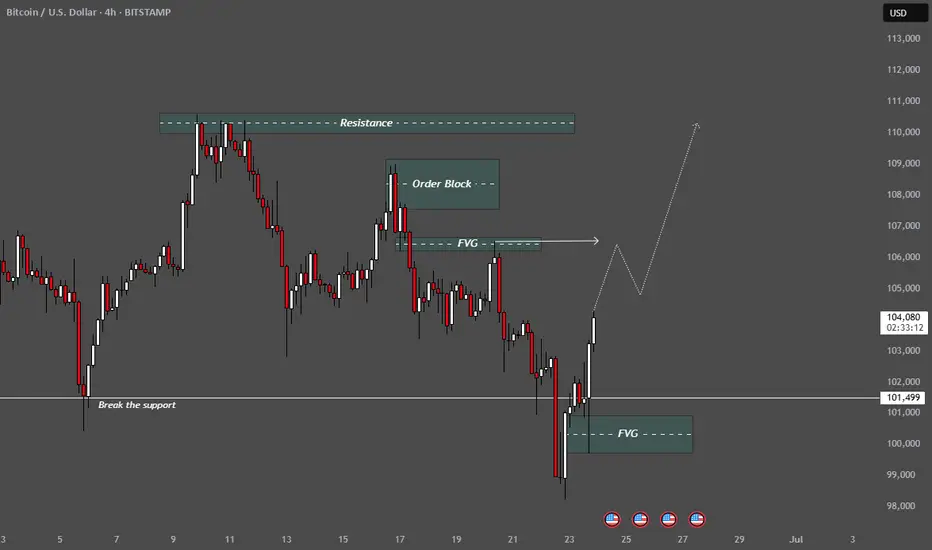
Liquidity grab below support, FVG and OB structures,1. Support & Resistance Levels
Resistance Zone (highlighted at the top):
Around the 110,000–112,000 range.
Previous Support (horizontal line at 101,499):
Labelled as “Break the support” — price had broken below it but is now pushing back above.
📦
Smart Money Concepts (SMC):
2. Order Block (OB)
Marked near 105,000: A key supply area where institutional activity likely occurred. Price may react here (retest or rejection).
3. FVG (Fair Value Gaps)
Two zones marked as FVG:
Lower FVG around 100,000–101,000: recently filled and acted as support.
Upper FVG just above 105,000: potential target zone before price pushes higher.
📈
Projected Price Path:
The dotted white line shows a bullish forecast:
Price breaks back above the previous support.
Pulls back into the FVG or OB.
Then rallies toward 110,000+ resistance zone.
🧠
Interpretation:
This analysis suggests a bullish reversal scenario based on:
Liquidity grab below support,
FVG and OB structures,
Expectation of institutional buying and upward continuation.
Bitcoin / U.S. Dollar 4-Hour Chart (BTCUSD)4-hour candlestick chart displays the price movement of Bitcoin (BTC) against the U.S. Dollar (USD) as of June 23, 2025, 03:45 PM CEST. The chart shows a recent sharp decline from a peak of approximately 104,443.81 USD to around 100,479.47 USD, with a current price of 102,035.20 USD, reflecting a 1.037.09% increase. Key levels include resistance around 104,000 USD and support near 100,000 USD, with notable volatility indicated by the candlestick patterns and a marked low point adorned with U.S. flags and a lightning bolt symbol.

Long Scenario Invalidated — Watching for Deeper Correction🚫 Long scenario is canceled!
Price started to break down, taking out the early June lows.
There's now a high probability of a deeper correction toward the 90,000–95,000 range.
I won’t short from current levels. The uptrend remains intact on the weekly chart. There are safer and more asymmetric opportunities in the market from a risk-reward perspective. For example, shorting the S&P 500 or going long on precious metals looks more attractive right now.
💡 General recommendation:
Stay away from high-volatility assets like Bitcoin, oil, and natural gas for now.
Wait for setups with tight stop-loss levels and clear structure before entering.

B/$We have already seen a level below $100,000.
I think there is still more to go before it turns up.
I don't see any resistance for a trend reversal at the moment.
So you can hold your short positions and just move your stop loss even lower.

BTCUSD Continues Falling DownBitcoin (BTC) price remains steady above a key support level, trading slightly above $106,000 at the time of writing on Friday. The uncertainty looms as geopolitical tensions between Iran and Israel show no sign yet of an exit strategy from either side.

BITCOIN Is this just a giant Bull Flag??Bitcoin (BTCUSD) saw a strong sell-off yesterday in the aftermath of the U.S. strike in Iran and fears of retaliation, but in later hours recovered some of the lost ground. The recovery is being extended into the Asian and early E.U. hours today and the emerging Channel Down pattern already draws strong similarities with the one in December 17 2024 - January 13 2025.
Both broke below their respective 1D MA50 (blue trend-lines) to form a Lower Low, which in the case of Jan 2025, it initiated a rebound that tested the All Time High (ATH) Resistance. See also how similar their 1D RSI patterns are, testing the same Support level too (41.20).
Given that this time the uptrend has been much shorter since the April 07 2025 Low, this Channel Down may be nothing but a giant Bull Flag in the middle of a standard Bull Cycle Leg. Until confirmed with a 1W candle closing above the ATH Resistance though, the medium-term Target is $111900.
Notice also the formation today of a 1D MA100/200 Bullish Cross, the first since November 13 2024.
So what do you think? Is $111900 your short-term Target? Feel free to let us know in the comments section below!
-------------------------------------------------------------------------------
** Please LIKE 👍, FOLLOW ✅, SHARE 🙌 and COMMENT ✍ if you enjoy this idea! Also share your ideas and charts in the comments section below! This is best way to keep it relevant, support us, keep the content here free and allow the idea to reach as many people as possible. **
-------------------------------------------------------------------------------
💸💸💸💸💸💸
👇 👇 👇 👇 👇 👇

WAW we ended up again following my imaginary lines .... I'm seeing a potential upside: if war accelerates government spending, it could push central banks to print more money — and that could be fuel for Bitcoin.
Historically, wars come with massive fiscal demands. Governments tend to ramp up military budgets, fund support packages, and stimulate their economies to manage instability — and that often leads to increased money printing.
More fiat currency in circulation typically leads to inflation or a devaluation of purchasing power. In that kind of environment, investors and everyday people start looking for stores of value outside of traditional currencies — like gold, real estate… and now, Bitcoin.
Bitcoin was literally born in response to central banks abusing the money printer. Its fixed supply — 21 million coins — makes it an attractive hedge against inflation and monetary debasement. If war accelerates global instability and fiscal irresponsibility, Bitcoin could benefit as a safe-haven asset.
So yes — war is tragic. But in purely macroeconomic terms, if it triggers massive government spending, printing, and inflation, it could send Bitcoin flying.

Bitcoin Tests Key Support-Healthy Correction Within Bull MarketHealthy Pullback, Strong Structure:
Bitcoin’s recent dip is a constructive correction within a broader bull trend, as it tests the critical $100,000–$105,000 support zone—a former resistance area from early 2025.
Institutional Demand Holds the Line:
Maintaining levels above the psychologically important $100,000 mark highlights continued institutional accumulation and reinforces the underlying strength of the trend.
Momentum Reset, Base Building:
This pullback has helped reset overbought conditions from the prior rally, laying the foundation for the next potential leg higher.
Key Levels to Watch:
Support: $100,000–$105,000
Breakout Trigger: A close above $108,000 would confirm uptrend continuation
Outlook: Bullish bias remains valid as long as support holds
Investor Opportunity:
With structure intact and downside contained, this consolidation presents a favorable risk-reward setup for long-term investors looking to position ahead of a potential breakout.
#Bitcoin #BTC #CryptoMarket #TechnicalAnalysis #SupportAndResistance #BullMarket #RiskReward #InstitutionalBuying #MarketOutlook #PriceAction

BITCOIN SENDS CLEAR BULLISH SIGNALS|LONG
BITCOIN SIGNAL
Trade Direction: long
Entry Level: 104,672.03
Target Level: 107,484.65
Stop Loss: 102,785.72
RISK PROFILE
Risk level: medium
Suggested risk: 1%
Timeframe: 3h
Disclosure: I am part of Trade Nation's Influencer program and receive a monthly fee for using their TradingView charts in my analysis.
✅LIKE AND COMMENT MY IDEAS✅

BITCOIN BEARS WILL DOMINATE THE MARKET|SHORT
BITCOIN SIGNAL
Trade Direction: short
Entry Level: 105,952.89
Target Level: 102,605.64
Stop Loss: 108,184.39
RISK PROFILE
Risk level: medium
Suggested risk: 1%
Timeframe: 4h
Disclosure: I am part of Trade Nation's Influencer program and receive a monthly fee for using their TradingView charts in my analysis.
✅LIKE AND COMMENT MY IDEAS✅
