B/$We have already seen a level below $100,000.
I think there is still more to go before it turns up.
I don't see any resistance for a trend reversal at the moment.
So you can hold your short positions and just move your stop loss even lower.
BTCUSD.PI trade ideas

BTCUSD Continues Falling DownBitcoin (BTC) price remains steady above a key support level, trading slightly above $106,000 at the time of writing on Friday. The uncertainty looms as geopolitical tensions between Iran and Israel show no sign yet of an exit strategy from either side.

WAW we ended up again following my imaginary lines .... I'm seeing a potential upside: if war accelerates government spending, it could push central banks to print more money — and that could be fuel for Bitcoin.
Historically, wars come with massive fiscal demands. Governments tend to ramp up military budgets, fund support packages, and stimulate their economies to manage instability — and that often leads to increased money printing.
More fiat currency in circulation typically leads to inflation or a devaluation of purchasing power. In that kind of environment, investors and everyday people start looking for stores of value outside of traditional currencies — like gold, real estate… and now, Bitcoin.
Bitcoin was literally born in response to central banks abusing the money printer. Its fixed supply — 21 million coins — makes it an attractive hedge against inflation and monetary debasement. If war accelerates global instability and fiscal irresponsibility, Bitcoin could benefit as a safe-haven asset.
So yes — war is tragic. But in purely macroeconomic terms, if it triggers massive government spending, printing, and inflation, it could send Bitcoin flying.

Bitcoin Tests Key Support-Healthy Correction Within Bull MarketHealthy Pullback, Strong Structure:
Bitcoin’s recent dip is a constructive correction within a broader bull trend, as it tests the critical $100,000–$105,000 support zone—a former resistance area from early 2025.
Institutional Demand Holds the Line:
Maintaining levels above the psychologically important $100,000 mark highlights continued institutional accumulation and reinforces the underlying strength of the trend.
Momentum Reset, Base Building:
This pullback has helped reset overbought conditions from the prior rally, laying the foundation for the next potential leg higher.
Key Levels to Watch:
Support: $100,000–$105,000
Breakout Trigger: A close above $108,000 would confirm uptrend continuation
Outlook: Bullish bias remains valid as long as support holds
Investor Opportunity:
With structure intact and downside contained, this consolidation presents a favorable risk-reward setup for long-term investors looking to position ahead of a potential breakout.
#Bitcoin #BTC #CryptoMarket #TechnicalAnalysis #SupportAndResistance #BullMarket #RiskReward #InstitutionalBuying #MarketOutlook #PriceAction

BTC — Weekend Pump Fades.. All Eyes on the Gartley Reversal ZoneBitcoin has been consolidating in a tight range between $110K and $105K over the past two weeks. This weekend’s attempted breakout stalled out quickly! BTC was rejected at the Point of Control (POC) of the previous range and came close to the 0.786 retracement of the recent drop.
🧠 Reminder: Weekend pumps are notorious for being unreliable, especially without strong volume.
Now, the charts point toward something much more structured — a potential Gartley harmonic pattern forming, with multiple levels of confluence suggesting the next key decision zone is just around the corner.
🧩 Gartley Completion Zone: $106,290–$106,400
This price zone is loaded with confluence:
✅ 0.786 Fib retracement of the XA leg sits at $106,290
✅ 1.0 trend-based Fib extension of the BC leg is at $106,370
✅ Anchored VWAP from all-time high aligns precisely at $106,370
✅ VAL (Value Area Low) sits at the same level
✅ Imbalance (Fair Value Gap) from earlier price inefficiency lies in this exact region
All of this stacks up into a high-probability reaction zone.
🎓 Educational Insight: How to Trade a Gartley Harmonic
The Gartley pattern is one of the most powerful harmonic setups — a structured form of retracement and extension that captures exhaustion before reversals. Here's how it works:
🔹 XA: Impulse leg
🔹 AB: Retracement of 61.8% of XA
🔹 BC: Retraces 38.2%–88.6% of AB
🔹 CD: Extends to 78.6% retracement of XA and aligns with a 1.0–1.272 Fib extension of BC
🟢 Point D is the entry zone — your reversal opportunity.
📉 Stop-loss sits just below invalidation (Point X).
💰 Targets usually lie at 0.382 and 0.618 of the CD leg.
🔎 Why It Works: It traps late traders and captures price exhaustion at natural Fibonacci ratios. Combined with other tools — like VWAP, liquidity zones, and order flow — it becomes a high-conviction strategy. These patterns are most effective on higher timeframes like 4H or daily.
_________________________________
💬 If you found this helpful, drop a like and comment!
Want breakdowns of other charts? Leave your requests below.


BITCOIN Short-term Target = $117kBitcoin (BTCUSD) is coming off a 4H Golden Cross, attempting to hold the 4H MA50 (blue trend-line) as its short-term Support. The early hours of the E.U. session today show that this might be a difficult task, however comparison with May's Bullish Leg, gives positive signs.
Almost the entire month of May sequence has been an uptrend, which looks very similar to today's. Almost identical rises from their bottoms (+13.60% against +12.60%) until the first top, with similar 4H RSI fractals also, we can expect the current uptrend to make a second top soon near the 1.5 Fibonacci extension at $117000.
Are you expecting such an outcome in the coming days? Feel free to let us know in the comments section below!
-------------------------------------------------------------------------------
** Please LIKE 👍, FOLLOW ✅, SHARE 🙌 and COMMENT ✍ if you enjoy this idea! Also share your ideas and charts in the comments section below! This is best way to keep it relevant, support us, keep the content here free and allow the idea to reach as many people as possible. **
-------------------------------------------------------------------------------
💸💸💸💸💸💸
👇 👇 👇 👇 👇 👇

Bull Flag TargetBased on the flag pole height BTC has a current target of 137. This is be so much fun!

Btcusd techinical analysis.Btcusd techinical analysis next move posibale at h1 time frame.not finchinal advice.

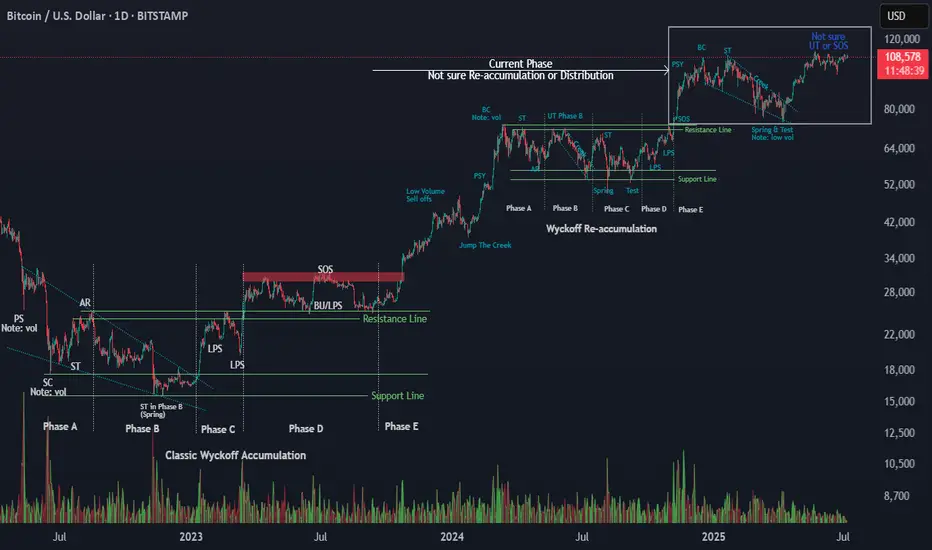
Wyckoff Logic – Test PhaseI won’t say much — the chart speaks for itself.
Based on my ongoing study of Wyckoff methodology, it appears that Bitcoin is currently in the Test phase within a re-accumulation structure. This suggests the Mark-Up phase is not yet complete, and we may still have room for price expansion before the next major distribution.
This is not a prediction, but a reference for structural context using classical Wyckoff logic.
As always, price confirmation and volume behavior will be the key to validate the next move.
Observations:
Strong support zone holding after Spring/Test
Price respecting higher lows
Volume profile supports continuation
Feel free to share your perspective below 👇
#Wyckoff #Bitcoin #BTC #Reaccumulation #MarketStructure #PriceAction #TradingView #CryptoTA
BTC is ready to plungebtc has form a compression and its ready for the major correction.
becareful in trading btc.
Is Bitcoin Working Out a New Leg Up? Onchain Data Says It May BeDiamond hands are waving goodbye and institutions are loading up — it’s why Bitcoin may be struggling to break out of its current consolidation range. How long can this accumulation phase continue?
And yes — we look at the trades of the decade — two transactions where each one moved a cool billie from a $7.8K investment in 2011.
Some people cling to their Bitcoin BITSTAMP:BTCUSD stash like it’s their last protein bar before a marathon. Others, apparently, wake up one day and decide to dump their coins and browse the market for islands.
Welcome to the silent shift that’s redefining the big players in the Bitcoin market, worth about $2.2 trillion as per data from our Crypto Coins Heatmap .
Old-school whales — the very early adopters and miners holding the OG wallets — are quietly selling, while institutional heavyweights sweep in to buy every dip (part of the reason why lately every breakout never breaks out).
Over the past year, these OG whales have shed about half a million Bitcoin — worth north of $50 billion — according to data from 10x Research. And guess who’s gobbling it all up? ETFs, corporate treasuries, and family offices that didn’t want anything to do with crypto five years ago.
Is it bullish? Is it bearish? Is it just Bitcoin being Bitcoin? Let’s pull up the charts, squint at the data, and see what the world’s most famous digital coin might be plotting next.
📈 A Record High — And Now What?
So here’s the setup. Bitcoin has been strutting under its record high of $111,000 for months now. You’d think the hype machine — from Trump’s pro-crypto administration, to corporate balance sheets going full Michael Saylor (looking at you, GameStop NYSE:GME ) — would send BTC blasting past the Moon and landing on Mars.
Instead? It’s just... chilling. Volatility’s drying up like the last drop of liquidity in a summer Friday session. And the reason is surprisingly simple: the massive handover happening between big, anonymous early adopters and the suit-and-tie institutional crowd.
😌 From Wild Ride to Easy Cruising?
You could argue this is exactly what Bitcoin needs: maturity, respectability, less drama. But don’t tell that to the day traders who want 20% swings before breakfast. As these whales get out and institutions get in, analysts say the upside could be capped at a chill 10% to 20% a year.
Good news for your retirement portfolio, maybe not so great for that “Lambo by Labor Day” dream.
Institutions now hold about 25% of all Bitcoin in circulation — and once these get in, they tend to sit tight for years.
🚀 The $1.1 Billion Time Capsule
Speaking of whales: ever wonder what happens when a Bitcoin wallet goes dark for 14 years? It pops back online to make your mind melt.
On April 3, 2011, a wallet labeled “1HqXB...gDwcK” moved 23,377 BTC to three addresses. At the time, Bitcoin was worth a mere 78 cents. Fast forward: two of those receiving wallets, each with 10,000 BTC, sat dormant for over a decade.
This month, both wallets moved their treasure troves — worth over $1.1 billion each — within 30 minutes of each other. Talk about a coordinated exit. What’s behind the move? Tax planning? A lost key finally found?
A savvy crypto thief who figured how to crack the earliest key generation method? We may never know. Also, OG guy, if you’re reading this — props for the all-at-once move without even a test transaction.
⛓️ What Onchain Data Says
Onchain data is like reading tea leaves for nerds with Bloomberg terminals. It says the supply is tightening — not because there’s less Bitcoin, but because fewer coins are actually available to trade.
When long-term holders move coins, that typically signals big-picture changes. Here’s the twist: the net effect has been… stability. Institutional demand, like Bitcoin exchange-traded funds , soaks up supply just as fast as whales drip it back in.
That’s why Bitcoin’s been stuck in this $100K–$110K limbo, ping-ponging while the accumulation phase is still going strong.
👀 So, Is a New Leg Up Coming?
This is where the optimists and realists start to bicker over the charts. On the one hand, the structural handover to institutions makes Bitcoin more credible, more regulated, and more boring.
But less volatility can mean steadier gains — especially if you believe that the world will always want an inflation hedge that no central bank can print into oblivion.
On the other hand, a sideways market can test your patience more than a typical drawdown. Some of the whales are gone, the suits have arrived, and the easy moonshots might not be so easy anymore.
🌱 The Trade-Offs of Growing Up
Bitcoin was born in the wild west of finance — an anonymous, volatile, meme-fueled phenomenon. Now, it’s drifting deep into the mainstream. That might limit the fireworks, but it also locks in its place as an asset class that’s not going away.
🌊 Closing Thoughts: The Next Billion-Dollar Move
Will we see another $7,800 investment turn into a cool $1 billion? Maybe not exactly like that. But the game isn’t over — it’s just evolving.
Keep your eyes on the whales, the ETFs, the Fed’s next move , and those onchain breadcrumbs.
Over to you , chart-watchers: does this calm consolidation make you bullish, bearish, or just plain bored? Share your thoughts in the comments!

BRIEFING Week #27-28 : Distancing from US MarketsHere's your weekly update ! Brought to you each weekend with years of track-record history..
Don't forget to hit the like/follow button if you feel like this post deserves it ;)
That's the best way to support me and help pushing this content to other users.
Kindly,
Phil

BITCOINBTC is showing strong bearish momentum. Price has broken below key support and is forming lower highs and lower lows, indicating continuation of the downtrend.
Until we see a clear reversal pattern or reclaim of resistance levels, I expect further downside.

July 7 Bitcoin Bybit chart analysisHello
This is Bitcoin Guide.
If you "follow"
You can receive real-time movement paths and comment notifications on major sections.
If my analysis was helpful,
Please click the booster button at the bottom.
Here is the Bitcoin 30-minute chart.
There is no separate Nasdaq indicator announcement today.
I think the Nasdaq lower gap section retracement will be the focus.
Recently, sideways movement or adjustments have been coming out before the trend,
So I proceeded safely in preparation for variables.
*When the blue finger moves
Bidirectional neutral
Short->long switching or 2nd section long waiting strategy
1. $109,380 short position entry section / cut-off price when orange resistance line is broken
2. $108,997.8 long position switching / cut-off price when purple support line is broken
3. $109,610.9 long position 1st target -> Top 2nd target -> Good 3rd target
It seems important whether the purple support line is broken from the current position. If the first section at the top touches 108,997.8 dollars and comes down,
it may become a vertical decline section.
If it comes down right away, it is a long-waiting strategy in the final second section,
and if it deviates from the bottom section today
(6+12 pattern)
because it is a full candle when the gap section is touched,
it may fall to 107,484 dollars indicated at the very bottom.
I have important work to do tomorrow,
so I will take a day off and come back on Wednesday.
Please use my analysis so far for reference and
I hope you operate safely with principle trading and stop loss prices.
Thank you.

BTC CHOPSBitcoin is quietly grinding higher, holding above the key $105,787 level after reclaiming it with authority. Price is consolidating just under $112,000 resistance, pressing against the top of the range while riding the 50-day moving average like a support rail.
The dip to $100,716 was a trap. Buyers stepped in hard, and price hasn’t looked back. But without a decisive close above $112K, this remains a waiting game. A breakout sends us flying. A rejection brings $105K and $100K back into view. No need to guess - just let the levels speak.

BTC is looking Bullish This is not a financial advice... btc is bullish but I think this might be a BULLtrap.

Bitcoin - Will Bitcoin record a new ATH?!Bitcoin is above the EMA50 and EMA200 on the four-hour timeframe and is in its medium-term ascending channel. Maintaining the specified support area will lead to the continuation of Bitcoin’s upward path and recording a new ATH. If it is corrected, we can look for Bitcoin buying positions from the specified demand zones.
It should be noted that there is a possibility of heavy fluctuations and shadows due to the movement of whales in the market and compliance with capital management in the cryptocurrency market will be more important. If the downward trend continues, we can buy within the demand area.
In recent days, Bitcoin has been stabilizing in a price range of around $107,000, with the market simultaneously witnessing a combination of short-term volatility and massive accumulation by institutional investors. A close examination of Bitcoin’s fundamental parameters shows that the market has entered a different phase than in the past; one that is no longer driven solely by momentary excitement, and that structured capital flows and on-chain data have formed its main axis. At the forefront of this trend are Bitcoin spot investment funds (Bitcoin ETFs), which reached their highest level of capital inflows in June. Total net inflows of these funds reached more than $4.5 billion last month, and on some days even approached more than $1 billion. Funds such as BlackRock’s IBIT and Fidelity’s FBTC now have billions of dollars in assets under management, a clear sign of increasing institutional participation in the Bitcoin market. These institutional investors are accumulating Bitcoin not with a short-term view, but with a long-term view and through legal means, which has reduced selling pressure and increased market stability.
On the other hand, the data from Anchin clearly shows that the market is in a steady accumulation trend. The amount of old Bitcoins held for more than 8 years experienced a significant growth of 5% in the second quarter of 2025. This statistic shows that long-term investors are not only reluctant to sell, but are still accumulating their assets. Also, the MVRV ratio, which indicates the relative profit or loss of the market, has decreased from 2.29 to 2.20, indicating mild and controlled profit taking by some investors, rather than widespread selling pressure or general panic. This rational behavior is a sign of market maturity and investors’ intelligence in managing short-term profits.
On-chain activity data also shows a similar trend. The average daily active addresses have reached around 1.02 million, indicating a decrease in market inflammation while maintaining overall dynamism. Other indicators such as Liveliness and Whale Accumulation also confirm that the amount of old transaction traffic has decreased and whales are mainly accumulating, not supplying. This trend is very valuable, especially in a market that has been far from explosive growth. From a macro perspective, the Bitcoin market is clearly in a consolidation and accumulation phase, but this consolidation is based on much stronger foundations than in previous periods. Institutional capital inflows via ETFs have reached over $50 billion, providing a strong foundation for continued growth. Also, some very old wallets that have been inactive for nearly 14 years have recently woken up and moved around $2 billion worth of Bitcoin. Although this could be a sign of potential supply, the market has not yet seen a significant negative reaction to it in the current market conditions and the market remains cautious.
Analysts believe that Bitcoin is in the third phase of its bullish cycle after the halving, which could bring gains of more than 120%. Some forecasts suggest a price range of $200,000-250,000 by the end of this year; however, the realization of such levels is subject to stable macroeconomic data, ETF performance and the absence of severe geopolitical shocks.
Finally, it can be said that the Bitcoin market has now reached a maturity where even periods of consolidation tend to strengthen its fundamentals rather than weaken the market. High-powered institutional investors are entering, whales continue to accumulate instead of selling, and long-term investors also see a bright outlook for the coming months. In this phase, price levels of $125,000 to $140,000 are likely by the end of the summer if the current trend continues, while in the event of severe economic or political pressures, key support for Bitcoin will be in the $95,000 to $100,000 range. Overall, Bitcoin is moving slowly but steadily towards higher targets, with stronger support than at any time in its history.

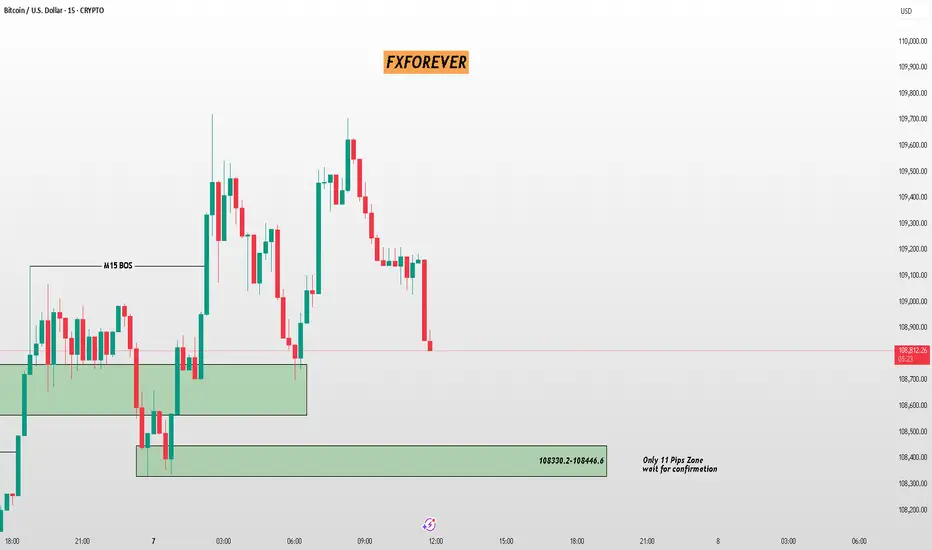
BTC/USD – Sharp Drop Into Micro Demand Zone (7 July 2025)📉 BTC/USD – Sharp Drop Into Micro Demand Zone (7 July 2025)
Price broke structure on M15 and is now falling into a tight 11-pip demand zone (108330.2–108446.6).
📊 Key Details:
🔸 M15 BOS already formed
🔸 Zone Size: Only 11 pips – requires extra caution
🔸 Setup: Wait for confirmation before reacting
📍 Aggressive buyers might watch for LTF CHoCH or engulfing from the zone. Safer entries lie in confirmation-based setups.
🎯 FXFOREVER – Precision levels. Calculated decisions.
#BTCUSD #FXFOREVER #SmartMoneyTrading #DemandZone #BreakOfStructure #M15Chart #CryptoSetup #BitcoinStrategy #PriceActionForex
BTCUSD 7/6/2025Come Tap into the mind of SnipeGoat, as he gives you a Weekly Market Breakdown of Bitcoins current Price Action to determine Price's next move.
_SnipeGoat_
_TheeCandleReadingGURU_
#PriceAction #MarketStructure #TechnicalAnalysis #Bearish #Bullish #Bitcoin #Crypto #BTCUSD #Forex #NakedChartReader #ZEROindicators #PreciseLevels #ProperTiming #PerfectDirection #ScalpingTrader #IntradayTrader #DayTrader #SwingTrader #PositionalTrader #HighLevelTrader #MambaMentality #GodMode #UltraInstinct #TheeBibleStrategy

Bitcoin 4H Rocket Booster Strategy – Bullish Setup with EMA Bitcoin 4H Rocket Boost Strategy – Bullish Setup with EMA Alignment, Gap Action, ADX Strength, and Stoch RSI Signal
Bitcoin (BTC/USD) is currently displaying a textbook bullish setup on the 4-hour chart, closely matching the Rocket Boost Strategy
criteria. Traders using a trend-following system with momentum confirmation will find this setup particularly appealing.
1. Price Above the 50 EMA
Bitcoin is trading firmly above the 50 EMA, a key sign that short-term momentum is tilted in favor of the bulls. The 50 EMA often
acts as dynamic support during strong uptrends, and current price action respecting this level shows the market is in a healthy
bullish phase.
2. Price Above the 200 EMA
The long-term trend is also confirmed as bullish, with price positioned well above the 200 EMA. This alignment of the 50 and
200 EMAs forms what many traders call a “bullish stack,” which strengthens confidence in long opportunities.
3. Gap Action / Aggressive Breakout Behavior
While cryptocurrencies don't technically gap in the same way as stocks or forex (due to 24/7 trading), Bitcoin has shown strong
impulsive breakout candles with little to no wick retracement—often referred to as "synthetic gaps" or aggressive breakouts.
This behavior typically reflects institutional buying or whale-driven momentum entering the market suddenly.
4. ADX Indicator Confirms Trend Strength
The ADX (Average Directional Index) is rising above the 20–25 level, which indicates that the current trend is gaining strength. A
rising ADX while price moves higher means that the upward momentum is not just temporary noise—it’s a signal that buyers
are firmly in control.
5. Stochastic RSI Gives Reversal Buy Signal
The Stochastic RSI recently dipped into oversold territory and has now crossed back upward. This reversal buy signal, especially
when aligned with a trending environment, often marks the end of a short-term pullback and the beginning of a new impulse leg upward.
What This Means for Bitcoin Traders
When all these components align—price above both EMAs, strong ADX trend, breakout behavior, and a fresh Stoch RSI buy
signal—it often results in what traders using the Rocket Boost Strategy refer to as a “momentum ignition point.” It’s not just a
signal to enter, but a signal that the market may accelerate in the current direction.
This could lead Bitcoin to test new resistance zones or even break psychological levels if volume supports the move. Key zones to
watch would be previous highs and Fibonacci extensions drawn from the most recent swing.
Disclaimer: This article is for educational purposes only and does not constitute financial advice. Always perform your own due
diligence and use proper risk management when trading.
To learn more about this kind of setup, search for Rocket Boost Strategy content.

Bitcoin (BTCUSD) - Daily Price Uptrend, Resistance Breakout TestBitcoin (BTCUSD) has been in a recent Daily price Uptrend, rallying up from the $100,000 price support level.
A SMA Golden Cross printed on May 21st, 2025.
Bitcoin price is attempting a resistance zone test and has yet to breakout and hold above the $111,000 to $112,000 price zone.
Resistance levels: $110,000 , $112,000 , $117,000 , $121,000.
Support levels: $108,000 , $107,000 , $105,000 , $104,000 , $100,000.
Recent crypto industry, government legislation news, and institutional crypto purchases have helped to keep Bitcoin price above $100,000 support.
Stock market correlation volatility could also affect the crypto market and prices for the next 30 to 45 days.

BTC?
Hi
We have a predicament when we enter a trade
Buy or Sell
That's all
We need to have a belief
How do we have the bias?
Knowledge base
In your research : Is it valuable in 6months till 24mo & why?
If it is push button buy; if not going to be why would youu.??
So laymen.. and not so complex.
The issue is leverage, greed and get it quick and you need to have it now.
Again.
Not a guru
NB/ patience boss
