CHECK BTCUSD SIGNAL READ CAPTAINbtcusd ) sell zone
( trade satup)
entry point (109.100) to (109.000) 📊
first tp (108.500)📊
2nd target (107.800) 📊
last target (107.200) 📊
stop loss (109.500)
BTCUSD.PI trade ideas

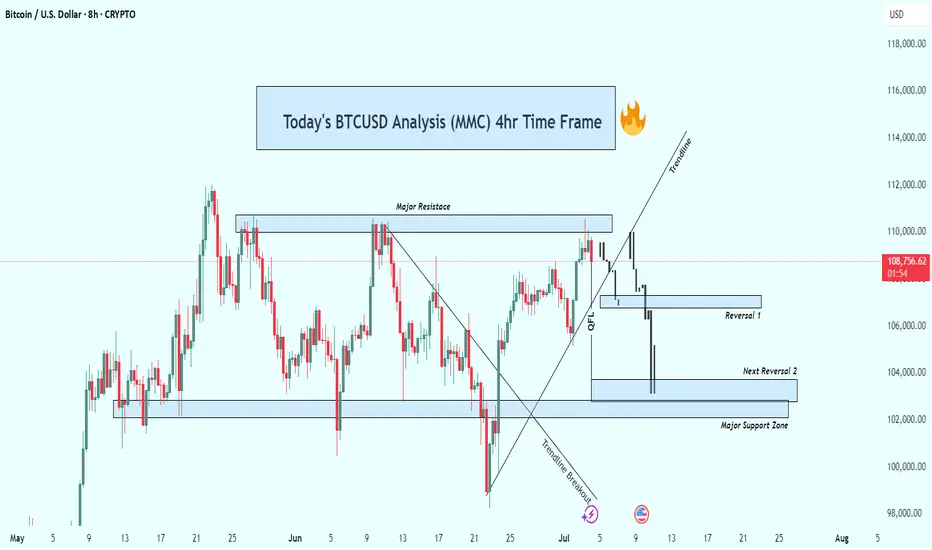
BTCUSD 4hr Technical Analysis : Rejects $110K - Next TargetsOverview:
Bitcoin is currently undergoing a significant technical correction after rejecting a strong resistance level. The 4-hour chart shows a decisive bearish breakdown, suggesting that the bulls are losing control and sellers are gaining momentum. As the price continues to fall, all eyes are now on the major support levels that could trigger a potential reversal—or further acceleration to the downside.
📊 Technical Breakdown:
1. Major Resistance Zone (~$110,000 – $111,000):
This zone has acted as a strong supply area, where price has repeatedly failed to break through. Multiple rejections from this zone confirm it as a key distribution area, where large sellers are stepping in. The repeated failure to close above it shows market exhaustion at the highs.
Multiple candle wicks and strong bearish closes around this area.
Bull traps occurred after brief moves above this resistance, followed by sharp sell-offs.
2. Trendline Breakout:
Previously, BTC had been respecting a rising ascending trendline, which served as dynamic support throughout the last rally. Recently, price broke below this trendline with strong bearish momentum.
This marks a break in market structure.
The trendline retest acted as resistance—textbook confirmation of the trend shift.
3. QFL (Quantity Following Line) Breakdown:
The QFL zone, typically a bullish defense level, has failed to hold. This breakdown confirmed that bulls lost a critical level of control.
Price briefly retested the QFL from below before continuing downward.
This zone now acts as resistance, reinforcing the bearish outlook.
🔻 Downside Targets & Reversal Zones:
✅ Reversal Zone 1 (~$106,000):
This minor support level provided minimal reaction and was quickly breached.
Lack of volume or candle confirmation suggests weak buying interest here.
✅ Next Reversal Zone 2 (~$104,000):
This zone has historical importance as a short-term demand area.
Monitor closely for bullish candlestick patterns, volume spikes, or bullish divergences to assess potential bounce scenarios.
✅ Major Support Zone (~$102,000 – $100,000):
This is the most critical level in the near term.
Historically, price has reversed strongly from this zone, indicating strong buyer interest.
If price breaks and closes below this level, expect a high-probability continuation towards the $98,000 psychological level or lower.
🧠 Market Psychology:
The breakdown from the trendline and QFL indicates panic or profit-taking.
Many late long positions are likely being liquidated.
Smart money may be waiting at the $100K zone to accumulate, depending on market conditions and macro factors.
🎯 Trading Strategy Ideas:
🛑 For Bears (Shorts):
Stay short below $110K resistance.
Trail stop-loss above QFL zone or trendline breakdown.
Look to take profit at $104K and $102K zones.
Add to positions on confirmed bearish retests of broken supports.
📈 For Bulls (Longs):
Wait for clear confirmation (e.g., bullish engulfing, double bottom, RSI divergence) near $104K or $102K before entering.
Avoid catching falling knives—patience is key.
Consider scaling in with smaller position sizes and tight stops.
Watch for a reclaim of the QFL zone or a strong bounce from the $100K psychological level.
🧭 Bias: Bearish
Structure: Lower highs & lower lows.
Momentum: Selling volume increasing, bulls losing steam.
Invalidation: A strong daily close above $111K would flip bias back to neutral/bullish.
🧩 Final Thoughts:
Bitcoin is currently in a fragile state as it retraces from a failed breakout. With multiple key support zones ahead, the next few sessions will be critical in determining whether bulls can reclaim control or if we see deeper downside movement. Watch for signs of exhaustion from sellers or fresh accumulation zones to position accordingly.
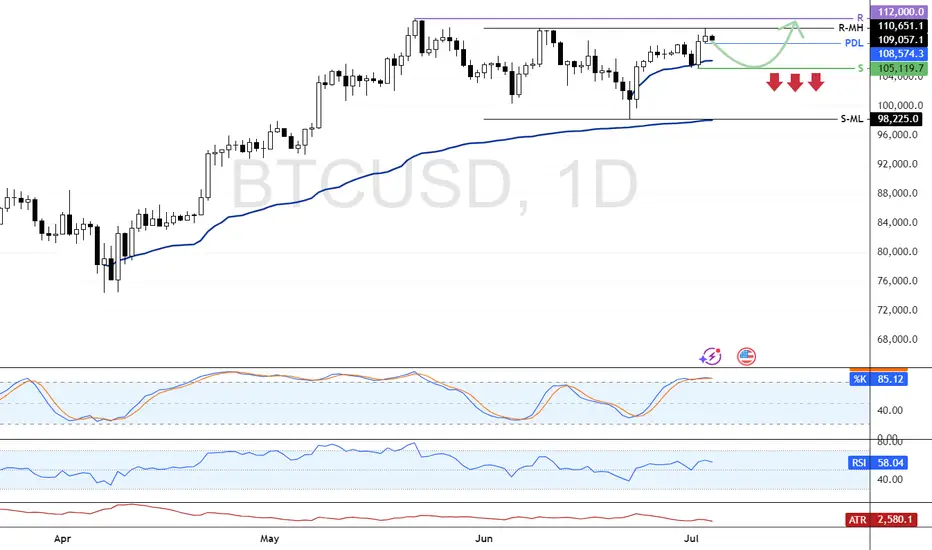
BTC Eyes $105,119 Support Before Targeting $112,000FenzoFx—Bitcoin is trading just below the previous monthly high at $109,110.0, while the Stochastic remains overbought for the third consecutive day, signaling short-term overheating.
Although the broader trend is bullish, a pullback toward the anchored VWAP at $105,119.0 is expected. This level may offer a low-risk reentry, with a potential move toward the all-time high at $112,000.0.
Bitcoin Eyes Breakout if Clears $114,000📊 Market Overview:
• Bitcoin trades around $109,350, with an intraday high near $109,610
• Rosenberg Research notes BTC could rally ~6% to clear $114,000, potentially triggering a 25% rise to $143,000 on the back of ETF inflows, a weaker dollar, and Fed rate cut expectations
📉 Technical Analysis:
•Key Resistance: ~$114,000; followed by the psychological $112,000 zone .
•Nearest Support: $107,000 (prior highs/descending channel bottom) and key floor at $100,000
•EMA Levels:
o Price consolidates near 50-day EMA ($105,800), a crucial confluence zone
•Candlestick/Momentum:
o RSI near 50 (neutral),
o Flag pattern breakout suggests continuation potential
📌 Viewpoint:
Bitcoin may extend its rally if it breaks above $114,000, targeting $137,000–$143,000. If rejected, a pullback toward $107,000 is likely before bouncing.
💡 Suggested Trading Strategy
SELL BTC/USD at: $113,500–$114,000
🎯 TP: $110,000–$110,500
❌ SL: $114,500
BUY BTC/USD at: $107,000–$108,000
🎯 TP: $112,000–$113,000
❌ SL: $106,000

(BITCOIN UPDATE) LONG BTC Taking that previous LTF high was broken this changes everything. Now if it can establish a HL this will confirm pushes higher for the near future.
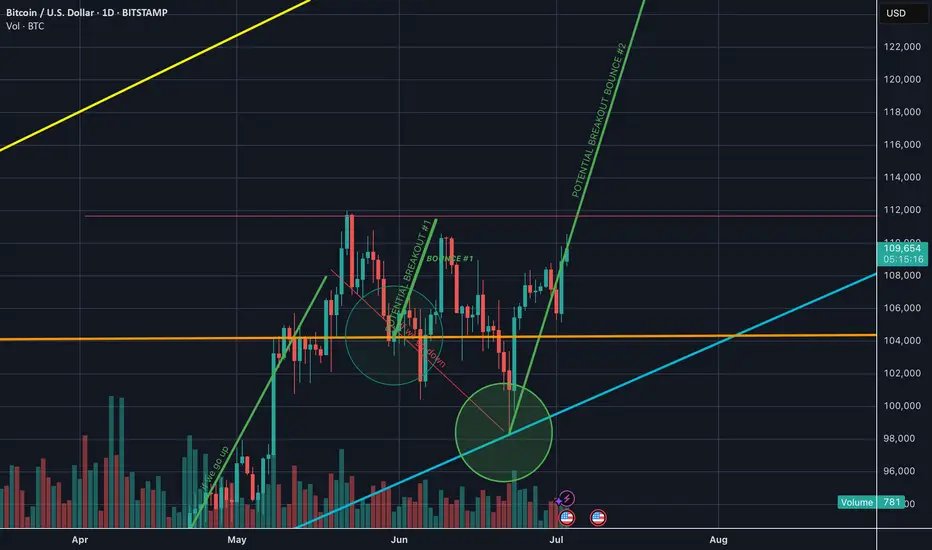
$Bitcoin going to a Million $USD ? Happy 4th of July !May this 4th of July mark the Day of your Independence !
They say that the human brain has no parallels to its capacity for pattern recognition.
I say it is not the brain, but the mind that recognizes the pattern ... the consciousness behind it.
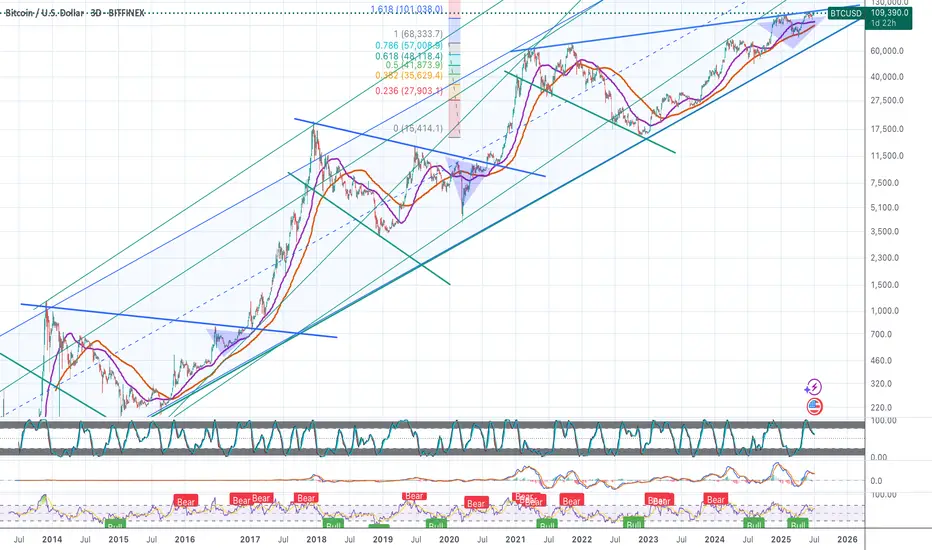
This chart shows the last 3 cycles ... we are just entering the 4th parabolic move, and I believe it will start when CRYPTOCAP:BTC crosses $113.5k USD per coin ... very soon indeed !
Many will say, but what happened to the 4 year cycle ? Isn't it scheduled to finish this October ?
Well, I am no expert but it would appear that the cycle has lenghtened, at least this time around. Proof of it is the CRYPTOCAP:ETH chart ... the second biggest crypto by market cap.
A few factors that you may consider, that perhaps affected the global business cycle, let's say they helped to delay it: the effect of Covid in 2020 and 2021, and as well the tariffs issue in 2025. What does this mean ?
Well, physically it means that with the economies running very slow in these two mentioned instances, the ECONOMIC WORK globally stalled.
Is it therefore any surprise that the "cycle" lenghtened, or slowed, this time around ?
Let's see what happens when the BBB makes BRRRR ... !
Enjoy !
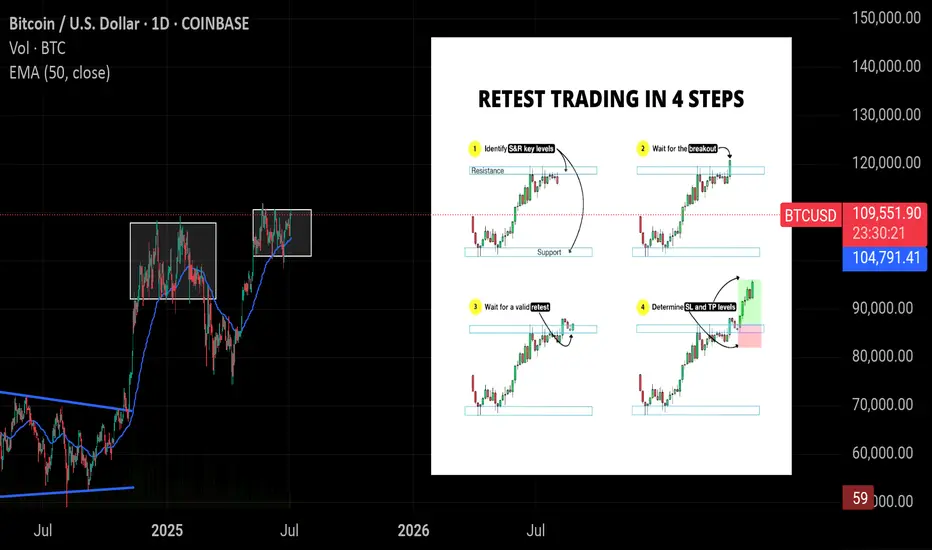
Mastering Breakout Trading: The 4-Step Precision Guide
1. 🔍 Spot the Key Zones (S&R)
Identify strong Support & Resistance levels — areas where price consistently reverses or stalls. These zones are critical for planning trades.
2. 🚀 Breakout Confirmation
Don’t rush — wait for the price to cleanly break above resistance or below support. This signals potential trend initiation.
3. 🔁 The Golden Retest
After the breakout, wait for price to revisit the broken level and show strength (like a bullish candle) — this validates the breakout.
4. 🎯 Set Smart SL & TP
Define your Stop Loss just beyond the invalidation level and Take Profit based on risk-reward or nearby price targets.
Tip: Patience is your edge — wait for structure, confirmation, and clean signals.
Enter on the bounce from the retest zone, typically when a green candle or bullish pattern forms — it confirms trend continuation.
#Educational
TP 138500 Locked Gold since bouncing from 74500 K btc in swing upwards pressure 1st target 🎯 is 138500 K to then drop or correction before continuation to 260 K get ready

$BTC Price Showing a Bullish Flag Pattern & Breakout see chart..CRYPTOCAP:BTC Price Breakout of Bullish Flag Pattern. I'm guess it's going to the next Price Zone $115K and if Breakout thank going $122K price zone.
I was telling some coins that was saying Multiple Profit and now coins are driving on the way. There are coin is ETH, BNB, XRP, SOL, TRX, TON, SUI, ADA, ICP, ARB, XLM.
Ric Edelman Urges Up to 40% Crypto Allocation, Predicts Bitcoin Surge to $500K
Top advisor Ric Edelman recommends investors allocate up to 40% to crypto, forecasting Bitcoin could reach $500K with rising institutional demand.
Ric Edelman advises investors to allocate 10% to 40% of their portfolios to crypto, based on their risk tolerance.
Edelman predicts Bitcoin could reach $500,000 if just 1% of global assets shift into the cryptocurrency sector. His endorsement is viewed as a major TradFi signal, given his $300 billion asset management influence in the advisory industry.
Ric Edelman, the founder of Edelman Financial Engines and DACFP, has recommended investors shift a significant portion of their portfolio to cryptocurrency. In a recent whitepaper, Edelman advised allocating between 10% and 40% to crypto, depending on individual risk tolerance.
This guidance marks a break from the conventional 60/40 stock-to-bond portfolio model, which he believes is no longer practical in a rapidly advancing economic environment.
According to Edelman, conservative investors should hold 10% in crypto, moderate investors 25%, and aggressive investors 40%. He cited technological advancements and increased life expectancy as reasons to move away from traditional investment formulas. He emphasized that ignoring crypto means betting against an asset class that has outperformed all others over the past 15 years.
Bitcoin Price Could Hit $500,000 with Minimal Asset Shift
Edelman also presented a bullish projection for Bitcoin, suggesting it could reach $500,000. He explained that a 1% allocation of the $750 trillion in global assets toward Bitcoin would inject $7.5 trillion into the market. Based on current valuations, this inflow could significantly drive the asset’s price. He underlined this estimate as simple arithmetic based on supply and demand trends.
Edelman pointed to growing institutional interest and policy changes as key drivers for crypto’s rise. He highlighted that Tether, a major stablecoin, reported $13 billion in profits last year, surpassing companies like McDonald’s and Ford. He also noted that a pro-crypto political climate, especially following Donald Trump’s reelection, is setting favorable conditions for digital assets.
Disclaimer: This article is for informational purposes only and does not constitute financial advice. Always conduct your own research before making any investment decisions. Digital asset prices are subject to high market risk and price volatility. The value of your investment may go down or up, and you may not get back the amount invested. You are solely responsible for your investment decisions and Binance is not available for any losses you may incur. Past performance is not a reliable predictor of future performance. You should only invest in products you are familiar with and where you understand the risks. You should carefully consider your investment experience, financial situation, investment objectives and risk tolerance and consult an independent financial adviser prior to making any investment.

LONG BTC TO ATHlast line to the ath
lets go with IT !!
wait for price to show some willness from the d bisi+FVA
wait for 4H bisi and go in to the ATH

BTC/USD 4H – Key Decision Zone | Trade Plan/BUY & SELL ScenarioBitcoin is at a critical decision point as price hovers around the $109,000 zone on the 4H chart.
After a strong bullish recovery and a clean structure of higher highs, BTC is currently consolidating just below major resistance at $111,893. Price action is squeezing between dynamic EMA14 support and horizontal supply, indicating a potential breakout or breakdown.
Sell if 4H candle closes below $108,500 with body confirmation.

BTC Falling wedgeBtc formed a falling wedge pattern and also tested the Resistance become support, and also in the major trend has broken the trendline.


$BTC is testing the key $110K resistance — a daily close above iCRYPTOCAP:BTC is testing the key $110K resistance — a daily close above it could trigger a breakout toward $115K–$120K. If rejected, a dip to $105K–$100K offers a strong long opportunity. Bullish structure holds unless price breaks below $99K.
BITCOINSpeculators are net short on BTC (bearish sentiment).
The short position has increased slightly, indicating growing bearishness.
✅ Bias Summary:
BTC Bias: Bearish and increasing in bearish momentum.

BTCUSD 7/3/2025Come Tap into the mind of SnipeGoat, as he gives you a Wonderful update to his 7/1/2025 call-out which PLAYED OUT PERFECTLY!!!! If you are not convinced by now, what are you doing...
_SnipeGoat_
_TheeCandleReadingGURU_
#PriceAction #MarketStructure #TechnicalAnalysis #Bearish #Bullish #Bitcoin #Crypto #BTCUSD #Forex #NakedChartReader #ZEROindicators #PreciseLevels #ProperTiming #PerfectDirection #ScalpingTrader #IntradayTrader #DayTrader #SwingTrader #PositionalTrader #HighLevelTrader #MambaMentality #GodMode #UltraInstinct #TheeBibleStrategy

Bitcoin Between Strength and Suspension Tactical Inflow Anomaly.⊣
⟁ BTC/USD – BINANCE - (CHART: 1H) – (Jul 03, 2025).
◇ Analysis Price: $109,716.55.
⊣
⨀ I. Temporal Axis – Strategic Interval – (1H):
▦ EMA 9 – ($109,510.76):
∴ Price remains above EMA9, sustaining the short-term bullish impulse;
∴ The EMA 9 is ascending with consistent candle-body support across recent sessions.
✴ Conclusion: Tactical momentum persists as long as price holds above EMA9 on closing basis.
⊢
▦ EMA 21 – ($109,064.37):
∴ EMA 21 serves as dynamic support, unbroken since the July 2nd surge;
∴ Distance between EMA9 and EMA21 confirms preserved trend integrity.
✴ Conclusion: No structural weakness observed; trend foundation remains intact under current volatility.
⊢
▦ Volume – (Visual estimation, TradingView):
∴ Volume surged during July 2 rally; subsequent bars show diminishing interest;
∴ Last high-volume candle aligns with recent local top attempt.
✴ Conclusion: Buyer aggression is fading. Volume must return for any continuation to be credible.
⊢
▦ Bollinger Bands (20, 2.0) – (Upper: $110,050.15 / Lower: $108,545.25):
∴ Price recently tapped upper band and pulled back slightly without breakdown;
∴ Bands are widening after expansion, indicating active volatility but no climax.
✴ Conclusion: System operates in elevated volatility regime, with breakout potential still valid if supported.
⊢
▦ Price Action (66, 6, 5) – (Visual structure, local range):
∴ Price formed a clean higher low and higher high sequence starting July 2nd, confirming bullish microstructure;
∴ Current candles show upper wick formation at ~$110,050, indicating rejection and absorption at resistance.
✴ Conclusion: Uptrend structure is valid but approaching short-term exhaustion. If support holds at $109,100–108,900, continuation remains viable.
⊢
▦ RSI + EMA9 – (RSI: 62.69 / EMA: 63.27):
∴ RSI dipped below its own EMA9, indicating weakening strength in recent hours;
∴ RSI remains above 60, preserving bullish territory but signaling caution.
✴ Conclusion: Early-stage exhaustion detected. Zone of hesitation active.
⊢
▦ ATR (14, RMA) – (447.69):
∴ Average volatility is still elevated relative to June baseline;
∴ Slight decline in ATR may suggest slowing force behind directional moves.
✴ Conclusion: Tactical volatility is active but not expanding. Suitable for traps or distribution setups.
⊢
🜎 Strategic Insight – Technical Oracle:
∴ The structural setup holds a bullish bias with dynamic supports (EMA9/EMA21) intact;
∴ Bollinger expansion and RSI positioning signal a zone of heightened interest, but the fading volume and early RSI crossover inject caution;
∴ This is a tactically suspended state where continuation is possible but dependent on incoming confirmation volume.
⊢
⟁ II. ARCANVM SIGNAL - (Bitcoin Inflow +5,000):
∴ Current Hourly Inflow: 20,788.10 BTC;
∴ Structural Threshold (30EMA): ~3,200 BTC;
∴ Trigger Threshold: ≥ 5,000 BTC.
✴ Conclusion and Interpretation: This event constitutes a critical liquidity anomaly under the Silent Sentinel Protocol. While it does not inherently dictate trend direction, its magnitude-6.5x above the structural average-configures:
∴ A probable institutional move for redistribution or liquidity unlocking;
∴ Elevated risk for short-term distortion events, particularly across the H1–H4 timeframes;
∴ An urgent need to monitor subsequent Netflow, to confirm whether real outflow pressure follows.
⊢
∫ III. On-Chain Intelligence – (Source: CryptoQuant):
▦ Exchange Netflow Total - (All Exchanges):
∴ Current: +555 Bitcoin net inflow;
∴ The ARCANVM inflow (+20,788 Bitcoin) has not been fully absorbed or reversed.
✴ Conclusion: Some liquidity remains inside exchanges. Potential for redistribution or silent preparation.
⊢
▦ Exchange Reserve - (All Exchanges):
∴ Continuously declining; current: ~2.44M Bitcoin;
∴ The inflow did not shift the macro trend of reserve depletion.
✴ Conclusion: Structural scarcity preserved. Inflow likely tactical and non-systemic.
⊢
▦ Futures Perpetual Funding Rate 7D-SMA - (All Exchanges):
∴ Holding near 0.01% – neutral bias;
∴ No evidence of directional crowding in perpetuals.
✴ Conclusion: Perpetual markets in tactical balance. Spot-driven price action dominates.
⊢
🜎 Strategic Insight – On-Chain Oracle:
∴ Despite the aggressive ARCANVM signal, the absence of structural reversals in reserves and neutral derivatives positioning confirms the move is non-structural.
∴ Markets remain in equilibrium.
∴ No emergent directional force-just silent posture-shifting.
⊢
⧈ Codicillus Silentii – Strategic Note:
∴ This is a state of tactical ambiguity. Breakout or failure depends on external triggers, as neither volume nor derivatives offer decisive guidance.
∴ The structure listens, not speaks.
⊢
▦ Tactical Range Caution:
∴ Resistance Watch Level: $110,050;
∴ Tactical Support: $109,100;
∴ Structural Alert Level: $108,400.
⊢
𓂀 Stoic-Structural Interpretation:
∴ Structurally Bullish – Tactically Suspended;
⊢
⧉
⚜️ Magister Arcanvm – Vox Primordialis!
𓂀 Wisdom begins in silence. Precision unfolds in strategy.
⧉
⊢

Btcudt techinical analysis.Btcusdt techinical analysis next move posibale at h1 time frame.not finchinal advice.

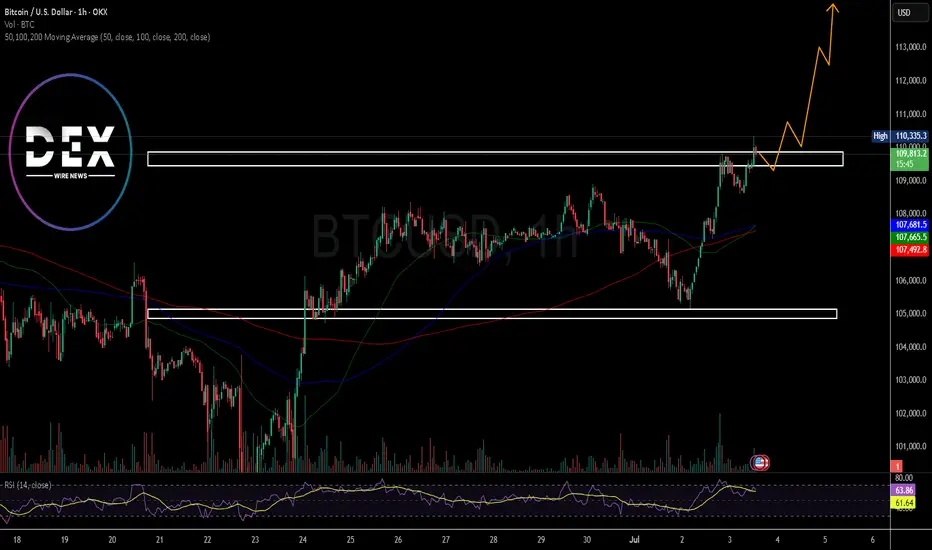
Breaking: Bitcoin Just Broke the $110k Resistant Next Top $115kThe price of the first crypto currency ever created saw a noteworthy uptick to reclaim the $110k price point however, the move was short-lived as the asset retraced to $109k mark but present price chart depicts a move to the $115k resistant point in the short term.
With the Relative strength index (RSI) at 63, Bitcoin might be inches away from claiming the $115k pivot amidst build up momentum and institutional adoption. further bullish metrics include the asset trading above the 50, 100 and 200-day Moving Averages (MA) respectfully.
Btcusdt techinical analysis.Btcusdt techinical analysis target successfully achived at h1 time frame.
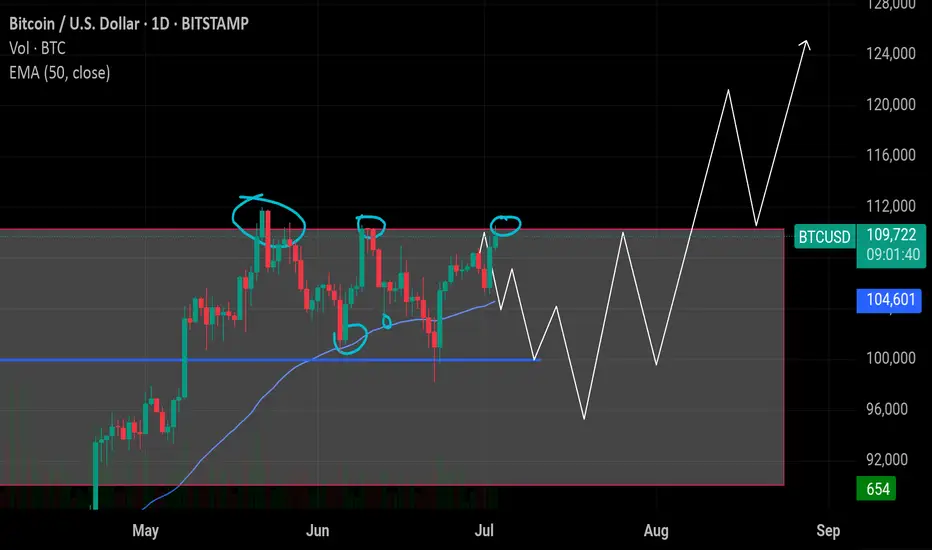
$BTC Weekly Continues to follow the script!BTC appears to have completed a shallow wave 2 retracement showing investor excitement and demand - They just can't wait to buy some!
New all time highs are expected this week (perhaps today) once the High Volume Node resistance we are currently at is overcome (obviously).
Wave 3 has an expected target of the R3 pivot $190k but i am expecting price to overextend this cycle to at least the R4 pivot at $233k.
Safe trading

BTCUSD Trade Setup Idea on 1D Timeframe - Bullish MomentumBitcoin (BTCUSD) is currently trading at $109,348, showing strong bullish momentum on the 1H chart. The recent breakout from consolidation signals potential continuation, provided key resistance levels are breached and held.
Must Consider Analysis Timeframe : 1Day.
Strictly follow the trading rules for Entry..... only on Retracement.
SL on Previous or Close swing low.
🔍 Key Levels to Watch:
Bullish Continuation Confirmation: If price sustains above 112,150, we expect bullish momentum to accelerate.
Target 1 (TP1): 112,150 – Key breakout level that may act as support once reclaimed.
Target 2 (TP2 - Major): 121,128 – Long-term resistance and major profit-taking zone.
📊 Trade Logic:
A confirmed breakout and hold above 112,150 indicates strong buyer interest and could drive price toward 116,572 and 121,128.
The trend remains bullish as long as price holds above the breakout structure.
REMEMBER:- RESPECT THE LEVELS, LELEVLS RESPECT YOU THEN.
💡 Strategy: Monitor for retests and bullish candle confirmations above 112,150 to add or enter long positions with proper risk management.
! Disclaimer & Important Note:
This analysis is for educational and informational purposes only. It does not constitute financial advice or a recommendation to buy or sell any financial instrument. All trading involves risk. We are not responsible for any kind of loss incurred, whether financial, emotional, or otherwise. Always do your own research and consult with a licensed financial advisor before making any trading decisions.
Trading involves significant risk, and you should never invest more than you can afford to lose. Past performance is not indicative of future results.
The trade idea shared above reflects personal market interpretation and is subject to change based on new market conditions.
Posted by: THEPATELCRYPTO, 45Degree
Stay safe. Trade smart.
Follow for more ideas!
📍Posted by: THEPATELCRYPTO, 45Degree
📈 Stay safe. Trade smart.
🔔 Follow for more ideas!
