Bitcoin Wave Analysis – 4 July 2025- Bitcoin reversed from long-term resistance level 110000.00
- Likely to fall to support level 105000.00
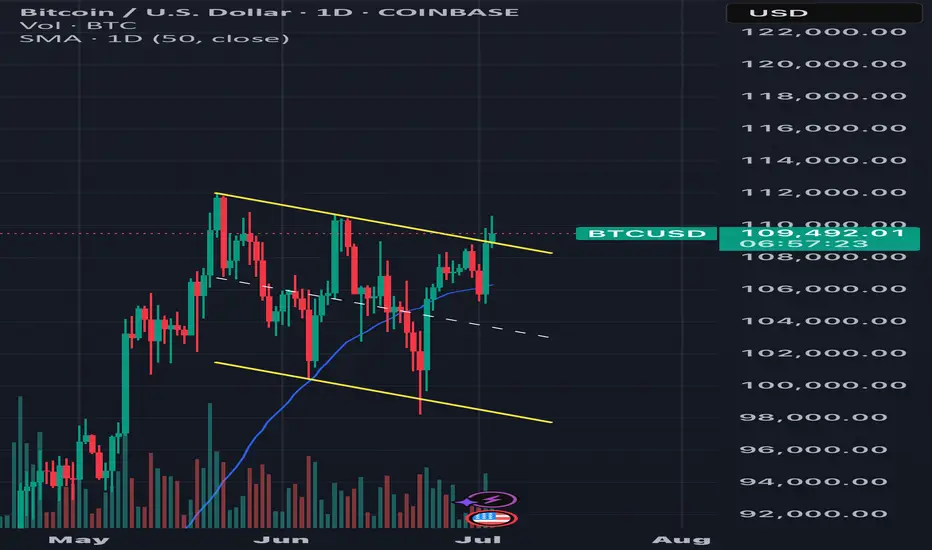
Bitcoin cryptocurrency recently reversed down from the major long-term resistance level 110000.00 (which has been steadily reversing the price from the start of this year, as can be seen below) – intersecting with the upper daily Bollinger Band.
The downward reversal from the resistance level 110000.00 stopped the previous medium-term impulse wave (3) from the start of June.
Given the strength of the resistance level 110000.00 and the overbought daily Stochastic, Bitcoin cryptocurrency pair can be expected to fall to the next support level 105000.00 (low of the previous correction (2)).
BTCUSD.PI trade ideas

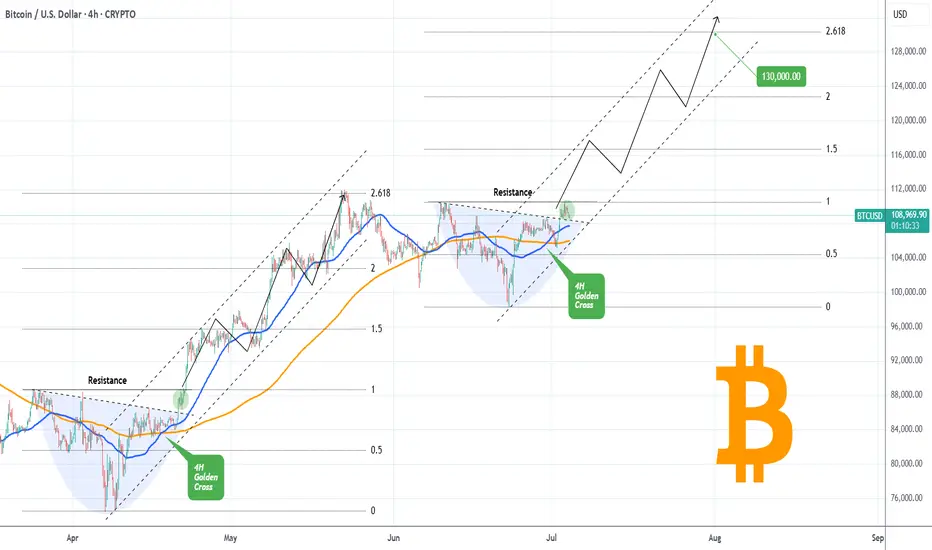
BITCOIN Golden Cross going to slingshot it to $130kBitcoin (BTCUSD) has completed a Golden Cross on the 4H time-frame and is attempting to keep the 4H MA50 (blue trend-line) as Support. If successful, it has high probabilities of staging a Channel Up similar to April - May, which peaked on the 2.618 Fibonacci extension.
So far, the bases of those to fractals are virtually identical, with a Lower Highs trend-line initially acting as a Resistance, which broke and on the current one it is testing the final Resistance (dotted trend-line).
This is the green circle, which on April 21 staged a quick consolidation before breaking aggressively upwards. If the pattern continues to repeat itself, we can get $130k (Fib 2.618 ext) at the end of the Channel Up.
Do you think it will? Feel free to let us know in the comments section below!
-------------------------------------------------------------------------------
** Please LIKE 👍, FOLLOW ✅, SHARE 🙌 and COMMENT ✍ if you enjoy this idea! Also share your ideas and charts in the comments section below! This is best way to keep it relevant, support us, keep the content here free and allow the idea to reach as many people as possible. **
-------------------------------------------------------------------------------
💸💸💸💸💸💸
👇 👇 👇 👇 👇 👇
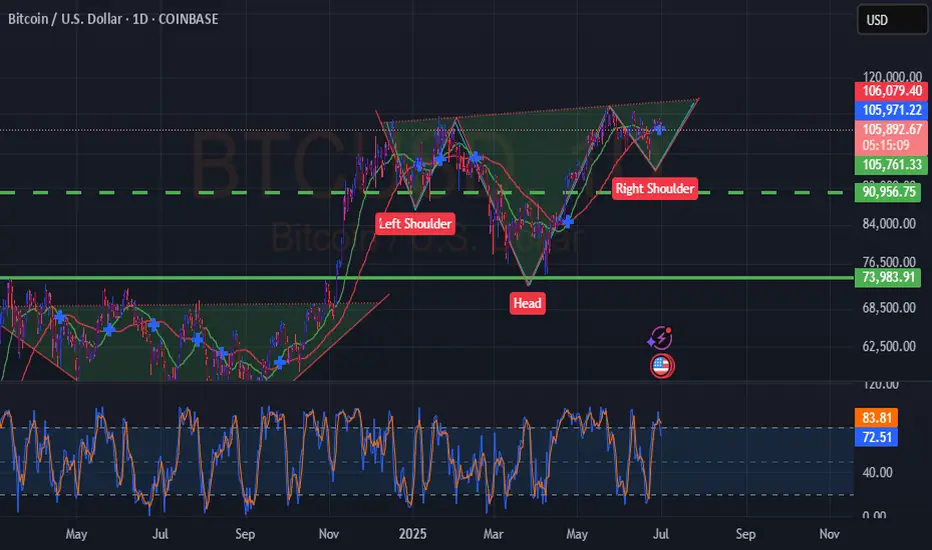
BITCOIN Can this Inverse Head and Shoulders deliver $168000?We saw yesterday how Bitcoin (BTCUSD) has been trading within a short-term Channel Down pattern, which as mentioned was just a Bull Flag on the long-term scale.
Today we examine this on the longer term time-frame and what stands out on 1D is an Inverse Head and Shoulders (IH&S). Such patterns are incredibly bullish but are more often seen on market bottoms initiating strong long-term bullish reversals.
This time it has been formed on a 1W Bull Cycle uptrend (Channel Up), so it technically serves as a (very) long-term Accumulation Phase between the Cycle's previous All Time High (ATH) and the next one, which most likely will be the final (peak) of the Bull Cycle.
As mentioned numerous times in the past, IH&S patterns target their 2.0 Fibonacci extension level once broken. That is now at $168000 and falls well within the broader 150 - 200k range that most studies have as a potential Cycle Top.
So do you think that is realistic to expect? Feel free to let us know in the comments section below!
-------------------------------------------------------------------------------
** Please LIKE 👍, FOLLOW ✅, SHARE 🙌 and COMMENT ✍ if you enjoy this idea! Also share your ideas and charts in the comments section below! This is best way to keep it relevant, support us, keep the content here free and allow the idea to reach as many people as possible. **
-------------------------------------------------------------------------------
💸💸💸💸💸💸
👇 👇 👇 👇 👇 👇

Break-Out Bros vs. Range Followers – will BTC rip?Bitcoin just kissed the channel roof at 109–110 k. Same line has stuffed every rally since April, so 112 k on a daily close is the whole story: print it and we leave the dungeon.
Under the hood the bulls finally have ammo – price back above the 50-day, bands squeezed, volume upticking, RSI mid-50s. Enough spark to torch shorts if resistance snaps.
Range Followers aren’t sweating. Their cash machine is simple: dump 110 k, scoop 100 k. Holiday liquidity = fake-out heaven. Slip under 105 k and gravity drags us straight to that comfy demand couch.
So it’s binary: close over 112 k, momentum fires toward 118 k; fail, and we ping-pong in the box again. Pick a side, slap on a stop, and remember: Bitcoin’s favourite sport is humiliating whichever crowd screams loudest.
Bitcoin: Breakout To 113K Refuses To Pull Back.Bitcoin is poised to test the 113K resistance over the coming week. It has broken the upper trend line resistance and simply refuses to retrace in any meaningful way. With a continuously weakening dollar and other economic inflationary pressures, it will take a surprise negative catalyst to turn this around at least to the point of testing a high probability trend support on this time frame. Here is the way to play this environment:
Buying this breakout for time horizons longer than a swing trade requires a big risk tolerance. While this leg is likely to be the Wave 5 of 5 that I have been writing for some time and can see Bitcoin test some major new highs, investing here still puts you at the mercy of the market. The nearest support is around the 103 to 105K area at minimum and just not worth the risk in my opinion at current levels for INVESTING.
Swing trades are a great way to participate in the breakout continuation. Risk can best be defined by the current candle low or previous candle low. Profit objective now is 113K or 120K area. The Trade Scanner Pro actually called a long and offered numerous opportunities to enter over a week and a half ago. I have been reviewing this regularly on my live stream forecast every Monday at 3 PM ET. It helps immensely to have levels and risk defined for these type of situations in advance so that you know how to adjust your size.
Otherwise the optimal way to go about this is trade the smaller time frames. I will always suggest this near highs and breakouts on larger time frames. The reason is simple: risk can be tightly controlled. This requires some kind of rules or guidelines to judge the market, along with a way to confirm. Using the Trade Scanner Pro for example, the analysis component is easy: trend is bullish on all small time frames. This means you wait for a trade suggestion on the time frame that you regularly trade (1 min or 5 min f or example).
No matter what type of trend following system or rules you use, by aligning with the bigger picture and confirming a setup in some way is what puts the probabilities on your side. The smaller the time frame you operate, the more precise your risk management can be.
Thank you for considering my analysis and perspective.

"BTC - Time to buy again!" (Update)Bitcoin is now at a point where it cannot be ignored! In my view, the bullish wave has started after the corrective wave ended. This wave could continue until it breaks the ascending triangle, then with a slight correction, push the price upward again. The current period and the coming days could be crucial in determining the market's trend.
Best regards CobraVanguard.💚

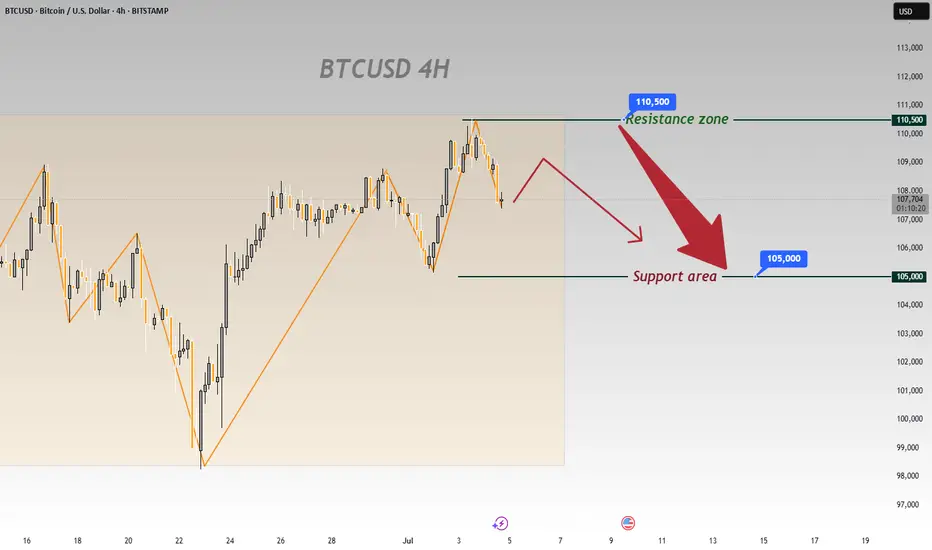
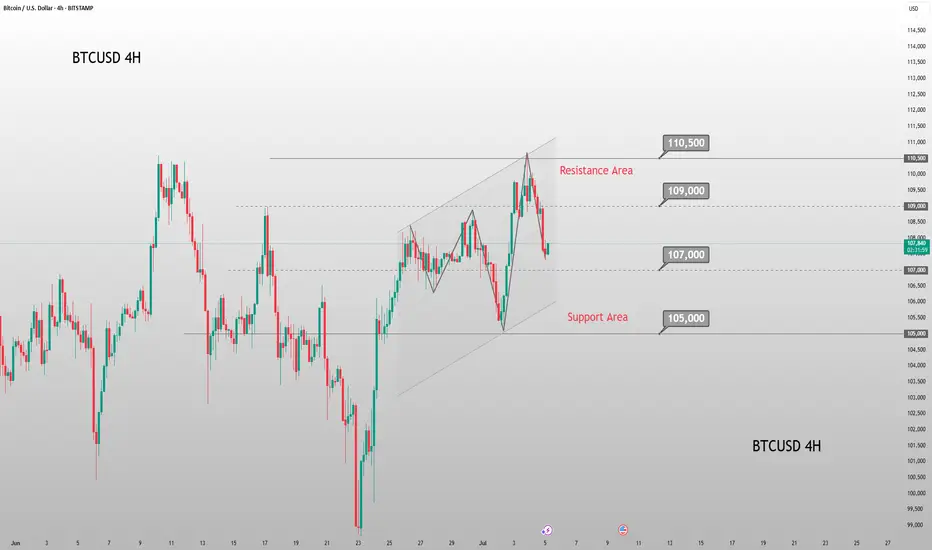
On BTCUSD’s 4 - hour chart, downside risks prevailOn BTCUSD’s 4 - hour chart, downside risks prevail:
Resistance Holds
Price failed to break 110,500, showing strong selling pressure that caps bulls 🚫. A pullback is likely.
Downtrend Signals
Post - resistance, price is retracing. Candlesticks and chart arrows point to a drop toward 105,000 support, fueled by building bearish momentum ⬇️.
Support Test Looms
105,000 is the next key level 🔑. Even if support slows the fall, the setup favors downside—bullish reversals seem unlikely after resistance failure.
Trend Weakness
Orange trendlines show the prior uptrend is fragile 🧊. Failing at 110,500 signals fading bullish force, setting up for a bearish correction.
In short, the 4 - hour chart is bearish. Watch for drops to 105,000; 110,500 will likely block bulls 🛑. Trade cautiously with this bias.
🚀 Sell@108500 - 107500
🚀 TP 106500 - 105500
Accurate signals are updated every day 📈 If you encounter any problems during trading, these signals can serve as your reliable guide 🧭 Feel free to refer to them! I sincerely hope they'll be of great help to you 🌟 👇
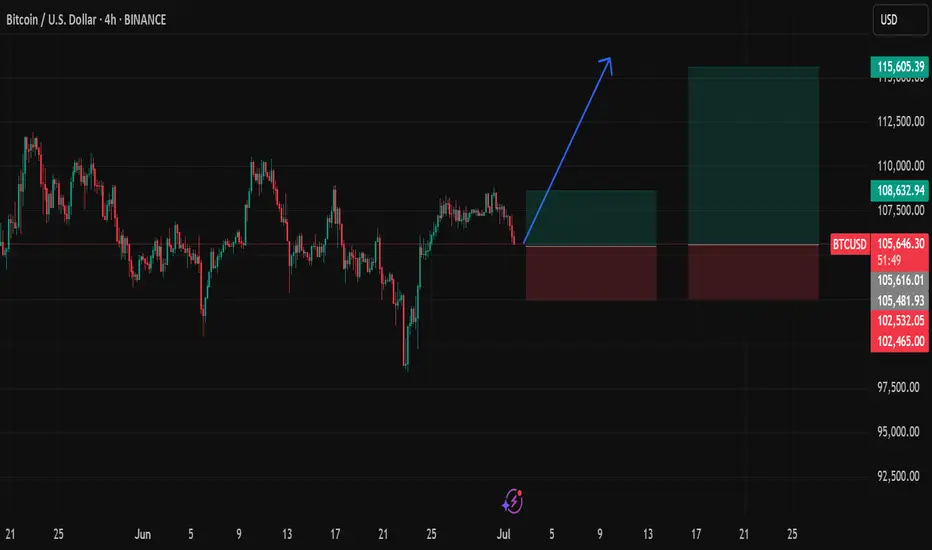
BTC LONG TP:110,000 30-06-2025Still riding the bullish pattern 🚀
Looking for an entry between 106,200 – 106,700, targeting 109,500 – 110,500, with a clean 4 RR average.
🕓 Timeframe: 4H
⏳ Duration: 40–50 hours
Context: This is all about catching a manipulative wick — small entry now, stack more if price hits the suggested levels later.
If the move doesn’t happen within the estimated time, the trade is invalid.
We don’t use indicators, we’re not out here drawing lines or cute little shapes — I just give you a clean trade.

Weekend BTC Trend Analysis and Trading SuggestionsLet's review this afternoon's market performance. The BTC price, as we anticipated, rebounded to around 109,000 in the afternoon before plummeting sharply. Living up to "Black Friday", this violent drop was well within our expectations. In the afternoon's live trading, we also reminded everyone that as long as there was a rebound to the upper zone, it was a good opportunity to go short. This drop has created a space of nearly 1,500 points. Currently, the BTC price has pulled back to around 107,800.
From the current 4-hour K-line chart, after a strong upward surge, the market encountered significant resistance near the upper track of the Bollinger Bands. As bullish momentum gradually faded, the price started to come under pressure and decline, suggesting that the short-term upward trend may come to a temporary halt. At present, the market has recorded multiple consecutive candlesticks with large bearish bodies. The price has not only effectively broken below the key support level of the Bollinger Bands' middle track but also caused the Bollinger Bands channel to switch from expanding to narrowing, indicating that market volatility is decreasing. In terms of trading volume, it showed a moderate increase during the price pullback, which further confirms the authenticity of the bearish selling pressure.
BTCUSD
sell@108000-1085000
tp:107000-106000
Investment itself is not the source of risk; it is only when investment behavior escapes rational control that risks lie in wait. In the trading process, always bear in mind that restraining impulsiveness is the primary criterion for success. I share trading signals daily, and all signals have been accurate without error for a full month. Regardless of your past profits or losses, with my assistance, you have the hope to achieve a breakthrough in your investment.
BTC Maintained Bullish Structure Above Key SMAsAs of now, the trend remains bullish, with $112,000–$115,000 as the next levels to watch. If those break, the $124,000 inverse H&S target is in play.


Btc will test 9kDon’t use too much thinking it’s simple FVG down below and will prob test this level again hoping for a massive institutional inflow and rate cuts could be consolidating for months.

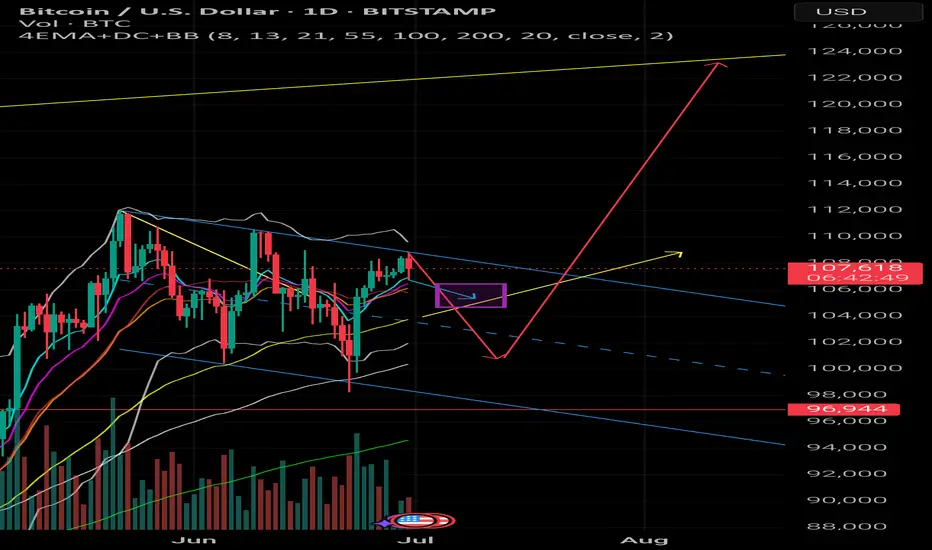
Bitcoin’s Breathing Zone – Watching for a Natural Snap Setup📊 Bitcoin Daily – Probabilistic Swing Scenario
I’m closely watching a probabilistic swing setup based on natural price oscillations and EMA wave dynamics.
The current structure suggests that Bitcoin could need a deeper retracement to the 100k - 102k zone to allow the short-term EMAs to snap together just above the 55 EMA.
This is typically where the market builds energy for significant moves.
I've highlighted this potential snap zone and the expected price flow in the chart.
If the price compresses in this area, it could trigger a move towards the upper yellow trendline around 124k.
A clean pullback followed by EMA clustering is usually the kind of natural swing that opens the door for explosive price action.
From there, a retest around 108k - 110k would not only be healthy – it would likely serve as the launchpad for a possible extension towards the macro target zone of 160k - 180k.
I trade probabilistic scenarios based on natural market rhythms, EMA waves, and energy compression zones.
What’s your view on this? Are you tracking a similar path?
bearish divergence on the weekly , pullback seems to be comingafter a bullish run up , it looks like it is about time to cool down a bit . retrace to below 100k , and test support . bearish diversion is clearly showing on the bigger timeframes and can play out very soon.

BTC Slumps Below 100000, Rebounds to Test 109500 Short Zone💎 BTC Rebounds After 100000 Drop, Eyes Short at 109500 Resistance 📊
BTC dipped below the 100000 threshold 🔻 before rebounding near 98000 🔺—a move tied to DXY weakness and easing geopolitical tensions. Now challenging the 110000 mark 🔼, it faces stiff resistance at 109500. First-time 110000 tests often spark pullbacks, making shorts the favored play here 📉.
🚀 Sell@108500 - 107500
🚀 TP 106500 - 105500
Accurate signals are updated every day 📈 If you encounter any problems during trading, these signals can serve as your reliable guide 🧭 Feel free to refer to them! I sincerely hope they'll be of great help to you 🌟 👇

Bitcoin-Potential bullish bounce off an overlap supportBitcoin (BTC/USD) is falling towards an overlap support and could potentially bounce off this level to climb higher.
Buy entry is at 106,535.50 which is an overlap support that aligns with the 23.6% Fibonacci retracement.
Stop loss is at 104,600.00 which is a level that lies underneath a swing-low support and the 38.2% Fibonacci retracement.
Take profit is at 108,808.50 which is a multi-swing-high resistance.

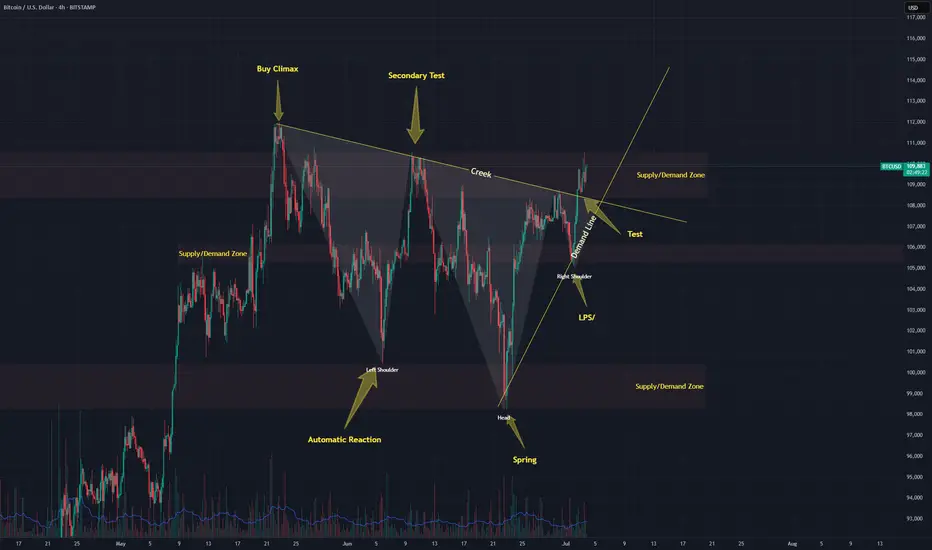
Markup coming for Bitcoin?I might have been entirely wrong about BTC. Are we finishing a re-accumulation pattern and about to markup?
Ugly inverted dandruff forming with the Wyckoff structure. Lets see what happens
#BTC #BITCOIN #WYCKOFF
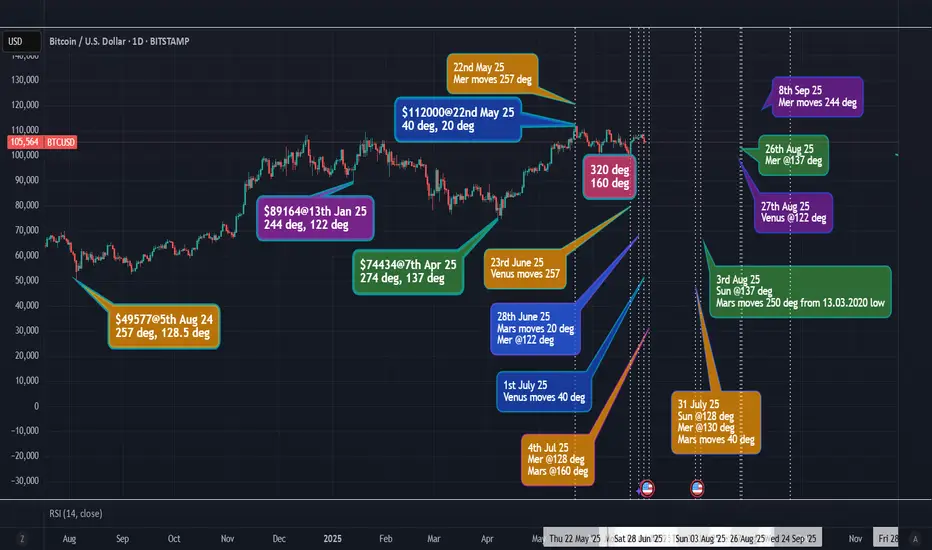
BTC - change in trend - GANN's price = planetary long/movesThis is based on GANN's price squaring planetary longitude and planetary movements. The color-coding is to match the price in degree with the expected future dates for change in trend marked on the chart.
BTCUSD – Rejection or Reload?BTC surged from $105K to above $110K in one of the strongest single-day impulses lately. Price is pausing at resistance near $110,300 with a minor pullback in play. The structure remains intact unless it drops below $108,600. Above $110,300 would unlock next leg higher.

Btc Usd IH&SHi all. BTC is in an IH&S on top of a larger IH&S pattern it seems. Pullback to 96K possible. But looking good for longer term trades. I'm sure this will pump, not 70K as most are saying, 90K is the lowest for now imo. Not financial advice. Please do your own research. Please leave a like, some motivation for an update. Good luck with your next trade.
Bulls on PauseBreak-out bulls fired a blank. Unless 112 k is clawed back fast, expect Bitcoin to cool toward 104–106 k or even 100 k before the next real attempt. Stay patient, let the squeeze resolve, and remember: the first candle out of a volatility pinch usually sets the week’s narrative.

Is Bitcoin Still a Hedge? What the Iran Israel Conflict RevealsAs geopolitical tension between Iran and Israel escalates, markets are once again gripped by fear. Oil prices have surged, gold has rallied, and investors are rebalancing portfolios in anticipation of further instability. Amidst this backdrop, Bitcoin's behavior is raising fresh questions about its role as a geopolitical hedge.
Bitcoin’s Initial Reaction: A Spike and a Slip
When the first reports of conflict broke, Bitcoin spiked alongside gold. Many hailed this as proof that BTC was becoming a reliable safe haven. However, just days later, prices retraced by roughly 6 to 7 percent as volatility intensified.
As usual, Bitcoin is still highly sentiment driven. While gold held its gains, BTC mirrored risk on assets with intraday volatility, undermining its hedge narrative.
BTC vs. Traditional Safe Havens
Let’s compare Bitcoin’s performance to:
• Gold: Continued upward trend, record ETF inflows
• Oil: Strong rally due to supply shock fears
• USD: Moderate gains as a traditional reserve asset
Bitcoin’s pullback during peak uncertainty suggests that in times of extreme stress, traditional assets still dominate flight to safety behavior.
What the On Chain Data Shows
Interestingly, on chain activity also hints at caution. Exchange inflows increased slightly after the conflict news, suggesting profit taking or reduced conviction among holders.
Moreover, stablecoin volume spiked in Middle Eastern regions — a signal that users may prefer capital preservation over speculation during geopolitical risk.
The Takeaway: Not There Yet
Bitcoin is maturing, and its response to global events is evolving. But this conflict reveals it is not yet a full fledged hedge like gold or the dollar.
For investors, the lesson is clear: BTC can act as a partial hedge in medium term macro trends, but during sharp geopolitical escalations, traditional assets still lead.
What Do You Think?
Is Bitcoin still on track to become a true safe haven asset? Or will it remain a risk sensitive speculative instrument?
