Another crash?Crypto Market Crash: U.S.-Iran War Triggers Bitcoin Drop Below $101K and Sparks Panic selling, experts warn that this may just be the beginning.
While BTC’s price dropped to almost $98K, there was enough market response to support going back above that psychological six-figure mark by the day’s close.
However, the crypto market is extremely vulnerable to global flashpoints, especially when there’s potential for escalation,” said a senior analyst from CoinGape. “We’re now in a wait-and-watch phase, but if Iran retaliates or tensions spread, crypto markets could face another brutal leg down.
In the short term, the US involvement in the Israel-Iran conflict will result in a massive crypto market crash, as short sells would form. The Bitcoin price could drop nearly 10-20%, crashing altcoins and the rest of the market amid panic and risk-off sentiments.
Similar to recent reactions, the investors may shift to USD, gold, and safe-haven assets, worsening the crypto’s performance. While it’s a crash, the oil price would rise, and the Fed would delay the rate cuts, further impacting crypto valuations.
BTCUSD.PI trade ideas
BTCUSD is bearishFrom the chart, you can see that btcusd is on bearish trend...
wait patiently for price to touch the trendline above. then wait for confirmation and sell from there.

BTC is expected to retreat in the short term, focus on 104500📰 Impact of news:
1. The ceasefire agreement reached earlier did not take effect, and Trump believed that both sides violated the agreement
2. Federal Reserve Chairman Powell delivered a speech 3 hours later
📈 Market analysis:
I haven't updated BTC for a while. Today I want to share my views on BTC with you. BTC is currently encountering resistance and pressure at the 106,000 level and is beginning to retreat. From the technical indicators, MACD is in a dead cross, and RSI is retreating after reaching the overbought area. There is no problem with the short-term bearish trend, and it is expected that it will be able to retreat to the 104,500 level without much problem. However, the recent decline in the gold market, DXY market, and crude oil market may cause funds to flow into the BTC market.
🏅 Trading strategies:
SELL 106000-105500
TP 105000-104500
BUY 140500-103500
TP 105000-106000
If you agree with this view, or have a better idea, please leave a message in the comment area. I look forward to hearing different voices.

Market next target ⚠️ Disruption Analysis – BTC/USD
1. Questionable Bullish Bias
The chart labels the structure as "Bullish," but the current setup looks more like a potential distribution phase than a healthy continuation pattern.
The price is moving sideways with declining volume, suggesting buyers are losing strength.
2. Volume Discrepancy
Notice the spike in volume during the sharp move up, followed by flat candles and lower volume.
This is typical of a "pump and fade" structure, where large players exit after a rapid price move, leaving retail traders with poor entries.
3. Resistance Not Clearly Broken
Price failed to sustain above 105,800–106,000, indicating that the resistance zone remains valid.
The recent rejection candles near this level suggest sellers are active and overhead pressure is strong.
4. Descending Into Compression
The blue "descending" structure before the sideways move may signal a bearish flag or a pause before further downside—not necessarily a bullish sign.
5. False Reversal Warning
The bullish pattern drawn with zig-zags (implying consolidation before continuation) could actually be setting up a bull trap.
If price fakes a bounce and then breaks below 104,800, a sharper decline toward the 103,000 target could accelerate quickly.


Bitcoin Targets $105K as Portfolio Share Soars But...
The year 2025 is proving to be a watershed moment for Bitcoin. The world's premier cryptocurrency has solidified its position as the bedrock of digital asset portfolios, now accounting for nearly one-third of all holdings, a testament to its growing acceptance as a legitimate macro-asset. Yet, this rising dominance belies a fractured and complex market landscape. While institutional giants and sovereign wealth funds systematically increase their Bitcoin allocations, a counter-current is flowing through the retail sector, where investors are rotating into high-potential altcoins, spurred on by the promise of new investment vehicles. This bifurcation is unfolding against a backdrop of dramatic price swings, conflicting technical forecasts, and a potent mix of macroeconomic and geopolitical catalysts, painting a picture of a market at a pivotal crossroads.
The headline statistic is striking: as of mid-2025, Bitcoin's share in investor crypto portfolios has climbed to nearly 31%, a significant increase from the previous year. This growth has persisted through months of volatility, including harrowing dips below the psychological $100,000 mark and powerful rallies reclaiming levels above $105,000. The market is being pulled in opposing directions. On one hand, bullish tailwinds are gathering force. A ceasefire in the Middle East has calmed geopolitical jitters, restoring appetite for risk assets. Simultaneously, hints from the U.S. Federal Reserve of a potential July interest rate cut have investors anticipating a surge of liquidity into the market.
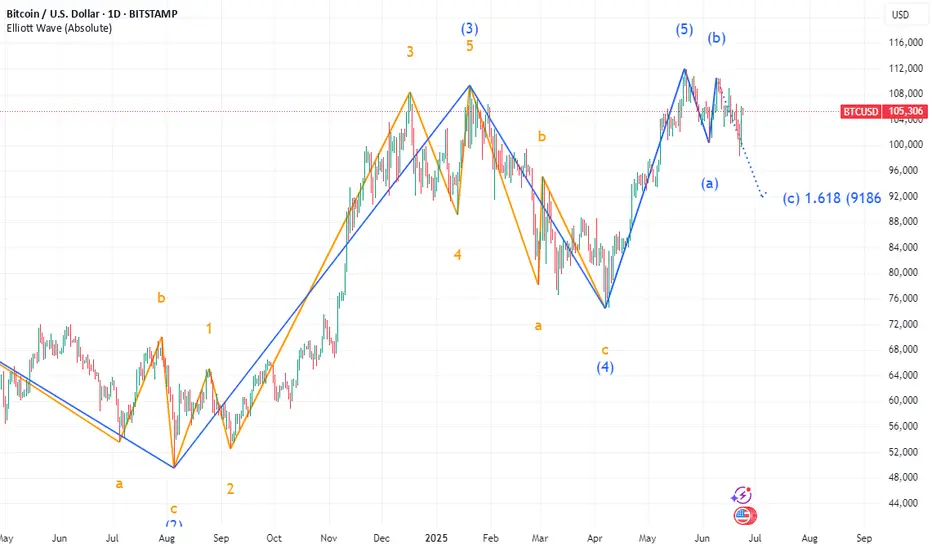
However, a sense of unease permeates the technical charts. Some analysts warn of a "final crash" still to come, drawing parallels to the market structure of 2021. On-chain analysis has identified the $97,000 to $98,000 range as a critical market pivot, a line in the sand that could determine the next major trend. Meanwhile, other models, like the Elliott Wave count, predict a corrective crash to as low as $94,000 before any new highs can be sustainably achieved.
This is the story of Bitcoin in 2025: a maturing asset cementing its institutional role while navigating the turbulent waters of retail speculation, macroeconomic shifts, and its own volatile price cycles. The journey toward becoming a third of all crypto holdings has not been a straight line, but a dramatic tug-of-war that will define the future of the digital asset class.
Part 1: The 31% Benchmark - Bitcoin's Ascendant Portfolio Dominance
The steady climb of Bitcoin to nearly 31% of investor portfolios is the defining trend of 2025. This figure, a cornerstone of market analysis this year, underscores a profound shift in investor conviction. Through a period marked by six-figure price tags and gut-wrenching volatility, the average investor has not been scared away but has instead deepened their commitment to the original cryptocurrency. This suggests a maturing "buy the dip" mentality, where price corrections are increasingly viewed not as a crisis, but as an opportunity to accumulate a long-term store of value.
The primary engine behind this trend is unmistakable: institutional adoption. The floodgates, first opened by the launch of spot Bitcoin ETFs, have become a torrent of institutional capital in 2025. Sovereign wealth funds, major financial institutions, and public companies are now systematically accumulating Bitcoin, treating it as a core component of their treasury and investment strategies. Observations of institutional trading desks indicate this buying pressure from large-scale investors intensified in the first half of the year, even as retail activity showed signs of slowing. This institutional stamp of approval is reflected in the growing number of Bitcoins held in various corporate treasuries and exchange-traded funds.
This institutional embrace of Bitcoin has been fueled by several factors. First, an increasingly innovation-friendly regulatory environment in the United States has provided the clarity that large, compliance-focused firms require. Second, Bitcoin’s performance has been undeniable. Following recent shifts in the political landscape, Bitcoin has outperformed many major global assets, including stocks, treasuries, and precious metals, solidifying its reputation as a powerful portfolio diversifier.
This "flight to quality" within the crypto space has also created a distinct rotation story. As institutions fortify their Bitcoin positions, they appear to be de-risking by moving away from more speculative assets that were darlings of the previous cycle. The most notable casualty of this shift has been Solana. Once a high-flyer, Solana's narrative has "cooled" in 2025. Its portfolio weight among investors has seen a sharp decline since late 2024, as institutional capital pivots toward assets with perceived staying power and clearer narratives. While some analysts see this cooling phase as a potential accumulation opportunity before a new leg up, the dominant trend has been a rotation out of Solana and into the perceived safety of Bitcoin.
Part 2: The Great Divide - A Tale of Two Investors
The crypto market of 2025 is characterized by a stark divergence in strategy between its two main cohorts: institutional players and retail investors. While their actions collectively push Bitcoin's portfolio share higher, their underlying motivations and asset choices paint a picture of two different worlds.
The Institutional Playbook: Slow, Steady, and Strategic
For institutions, Bitcoin has become the undisputed king. Their approach is methodical and long-term, driven by a desire for a non-sovereign, inflation-resistant asset that acts as a hedge against macroeconomic instability. The attributes of scarcity, immutability, and portability are paramount in their decision-making. The advent of regulated products like spot ETFs has been a game-changer, providing a familiar and secure access ramp for deploying significant capital.
These large players are not chasing the explosive 100x gains that define crypto lore. Instead, they seek sustained, risk-adjusted returns from an asset that is increasingly uncorrelated with traditional markets during times of stress. Their strategy is one of accumulation, and their exit from more volatile altcoins like Solana is a clear signal of a de-risking mandate. They are building foundational positions in the asset they view as "digital gold," positioning themselves for a future where Bitcoin is a standard component of diversified global portfolios.
The Retail Rebellion: Chasing the Next Big Narrative
In stark contrast, retail investors appear to be reducing their direct Bitcoin holdings. This is not necessarily a rejection of Bitcoin's value, but rather a strategic reallocation of capital toward what they perceive as the next frontier of high growth. Having witnessed Bitcoin's journey to a multi-trillion-dollar asset, many retail participants are now hunting for "the next Bitcoin"—assets with a lower market capitalization but a powerful, near-term catalyst that could trigger exponential gains.
Part 3: The Analyst's Crystal Ball - Price Targets and Technical Tremors
Navigating the Bitcoin market in 2025 requires a steady hand and a tolerance for conflicting signals. While macro-environmental factors are painting a bullish picture, technical and on-chain analyses are flashing cautionary signs, creating a tense equilibrium between hope and fear.
The Bullish Case: A Confluence of Catalysts
The bulls have strong reasons for optimism. A key level on every trader's chart is $105,000. This price is seen as a critical "trend switch"; a decisive break and hold above this zone would signal the end of the recent consolidation and the beginning of a new, powerful phase of the bull market. This optimism is underpinned by powerful external forces.
First, the U.S. Federal Reserve has been signaling a potential interest rate cut as early as July. Historically, lower interest rates reduce the appeal of traditional yielding assets like bonds, pushing investors toward riskier, high-growth assets. This injection of liquidity into the financial system has often preceded significant rallies in Bitcoin, and the market is pricing in this possibility.
Second, a significant de-escalation of geopolitical tensions has bolstered market confidence. The announcement of a ceasefire between Israel and Iran caused an immediate and positive reaction in risk assets. Bitcoin surged past $105,000 on the news, demonstrating its sensitivity to global stability. During times of acute conflict, markets often experience a flight to safety, but when tensions ease, that capital flows back into assets like Bitcoin, which thrive on renewed risk appetite.
The Bearish Counterpoint: Echoes of the Past and On-Chain Warnings
Despite the bullish macro-outlook, clouds remain on the horizon. Some market commentators are warning that the current market is mirroring the patterns of 2021, suggesting that one "final crash" may be necessary to flush out leverage and establish a firm bottom before a sustainable move to new all-time highs.
This thesis is supported by specific technical models. Proponents of Elliott Wave Theory, a method of analysis that posits markets move in predictable, repetitive wave patterns, suggest a significant correction is due. Some Elliott Wave counts predict a corrective move down to the $94,000 level, which would represent a substantial pullback from current prices. Such a move would be seen as a healthy, albeit painful, corrective wave before a final, explosive impulse higher.
Adding weight to this cautious outlook is deep on-chain analysis. A close look at blockchain data pinpoints the $97,000 to $98,000 zone as the market's next true "pivot." This range represents a massive concentration of supply where a large volume of Bitcoin was previously acquired. This means a large cohort of investors has a cost basis in this zone. As the price approaches this level from below, it will likely meet significant selling pressure from investors looking to break even. A failure to decisively break through this wall of supply could trigger a sharp rejection and validate the bearish corrective scenarios.
The Derivatives Dilemma: A Market in Flux
Further complicating the picture is the state of the Bitcoin derivatives market. Reports indicate that futures buying activity has declined sharply, suggesting that the speculative fervor that often fuels rallies may be waning. This can be interpreted in two ways. The bearish view is that speculators are losing confidence, and the market lacks the momentum for a continued push higher. However, a more bullish interpretation is that the market is purging excessive leverage, creating a more stable foundation for a rally built on spot buying—the very kind of buying being done by institutions. This faltering derivatives activity, contrasted with strong institutional spot accumulation, could mean the current rally is in "stronger hands" than previous, more speculative-driven cycles.
Part 4: The Broader Ecosystem - A Story of Diverging Fates
The cross-currents shaping Bitcoin's trajectory are creating ripple effects across the entire crypto ecosystem, with the diverging fortunes of XRP and Solana serving as perfect case studies for the market's 2025 themes.
Beyond the Majors: The Speculative Fringe
As always, the crypto market maintains a speculative fringe. The emergence of assets like "BTC Bull Tokens" represents the high-leverage, high-risk plays that appear during bull markets. These instruments are designed to offer amplified returns on Bitcoin's price movements and attract the most risk-tolerant traders. Their existence underscores the full spectrum of the market—from sovereign wealth funds methodically buying Bitcoin for their treasuries to degens betting on leveraged tokens, the digital asset ecosystem remains a place of immense diversity and opportunity.
Conclusion: Bitcoin's Maturation in a Fractured Market
The year 2025 will be remembered as the year Bitcoin truly came of age as an institutional asset, firmly planting its flag and claiming one-third of the crypto investment landscape. This growing dominance, driven by the steady, strategic accumulation of the world's largest financial players, has provided a powerful anchor in a volatile market.
Yet, this newfound maturity has not tamed the market's wild spirit. It has instead created a great divide. While institutions build their Bitcoin fortress, retail investors are on the hunt for the next narrative-driven explosion, pouring capital into assets like XRP with the hope of front-running a transformative ETF approval.
The market is consequently balanced on a knife's edge. Bullish macroeconomic and geopolitical tailwinds are pushing for a breakout to new all-time highs beyond the pivotal $105,000 level. At the same time, technical and on-chain analyses warn of a potential final washout, a corrective crash to the mid-$90,000s that may be necessary to reset the market for a sustainable ascent.
Bitcoin's path forward will be carved by the resolution of these opposing forces. Can the quiet, persistent demand from institutions absorb the selling pressure from short-term traders and navigate the technical resistance zones? Or will the speculative fervor and corrective patterns that have defined its past cycles pull it down once more before it can climb higher? Whatever the outcome, 2025 has made one thing clear: Bitcoin is no longer just a speculative digital curiosity. It is a global macro asset at the heart of a complex and evolving financial ecosystem, and its journey is far from over.
#Bitcoin - Pivot Point is $107306.60 & Expecting 3000 Pts MoveDate: 16-06-2025
#Bitcoin Current Price: 107650
Pivot Point: 107306.60 Support: 106281.06 Resistance: 108337.05
#Bitcoin Upside Targets:
Target 1: 108804.75
Target 2: 109272.44
Target 3: 110009.63
Target 4: 110746.82
#Bitcoin Downside Targets:
Target 1: 105810.91
Target 2: 105340.76
Target 3: 104603.57
Target 4: 103866.38

CHECK BTCUSD SIGNAL READ CAPTAINbtcusd buy now ✅
entry point (105700.00) (105500.00)
TAKE PROFIT 1: (104850.00)
TAKE PROFIT 2: (104000.00)
LAST TARGET(103200.00)
STOP LOSS (106500.00)

Bitcoin - Looking To Buy Pullbacks In The Short TermM15 - Strong bullish move.
No opposite signs.
Currently it looks like a pullback is happening.
Expecting further continuation higher until the two Fibonacci support zones hold.
If you enjoy this idea, don’t forget to LIKE 👍, FOLLOW ✅, SHARE 🙌, and COMMENT ✍! Drop your thoughts and charts below to keep the discussion going. Your support helps keep this content free and reach more people! 🚀
--------------------------------------------------------------------------------------------------------------------

Short Setup on BitcoinA solid short setup has emerged on Bitcoin.Trend is bearish — price is trading below the moving averages.
The setup offers a favorable risk-to-reward ratio within the prevailing downtrend.
📝Trade Plan:
Entry: At current market price
Stop Loss: Above the resistance level at 107,145
Target: Price zone around 94,000–95,000

June 23 Bitcoin Bybit chart analysisHello
This is Bitcoin Guide.
If you "follow"
You can receive real-time movement paths and comment notifications on major sections.
If my analysis was helpful,
Please click the booster button at the bottom.
This is the Bitcoin 30-minute chart.
The Nasdaq seems to be rising without any problems,
but Bitcoin is under pressure from the MACD dead cross on the weekly chart as it has been adjusted strongly over the weekend.
Depending on the real-time situation, it seems advantageous to operate safely
short-term trading or both-way trading this week.
I created today's strategy based on the Nasdaq movement and the Tether dominance pattern.
*One-way long position strategy when the red finger moves
1. $100,587.9 long position entry section / hand drop when the purple support line is broken
2. $103,953.8 long position target price / Good 2nd target price thereafter
From the purple support line breakout, the weekly chart
candle low point created this week is broken, so it is better to maintain it without breaking out from the long position position.
If it breaks out, it can be pushed to the bottom -> 2nd section.
The 1st section marked in the middle
If it doesn't come down to the long entry point today
It is a vertical rise section
And the pink finger in the middle indicates the short-term target price -> additional long entry section
And the Gap8 section was created at the top due to last week's movement
I think it would be good to refer to it while trading.
Up to this point, I ask that you simply use my analysis for reference and use
I hope that you operate safely with principle trading and stop loss prices.
Thank you.

Bitcoin / U.S. Dollar 4-Hour Chart - June 24, 20254-hour chart displays the Bitcoin (BTC) to U.S. Dollar (USD) price movement, currently at $105,121.98, reflecting a decrease of $258.74 (-0.25%) as of 03:15:58. The chart highlights a recent downward trend with a potential support level around $103,509.67 and a resistance zone between $104,651.27 and $107,154.41, indicated by shaded areas. The time frame spans from June 6 to June 25, 2025.

BTC/USD 15M CHART PATTERNYou're sharing a short trade setup for BTC/USD on the 15-minute timeframe. Here's a breakdown of your trade plan:
---
📉 Sell Entry
Entry Price: 104800
---
🎯 Take-Profit Targets
TP1: 103400
TP2: 102100
TP3: 100428
---
🛑 Stop Loss
SL: 107100
---
⚖ Risk-Reward Overview
Here’s a rough idea of the risk-to-reward ratio for each target:
1. TP1:
Risk: 107100 - 104800 = 2300
Reward: 104800 - 103400 = 1400
RR ≈ 0.61:1
2. TP2:
Reward: 104800 - 102100 = 2700
RR ≈ 1.17:1
3. TP3:
Reward: 104800 - 100428 = 4372
RR ≈ 1.9:1
---
⚠ Notes
SL is relatively wide (2.2%) — make sure position sizing reflects that.
Targeting a full retracement down to ~100K area suggests high confidence in a local top or rejection zone.
---
Would you like:
A chart visualized for this setup?
Help converting this to a trading script or bot?
Backtest ideas for this strategy?
Let me know how you'd like to proceed.


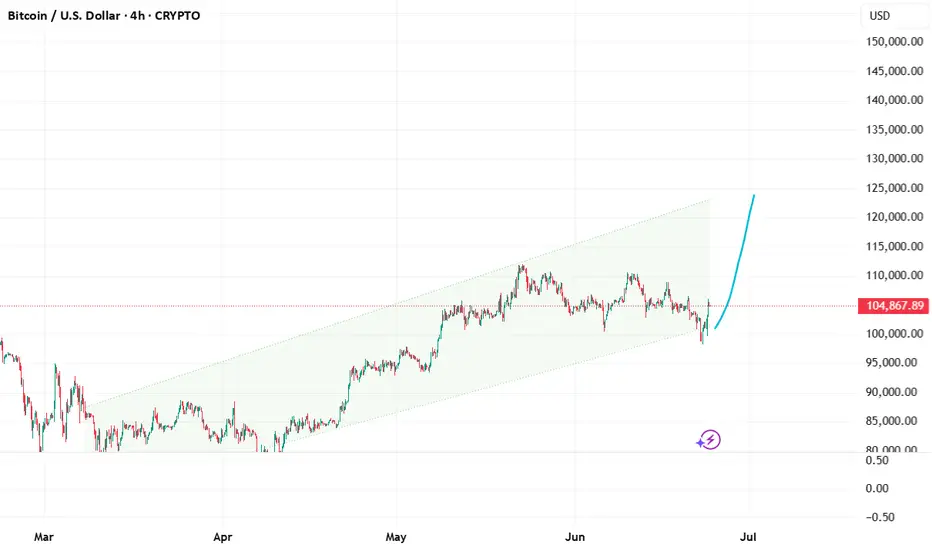
Bitcoin uptrend beginning?Bitcoin is experiencing a bounce from an important support level. If this level holds, can we see 130k?
A pull back from here to a minor support level at 103.400k is an important replacement level.
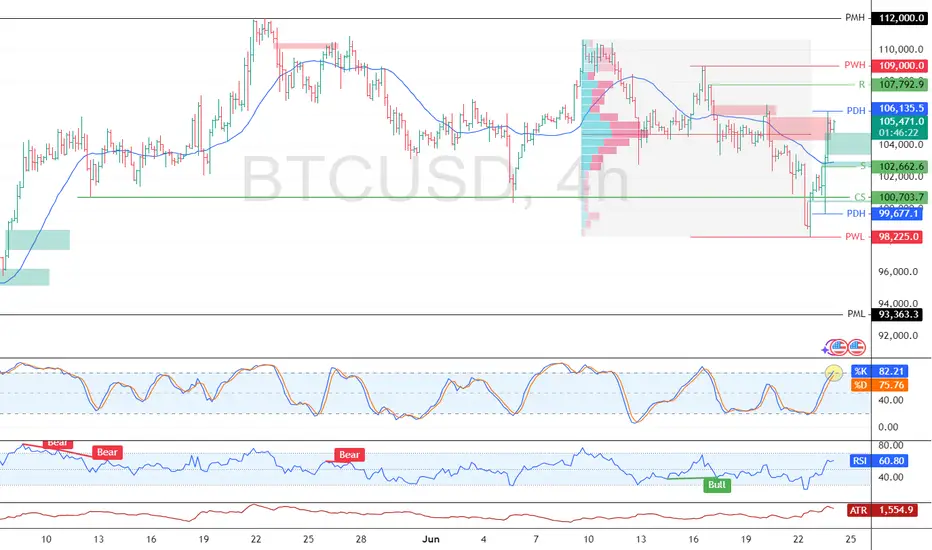
Bitcoin Rebounds Above $105K After Liquidity SweepFenzoFx—Bitcoin swept liquidity below $100,703.0 and rebounded to around $105,400.0, just above the volume profile point of interest.
Immediate resistance lies at $106,135.0. A break above this level could lead to a retest of $107,702.0. However, if resistance holds, BTC may consolidate toward $102,662.0, supported by Stochastic overbought signals.
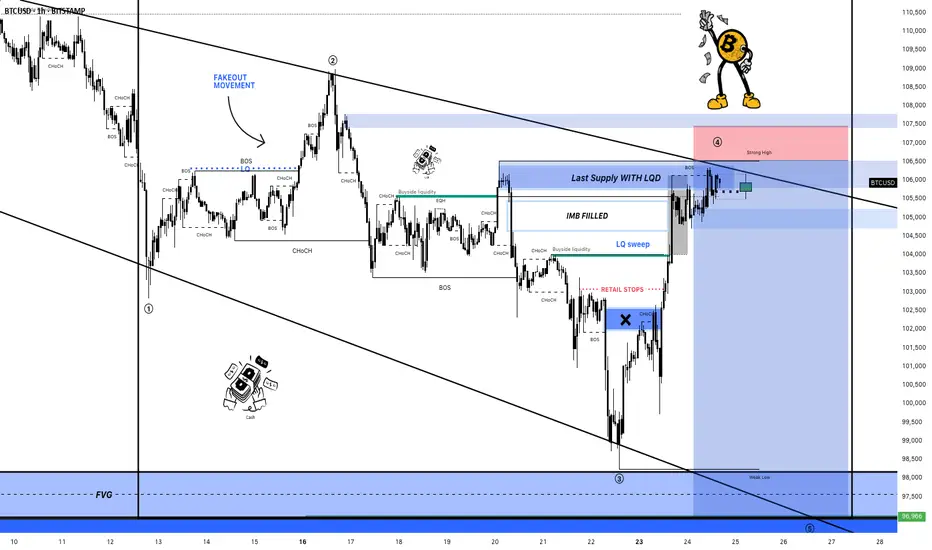
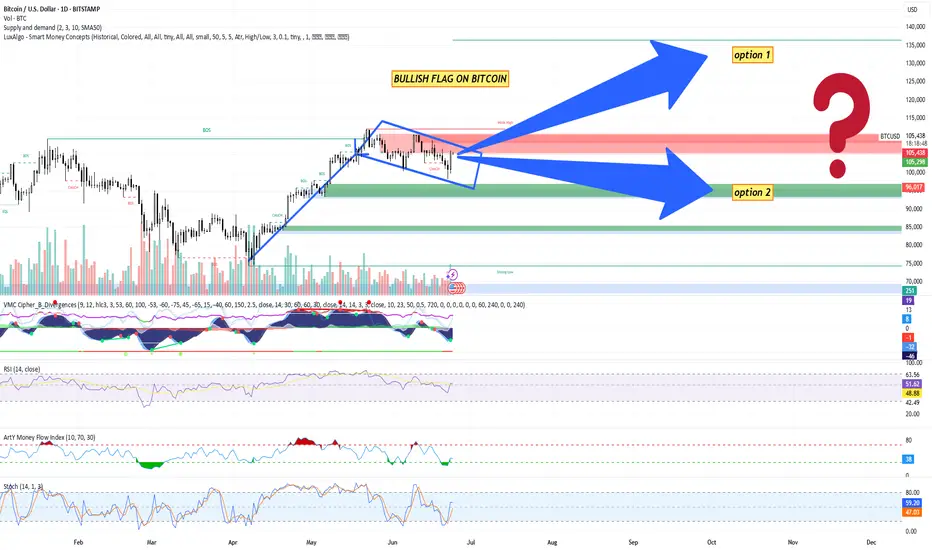
Bitcoin (BTC/USD) Technical Analysis + trade planBitcoin (BTC/USD) Technical Analysis – June 24, 2025
Pattern Identified: Bullish Flag Formation
A clear upward impulse leg followed by a downward-sloping consolidation (flag) indicates a continuation pattern.
The flag is bounded within a descending parallel channel, suggesting a potential breakout to the upside.
Break of Structure (BOS): Multiple BOS signals indicate strong market structure shifts favoring bullish continuation.
Change of Character (CHOCH): Minor CHOCH noted inside the flag, indicating local liquidity grabs but no trend reversal yet.
Key Levels
Current Price: ~$105,126
Flag Resistance: ~$105,291 (watch for breakout)
Major Supply Zone (Resistance): ~$115,000 (red zone)
Demand Zones (Supports):
$96,000 (minor)
$85,000 (medium strength)
$75,000 - $70,000 (strong low / high-confluence area)
Volume Analysis
Declining volume during flag formation supports the bullish flag hypothesis (low-volume pullback).
Anticipate increased volume on breakout for confirmation.
Indicators Summary
1. VMC Cipher B
Green dots signal potential local bottoms.
Wave trends support bullish reversal setup, though momentum still neutral.
2. RSI (14)
Current RSI: ~50.76
Neutral zone; not overbought/oversold – provides room for upside movement.
3. Money Flow Index (Art’y)
Positive inflow recovering, signaling accumulation phase.
4. Stochastic RSI
Blue line crossing above orange around 46. Indicates bullish crossover from the oversold region – early entry signal.
Bitcoin Trading Plan
Trading Bias: Bullish (Contingent on Flag Breakout)
Entry Plan
Breakout Entry: Enter long above $105,300 with confirmation (4H or daily candle close).
Aggressive Entry: Pre-breakout entry inside the flag at ~$104,000–$105,000, anticipating breakout.
Stop Loss
Conservative: Below $96,000 (below key support + 50 SMA).
Aggressive: Below $102,500 (inside flag, tighter stop).
Take Profit Levels
TP1: $110,000 (local high)
TP2: $115,000 (strong resistance zone)
TP3: $123,000–$125,000 (measured move from flag breakout target)
Measured Move Target: Height of the pole ($25K) added to the breakout zone ($105K) = Target zone: $130,000 (theoretical).
Alternative Scenario – Bearish Breakdown
If BTC breaks below $96,000, the bullish structure is invalidated.
In that case:
Look for short entries below $95,500.
Target zone: $85,000 – $75,000.
SL above $98,000.
Risk Management Guidelines
Risk per trade: 1–2% of capital
Use position sizing tools to determine trade size.
Monitor macroeconomic news (Fed, inflation, ETF flows) and crypto market sentiment.
To sum up things:
BTC is consolidating within a textbook bullish flag.
Momentum indicators align with a potential breakout.
Caution warranted until clear breakout occurs – volume confirmation is key.
Keep alert for fakeouts due to low summer volatility.
BTCUSDBTCUSD remains in a bullish leg with a projected target at 107,848, aligning with point B of a potential ABCD harmonic structure. Should price reach this level, we will closely monitor for a bearish reversal setup.
From a Smart Money Concepts (SMC) standpoint, we are identifying two key zones of interest for potential short entries:
A newly formed supply zone (order block) at 108,660,
The 107,848 level, corresponding with the anticipated completion of the B leg.
A valid short scenario will require confirmation through SMC triggers — such as a liquidity grab, followed by a break of structure (BOS) or change of character (CHOCH), ideally accompanied by displacement. Upon such confirmation, we will look to initiate short positions with appropriate risk management.

BTCUSD 6/23/2025Come Tap into the mind of SnipeGoat, as he gives you a nice quick analysis of Bitcoins current Price Action to determine Price's next move. THIS IS ONE YOU DON'T WANT TO MISS!
_SnipeGoat_
_TheeCandleReadingGURU_
#PriceAction #MarketStructure #TechnicalAnalysis #Bearish #Bullish #Bitcoin #Crypto #BTCUSD #Forex #NakedChartReader #ZEROindicators #PreciseLevels #ProperTiming #PerfectDirection #ScalpingTrader #IntradayTrader #DayTrader #SwingTrader #PositionalTrader #HighLevelTrader #MambaMentality #GodMode #UltraInstinct #TheeBibleStrategy

A TA Macro Look into Bitcoin to assess directionThis is a look into the macro developments happening currently in Bitcoin.
This is strictly a TA look into the big picture. We zoom out to Timeframes bigger than 1W.
At times zooming in to check (3 Day, 5 Day, maybe 1D) for potential swing trades.
I tend to look into things like price action, indicators, volume and other data to sway probabilities of where an asset may go and determine best opportunities of supply and demand zones based on my interpretations.
So jumping right in this is a look into price action on the 1 Month timeframe.
Notice trend lines drawn.
Notice the Ascending channel.
Notice the Blue rectangle zone.
Notice this months (June) Candle
Our current June candle is in a critical area.
We are around the horizontal resistance zone, indicated by red horizontal line.
This red horizontal resistance line is a powerful one.
Our previous interaction generated a massive Bearish engulfing monthly candle.
This area is not to be joked with and would urge to consider looking for more signs or better data to support continuation of bull run. If not a sell off is in the cards.
Notice our current June candle
Having equal length upper and lower wicks indicate that this month was neutral.
Bulls nor the Bears came on top.
If we close around this in 8 days.
Probabilities would be 50/50 just based on price action and candles for price movement in July.
We would need to look for other signs in indicators or something else, in other words look for confluence of multiple signs whether bull or bear.
The Ascending channel is also in my opinion over extended.
Notice the price action touch points on Green ascending support line.
The duration between touches is coming down.
2nd touch happened 365 days after first. Which was the initial part of Crypto bull market.
3rd touch happened 214 days after.
We are currently 61 days in after 3rd touch. Considering this and being logical, we could be getting close to another touch.
But consider also that the duration can extend well into in the 100's (of days), before we touch.
Notice also the Blue rectangle zone. This marks a side ways range of bitcoin.
The orange horizontal line is mid point of this blue zone.
A scenario could be that price goes to where the orange horizontal line meets the green sloping support line.
The confluence of these 2 support lines, can be a decent area for potential bounce (which can be temporary).
A break down of these 2 lines could also lead Bitcoin back down to the lower border of the Blue rectangle also indicated by Green horizontal line, which is a massive supply zone at the moment.
This scenario in my opinion would be a high probability trade by looking for bounce up but please keep in mind this does not mean a bull run would continue.
Look for more posts as things develop on Bitcoin.
DISCLAIMER: This is not financial advice, i am not a financial advisor. The thoughts expressed in the posts are my opinion and for educational purposes. Do not use my ideas for the basis of your trading strategy, make sure to work out your own strategy and when trading always spend majority of your time on risk management strategy.

Bitcoin Stock Chart Fibonacci Analysis 062325Trading Idea
1) Find a FIBO slingshot
2) Check FIBO 61.80% level
3) Entry Point > 100,622/61.80%
Chart time frame:C
A) 15 min(1W-3M)
B) 1 hr(3M-6M)
C) 4 hr(6M-1year)
D) 1 day(1-3years)
Stock progress:A
A) Keep rising over 61.80% resistance
B) 61.80% resistance
C) 61.80% support
D) Hit the bottom
E) Hit the top
Stocks rise as they rise from support and fall from resistance. Our goal is to find a low support point and enter. It can be referred to as buying at the pullback point. The pullback point can be found with a Fibonacci extension of 61.80%. This is a step to find entry level. 1) Find a triangle (Fibonacci Speed Fan Line) that connects the high (resistance) and low (support) points of the stock in progress, where it is continuously expressed as a Slingshot, 2) and create a Fibonacci extension level for the first rising wave from the start point of slingshot pattern.
When the current price goes over 61.80% level , that can be a good entry point, especially if the SMA 100 and 200 curves are gathered together at 61.80%, it is a very good entry point.
As a great help, tradingview provides these Fibonacci speed fan lines and extension levels with ease. So if you use the Fibonacci fan line, the extension level, and the SMA 100/200 curve well, you can find an entry point for the stock market. At least you have to enter at this low point to avoid trading failure, and if you are skilled at entering this low point, with fibonacci6180 technique, your reading skill to chart will be greatly improved.
If you want to do day trading, please set the time frame to 5 minutes or 15 minutes, and you will see many of the low point of rising stocks.
If want to prefer long term range trading, you can set the time frame to 1 hr or 1 day.

$BTC Bullish Momentum Building Bitcoin has successfully broken CRYPTOCAP:BTC Bullish Momentum Building
Bitcoin has successfully broken above both the $100K support and the 50 EMA at $103K, showing strong signs of bullish continuation. A retest of $103K may occur, but structure now favors the upside.
🔸 Support Now at 103,000 – 100,000 (Acting as Support):
The breakout above $103K flips this zone bullish. If a retest holds, it confirms strength and could launch the next leg up.
🔸 Upside Target: 110,324 and Higher
Now that BTC is trading above $103K, a move toward $110K+ is likely. If momentum continues, a breakout beyond the previous high could follow.
🔸 Risk Level at 103K:
As long as BTC holds above this level on retest, bulls remain in control. A break back below would weaken the setup.
🔸 Outlook:
🔹 Watch for a successful retest of $103K – that’s your long trigger.
🔹 Target zone: $108K → $110K+
🔹 Invalidation: Close back below $103K
Momentum shifting bullish — setup favors continuation higher unless invalidated. Stay alert for breakout volume.
