BTCUSD CRACKing Everywhere!As I have been warning for a while now. See previous post.
I first warned to wait for the CRACK!
Then we got the 2nd CRACK!, very normal.
Then a nice M pattern with a lower high.
Then another CRACK!
And now a right Shoulder.
MAGIC!
Now we wait for the H&S to break down.
Click boost, follow, and subscribe for more. Let's get to 5,000 followers. ))
BTCUSD.PI trade ideas

Bitcoin to under 1000 by mid 2026Three drives of bearish divergence, proof of diminishing returns cycle once again, proving that next cycles diminished returns will not even break new highs after the bear marker...if there even is a next cycle... which I doubt will occur since the only appeal of bitcoin is to get rich quick and once it loses that then its over.
Anyway, i would call for zero but i doubt that occurs right away, probably get some diehard delusional cultists buying down there stopping it from going right away, maybe bounces around a bit afterward but the destination ultimately is zero.
Bitcoins next stop, $93-96k?I think we will go lower to test the area below on the daily chart where the quarterly anchored vwap and 200ma are both hanging out together. I will be watching for direction at this level based on price action when we get there. Not financial advice.

$BTC Heading to the Long-Awaited 200DMA Retest ~$96kFULFILL THY PROPHECY 📖
CRYPTOCAP:BTC making its way down to the long-awaited 200DMA retest, which just so happens to show confluence with the .618 Fib level at $96k.
RSI shows a bit more room to the downside as well.
Make sure to get those bids in!

BUY BTCUSDBitcoin (BTC/USD) is showing signs of a strong bullish reversal off a major demand zone at $98,000.**
If price holds above this level and confirms with continued bullish candles, the likely trajectory is toward the resistance zone around $110,000–$111,200.
The forecast structure suggests a clean trend recovery pattern. However, manage risk tightly — as a breakdown below the demand zone could flip the narrative to bearish.

People say Bitcoin is a safe haven… but these past few days are With everything going on between the U.S. and Iran, I thought BTC would hold up — maybe even rally. But nope.
It's dropping. Hard.
While gold and the dollar are climbing, Bitcoin is acting more like a risk asset than a safe one.
And honestly, that says a lot.
I’m not saying Bitcoin has no value — I actually like it. But when there’s real fear, real war, the big players dump it.
Seems like they still don’t trust it as “digital gold.”
Now... what really catches my attention is that BTC is dropping before other assets.
And maybe that’s a signal.
Maybe Bitcoin isn’t a safe haven yet…
But it might be an early warning that the market is getting ready for something bigger.
Just putting it out there. Watching closely.
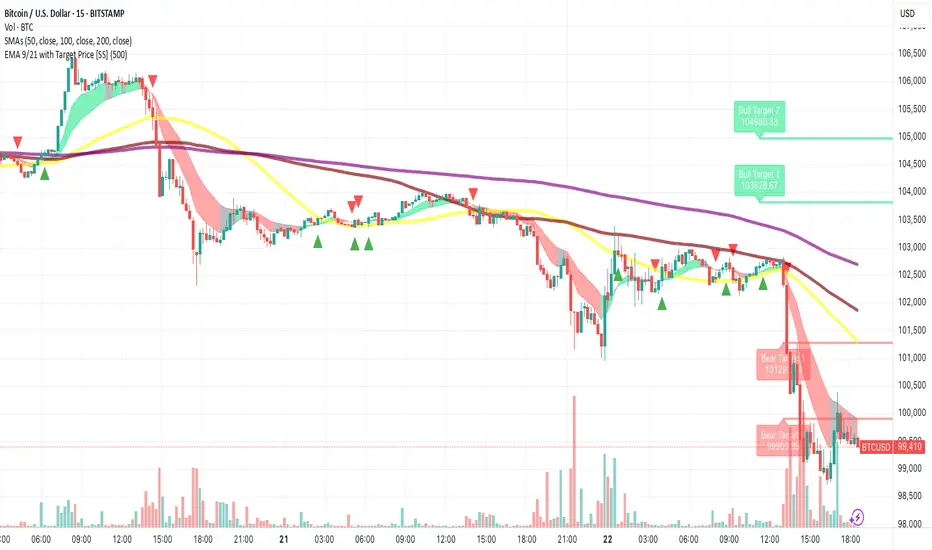
Bitcoin Daily Update June 22nd 2025Bitcoin daily chart:
🔻 Bearish Signals
1. Break of Rising Trendline:
The price has broken below the upward (orange) trendline, indicating a shift in momentum.
This trendline had previously acted as support, so the break suggests growing selling pressure.
2. Support Levels:
BTC is now hovering just above $99,634, which appears to be a key short-term support.
The next major support is around $93,363 — a break below that could open the door to mid $80K or even $71K (0.786 Fibonacci level).
3. Market Cipher Indicator (middle panel):
The momentum wave is clearly descending, and VWAP (green) is curving down.
The money flow (red) is negative.
Bearish dots and crosses are appearing.
4. Stochastic RSI (bottom panel):
Both %K and %D lines are dropping sharply below the 20 line, suggesting downside momentum is strong.
No sign of bottoming out yet.
🟡 Neutral/Bullish Watch Points
If BTC holds $99.6K and reclaims $100,115 or $104,616, it could neutralize or reverse this bearish setup.
RSI is not oversold yet, so room remains for further downside before any strong bounce.
📉 Summary:
BTC is currently bearish on the daily chart with:
Breakdown from an uptrend.
Weak momentum.
Declining oscillators.
Support tests underway.
If $99.6K fails, eyes shift to $93.3K, and below that, $86.5K–$71.9K as potential zones.
....
🔻 Primary Trade Setup (Bearish)
⚙️ Type: Short Position
⏰ Timeframe: Daily
📉 Strategy: Trendline break and momentum continuation
Entry:
Below $99,500 (confirmation of trendline breakdown & continuation)
Targets:
1. Target 1: $93,363 — Previous support level
2. Target 2: $86,500 — Next horizontal support
3. Target 3: $71,949 — Major 0.786 Fibonacci level (high confluence)
Stop-Loss:
Above $100,600 (to avoid fakeout wicks)
Or tighter: $100,150 (for smaller R:R)
Risk-to-Reward (R:R):
Entry: ~$99,500
SL: ~$100,600 → ~1.1% risk
TP1: ~$93,300 → ~6.2% reward
R:R ≈ 5.6:1 (to TP1) — solid risk profile
🔄 Alternate Plan (Bullish Reversal Setup)
⚙️ Type: Long Position (Only IF price reclaims broken levels)
If BTC reclaims $100,600 and closes above $104,616, trend could resume up.
Entry:
Break and daily close above $104,616
Targets:
1. $110,616 — recent resistance
2. $112,000 — psychological + historical zone
Stop-Loss:
Below $100,600
Invalidates upward breakout
📊 Indicators to Watch:
VWAP: Still pointing down (bearish bias)
Money Flow Index: Still in red (risk-off)
Stochastic RSI: Resetting near bottom — could support bounce later
Much love and appreciation,
– chevs710

BTC eyes on $97.8k: Last stop before 85.3k Golden Genesis retestShown here is a single fib series in three different time-frames.
The "Genesis Sequence" has called every major turn since 2015.
Clear reactions at each fib confirms our faith in the "Golden Ratio"
Topped at the 111.66k fib, and orbitted the 105k fib for a bit.
Now approaching a critical fib at 97.8k that bulls must fight for.
If it does not hold then we look to the Golden Genesis at 85.3k
$ 97,769.44 is the exact location of next fib.
$ 85,354.35 is the exact location of the Golden fib.
Golden Genesis fibs deserve the respect of a retest.
===================================================================
Previous calls of the Genesis Sequence include these amazingly PRECISE turns:
$111k Top call:
$105k recent Top call:
$73k previous Cylce top:
Hit the FOLLOW and BOOST to encourage more such PRECISE charts.
===========================================================
.

BITCOIN | Bullish DivergenceBITCOIN has been in bearish trend so far but it has now formed bullish divergence which may initiate a new bullish trend.

BTC USD ENTRY point 100000 target 101000 Stop Loss 99200 You're sharing a trade setup for BTCUSD:
- *Entry Point*: $100,000
- *Target*: $101,000
- *Stop Loss*: $99,200
Potential profit: $1,000
Potential loss: $800
Risk-reward ratio looks decent. What's driving your bullish outlook on Bitcoin? Technical analysis, market sentiment, or fundamental news?

Weekly review of SPY, QQQ, GC, CL, ETH, BTCWeekly review of SPY, QQQ, GC, CL, ETH, BTC for the week 6/23 - 27


Bitcoin Short: Wave CAfter a 6-days move up after we have hit our target in the previous analysis, I think Bitcoin has completed what I think to be the Wave B and is already on the Wave C run down.
Over in this video, I expressed my personal viewpoint that Bitcoin is not a hedge against the dollar and that it is actually a risk-on/off product more similar to the equities markets like the S&P500. I recommend that anyone who is interested to perform a study on the correlation and beta Bitcoin.
I suggested that the reason why it more closely related to the equity markets is due to it's deep integration within the financial sector (e.g. ETFs, structured products from banks).
Given that I think that the equity markets are primed to crash soon, I think that Bitcoin will follow suit.
Good luck!

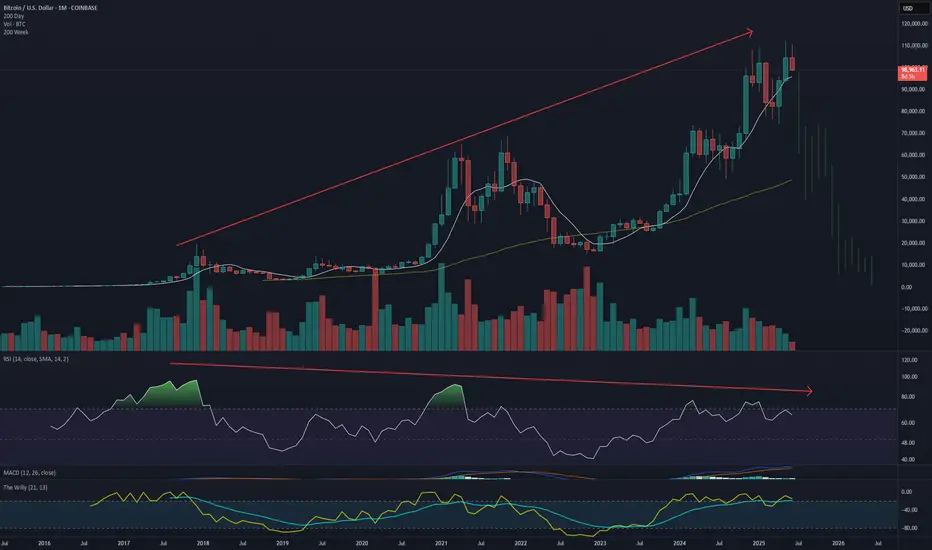
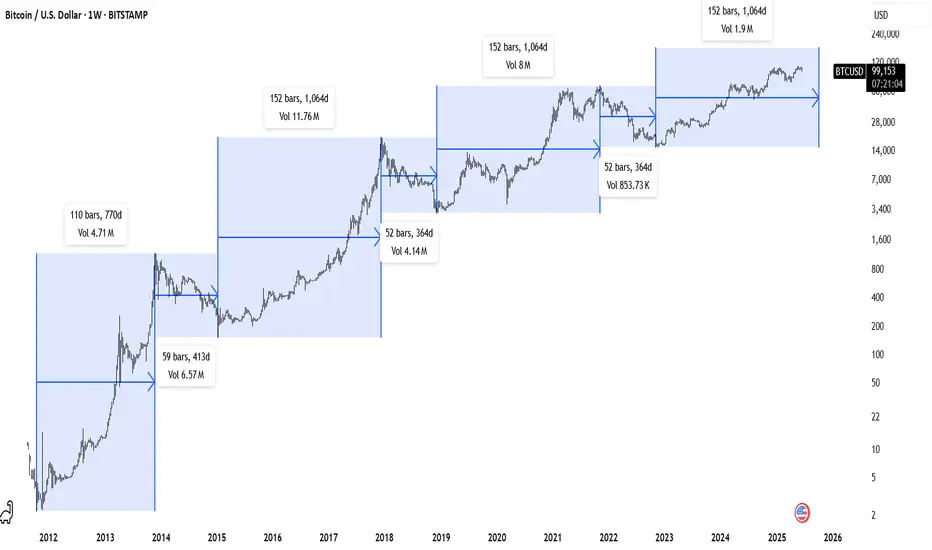
BTC Weekly - Time PatternsBitcoin Weekly Chart
52 Wk & 152 Wk Patterns // Diminishing returns
For my own personal logs.

Last time to buy bitcoin under 100K?Things are looking bleak, but isn’t that the time to buy? Institutions and governments are buying. Are you selling you’re to them?

BITCOIN is under 100kWeekly double top in June(correction month) with a bearish divergence. BTC is now under 100k using the scare of WW3 as the catalyst…this is a major psych level!

BTC weekly sellon large timeframe BTC going to area between 70k and 6ok because we are now in correction period.

Bitcoin Trend Alert⚠️ Double Top Formation Spotted on #BTC
Bitcoin made an all-time high of 💰 $111,969 on 22nd May 2025
Second peak formed on 9th June at 💸 $110,656
🧠 Classic sign of a double top reversal pattern in play!
🧱 Support Levels Tested Multiple Times:
🔹 12 May — Touched major support: $100,694
🔹 5 June — Retest at same level: $100,694
🔹 21 June — Yet another test, this time lower: $100,322
⚠️ 22 June — Support finally broken! 💥
BTC breached the psychological barrier of $100,000 🚨
😟 Ethereum joins the breakdown — both CRYPTOCAP:BTC and CRYPTOCAP:ETH have now broken their month-long range supports!
⛔️ Time to stay Cautious.
📉 The bulls may be exhausted. Eyes on the next support zones and volume activity.
🧩 Stay alert. Watch for retests and fakeouts. Don’t FOMO. Let price confirm!

BTC / USDT - Short Set-UpEvening friends,
Looks like a probable idea, since we're just printing a lower low.
I shorted it already, lets see it play out.
Trade thirsty, my friends!

BTC / USDT - Look Closely!!!Good evening fellas,
Take a very close look and buy bitcoin.
Trade thirsty, my friends.

BTC/USD - The Bitcoin Cycle TopBTC has recently broken below a key uptrend line that had been guiding price for some time. I’m watching for a potential backtest of that broken trendline, a rather classic move that could set the stage for a final upwards squeeze, possibly printing a quick higher high to trap late longs.
I’m watching the circled area closely as a potential exhaustion zone. Key levels and price action around the trendline will be critical, breaking of upwards trendlines after backtesting may mark the beginning of the larger unwind.
We could see multiple backtests of the broken trendline over time, with the trendline now likely acting as resistance.
Note: I’m publishing this idea simply to have a timestamped record. This post is my way of putting a clear marker in the sand. I’m not looking to debate or go deeper into the reasoning, and I generally won’t be responding to comments.

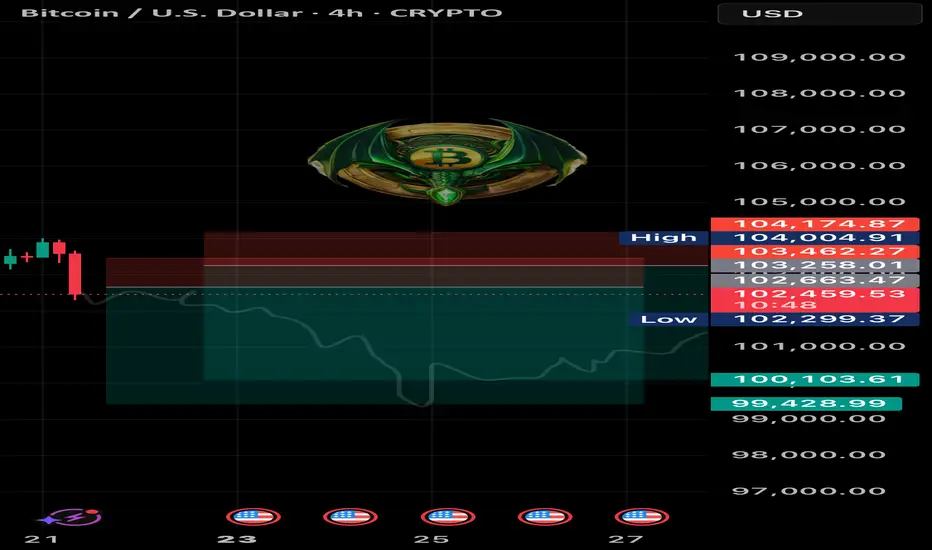
BTC SHORT TP:-100,000 21-06-2025What if this is the one that nukes it all? 😮💨
I’m entering a short between 102,500 and 103,600, aiming for a target around 99,500 – 100,200, with an average RR of 4.
This is based on the 4H timeframe, and should play out in the next 48 to 60 hours.
The structure still favors bearish continuation. If BTC breaks through the 100k level, we might be staring at a black swan scenario.
Manage your stop according to your risk plan and stay tuned for updates.
We don’t use indicators, we’re not out here drawing lines or cute little shapes — I just give you a clean trade.
If the move doesn’t happen within the estimated time, the trade is invalid.