BTC / USDT - Short Set-UpEvening friends,
Looks like a probable idea, since we're just printing a lower low.
I shorted it already, lets see it play out.
Trade thirsty, my friends!
BTCUSD.PI trade ideas

BTC / USDT - Look Closely!!!Good evening fellas,
Take a very close look and buy bitcoin.
Trade thirsty, my friends.

BTC/USD - The Bitcoin Cycle TopBTC has recently broken below a key uptrend line that had been guiding price for some time. I’m watching for a potential backtest of that broken trendline, a rather classic move that could set the stage for a final upwards squeeze, possibly printing a quick higher high to trap late longs.
I’m watching the circled area closely as a potential exhaustion zone. Key levels and price action around the trendline will be critical, breaking of upwards trendlines after backtesting may mark the beginning of the larger unwind.
We could see multiple backtests of the broken trendline over time, with the trendline now likely acting as resistance.
Note: I’m publishing this idea simply to have a timestamped record. This post is my way of putting a clear marker in the sand. I’m not looking to debate or go deeper into the reasoning, and I generally won’t be responding to comments.

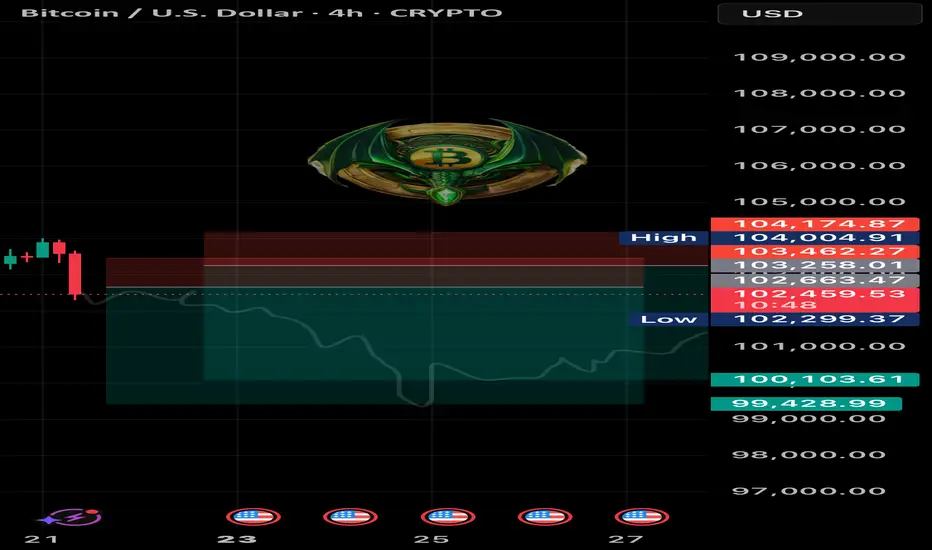
BTC SHORT TP:-100,000 21-06-2025What if this is the one that nukes it all? 😮💨
I’m entering a short between 102,500 and 103,600, aiming for a target around 99,500 – 100,200, with an average RR of 4.
This is based on the 4H timeframe, and should play out in the next 48 to 60 hours.
The structure still favors bearish continuation. If BTC breaks through the 100k level, we might be staring at a black swan scenario.
Manage your stop according to your risk plan and stay tuned for updates.
We don’t use indicators, we’re not out here drawing lines or cute little shapes — I just give you a clean trade.
If the move doesn’t happen within the estimated time, the trade is invalid.
#Btc Breakdown Begins: Double Top + Iran-Israel Tensions = CrBitcoin has clearly formed a double top pattern and is currently hanging near the critical 100K support. If this level breaks, we may first see a fall to 90K, followed by a deeper decline toward 73.5K. If that too fails to hold, the market could slide drastically to 64K–45K zones. The pattern indicates Bitcoin is exiting the distribution phase, with profit booking at aggressive levels.
The Iran-Israel conflict, intensified by U.S. involvement, has triggered panic and short positions across the market. This is a high-risk environment, and long entries could be dangerous right now. Caution is advised — we are entering a potentially sharp correction phase.

BTCBTC will be moving sideways and a drop for the next few days.
Disclosure: We are part of Trade Nation's Influencer program and receive a monthly fee for using their TradingView charts in our analysis.

BTC/USD BUY 22/06/2025🇺🇸 This trade setup offers a strong buying opportunity, supported by several technical confluences. We observe a retest of the lower boundary of a descending range within a broader bullish trend, reinforced by a bullish RSI divergence and the presence of a key support zone. The strategy is to wait for a potential retest of the range low before entering a long position around the \$100,000 to \$101,000 area, with a stop loss set at \$98,000 to manage risk. The target (TP) is set at \$110,000, aiming for a risk-to-reward ratio (RR) greater than 3, which makes this setup highly attractive in terms of risk management.
From a fundamental perspective, this bullish bias is further supported by growing institutional interest and an uncertain macroeconomic environment, marked by inflation and geopolitical tensions. These factors continue to drive demand for alternative assets like Bitcoin as a store of value.

Wyckoff Structure Targets 92K–94K Retest Before Continuation!A rare and highly instructive market structure is currently unfolding, presenting a textbook case of Wyckoff pattern integration across multiple timeframes.
Over the past weeks, I’ve been tracking a series of smaller Wyckoff accumulation and distribution patterns nested within a larger overarching Wyckoff structure. Each of these smaller formations has now successfully completed its expected move — validating the precision of supply/demand mechanics and the theory’s predictive strength.
With these mini-cycles resolved, the spotlight now shifts to the final, dominant Wyckoff structure — a larger accumulation phase that encompasses the full breadth of recent market activity. According to the logic of Phase C transitioning into Phase D, price appears poised to revisit the key retest zone between 92,000 and 94,000, a critical area of prior resistance turned demand.
📉 Current Market Behavior:
📐 Multiple minor Wyckoff patterns (accumulations/distributions) have played out as expected, both upward and downward — lending high credibility to the current macro setup.
🧩 All formations are nested within a major accumulation structure, now in the final phase of testing support.
🔁 The expected move is a pullback toward the 92K–94K zone, before the markup phase resumes with higher conviction.
📊 Wyckoff Confidence Factors:
✅ All Phase C spring and upthrust actions respected
✅ Volume behavior aligns with Wyckoff principles (climactic action → absorption → trend continuation)
✅ Clean reaccumulation signs within current structure
✅ Institutional footprint visible through shakeouts and well-defined support/resistance rotations
💬 Observation / Call to Action:
This setup is a rare opportunity to witness multi-layered Wyckoff theory in motion, offering not only a high-probability trading setup but also an educational blueprint. I invite fellow traders and Wyckoff analysts to share their interpretations or challenge the current thesis.
➡️ Do you see the same structural roadmap?
Let’s discuss in the comments.

You've Already Lost: The Bitcoin Delusion of FOMO and False HopeLet’s get one thing straight: if you’re staring at Bitcoin, squinting past the red flags, and convincing yourself it’s not a Ponzi scheme because of that one shiny feature that screams “legit,” you’re not investing—you’re auditioning for the role of “next victim.” And if your motivation is the fear of missing out (FOMO) or the fantasy of getting rich quick, well... congratulations. You’ve already lost.
The 99%: Red Flags Waving Like It’s a Parade
Let’s talk about the indicators—the ones that make Bitcoin look suspiciously like a Ponzi scheme. No, it’s not technically one, but the resemblance is uncanny:
- No intrinsic value: Bitcoin isn’t backed by assets, cash flow, or a government. It’s worth what the next person is willing to pay. That’s not investing. That’s speculative hot potato.
- Early adopters profit from new entrants: The people who got in early? They’re cashing out while newcomers buy in at inflated prices. That’s the classic Ponzi dynamic: old money out, new money in.
- Hype over utility: Bitcoin’s actual use as a currency is minimal. It’s slow, expensive to transact, and volatile. But hey, who needs functionality when you’ve got memes and moon emojis?
- Opaque influencers: From anonymous creators (hello, Satoshi) to crypto bros promising Lambos, the ecosystem thrives on charisma, not accountability.
- Scam magnet: Bitcoin has been the currency of choice for over 1,700 Ponzi schemes and scams, according to a University of New Mexico study cs.unm.edu . That’s not a coincidence. That’s a pattern.
The 1%: The “But It’s Decentralized!” Defense
Ah yes, the one redeeming quality that Bitcoin evangelists cling to like a life raft: decentralization. No central authority! No government control! It’s the financial revolution!
Except… decentralization doesn’t magically make something a good investment. It just means no one’s in charge when things go wrong. And when the market crashes (again), you can’t call customer service. You can tweet into the void, though.
FOMO: The Real Engine Behind the Madness
Let’s be honest. Most people aren’t buying Bitcoin because they believe in the tech. They’re buying because they saw someone on TikTok turn $500 into a Tesla. FOMO is the fuel, and social media is the match.
Bitcoin’s meteoric rises are often driven by hype cycles, not fundamentals. Tesla buys in? Price spikes. El Salvador adopts it? Price spikes. Your cousin’s dog walker says it’s going to $1 million? Price spikes. Then it crashes. Rinse, repeat.
This isn’t investing. It’s gambling with a tech-savvy twist.
The Punchline: You’ve Already Lost
If you’re ignoring the overwhelming signs of speculative mania and clinging to the one feature that makes you feel better about your decision, you’re not ahead of the curve—you’re the mark. And if your motivation is “I don’t want to miss out,” you already have. You’ve missed out on rational thinking, due diligence, and the ability to distinguish between innovation and illusion.
Bitcoin might not be a Ponzi scheme in the legal sense. But if it walks like one, talks like one, and makes early adopters rich at the expense of latecomers… maybe it’s time to stop pretending it’s something else.
INDEX:BTCUSD NYSE:CRCL NASDAQ:HOOD TVC:DXY NASDAQ:MSTR TVC:SILVER TVC:GOLD NASDAQ:TSLA NASDAQ:COIN NASDAQ:MARA

BTCUSD: The Market Is Looking Down! Short!
My dear friends,
Today we will analyse BTCUSD together☺️
The recent price action suggests a shift in mid-term momentum. A break below the current local range around 102,641.61 will confirm the new direction downwards with the target being the next key level of 102,364.09.and a reconvened placement of a stop-loss beyond the range.
❤️Sending you lots of Love and Hugs❤️

#202525 - priceactiontds - weekly update - bitcoinGood Day and I hope you are well.
comment: Full bear mode. Bulls still trying to make bears doubt it and we are not moving fast enough but we are also not making higher highs. We are close to my validation level for the bears, which is a daily close below 100k. I do think any print above 104k would invalidate my thesis. Targets for bears today/tomorrow are 98k and if we have enough momentum we see 90k.
We are still seeing bigger tails above daily bars which means bulls are trying but since are printing lower lows for two weeks, they are failing. Bears now need to move strongly below 100k and then we can start the acceleration down.
current market cycle: trading range until follow-through below 100k
key levels: 100k - 111k
bull case: Bulls are still hopeful, that’s why we are still above 110k but the next touch could break it and I doubt many will hold long or scale into new ones there. Best bulls can get right now is to go sideways for longer and stay above 100k. I mean… Staying above 100k is as bullish as it get’s if you be honest.
Invalidation is a daily close below 100k - next support below 100k is 98k and then comes 93k
bear case: Bears need to print below 100k and close below. That’s the whole story. Next targets below are then 98k and 93k, breakout-re-test prices. Until they achieve that, it’s slightly higher probability that we move sideways but this market won’t be able to hold above 100k if big indexes sell-off.
Invalidation is above 107k
short term: Bearish but could wait for confirmation below 100k. I doubt we get above 107k again and continue inside the range
medium-long term - Update from 2025-06-22: Daily close below 100k is confirmation. First target below 100k is 97k the breakout retest and after that is the 50% retracement around 93k. I have no bullish for the next weeks/months. Once the gap to 97k closes we are likely in a bear trend again and I expect to hit at least 85k over the summer.

Sell Setup BTCUSDCurrently, BTC/USD is approaching a key supply zone between $107,800 – $108,600, where price previously faced strong rejection. My expectation is that price will react similarly upon retest.
🧠 Trade Idea:
I'm anticipating a fakeout or liquidity grab above the zone, followed by a lower high formation.
Once this confirmation occurs, I’ll be looking for a short entry, targeting the major demand zone below, around $100,800 – $101,600.
✅ Confluences:
Previous price rejection from this same resistance zone.
Clean bearish imbalance below that still needs filling.
Lower timeframes showing signs of exhaustion as we approach resistance.
🕵️♂️ Entry Trigger:
I’ll wait for bearish price action within or just above the yellow resistance zone (e.g. bearish engulfing, lower high, or break of structure).
📉 Target:
TP Zone: $101,000 area
SL: Just above the fakeout zone to manage risk effectively.

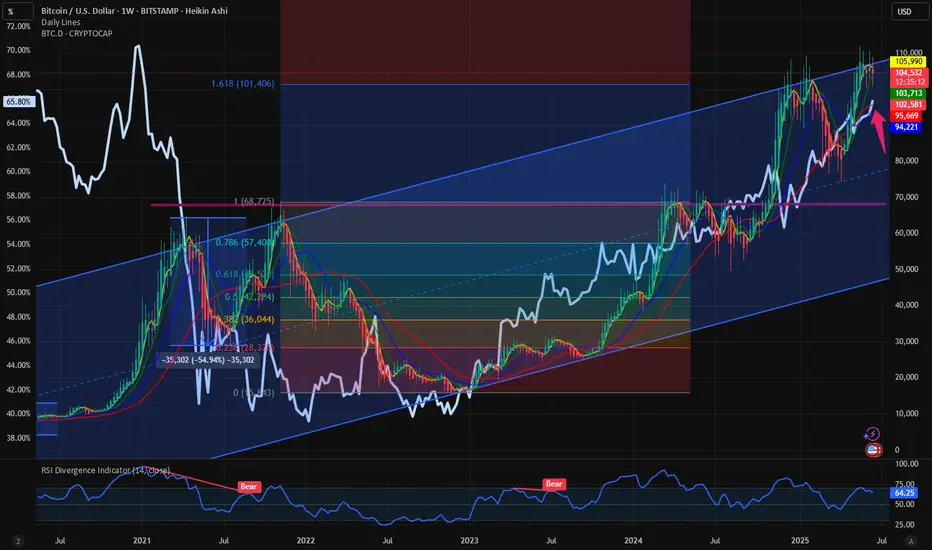
$BTC weathering the storm: $BTC.D close to 66%. $BTC to 160K. With all the volatility in the capital markets, Crypto is not immune to such swings. IN this space we have time and again analyzed the charts and have indicated that the best bet in the Crypto is to stay with CRYPTOCAP:BTC in these turbulent times. Even if CRYPTOCAP:BTC is above its previous cycle highs, this cannot be said about many altcoins like CRYPTOCAP:ETH , CRYPTOCAP:SOL , CRYPTOCAP:DOGE , CRYPTOCAP:LINK etc. A few days ago, on 15th June I wrote about the sloppy participation of CRYPTOCAP:TOTAL2 in case of an expanding $USM2.
CRYPTOCAP:TOTAL2 and ECONOMICS:USM2 : Correlation never broken. What now? for CRYPTOCAP:TOTAL2 by RabishankarBiswal — TradingView
Even if the ECONOMICS:USM2 is at an ATH CRYPTOCAP:TOTAL2 is still below its previous cycle highs. We asked the question what will CRYPTOCAP:BTC do if ECONOMICS:USM2 expands by 1-2T $. Even during the war and turbulent times CRYPTOCAP:BTC chart looks bullish as ever. It is still above its previous cycle highs; it is holding on to the psychological level of 100K $.
Now comes I think the most important chart in the crypto space is $BTC.D. The Dominance is currently above 65.5 %. Exactly here on 14th April we forecasted that CRYPTOCAP:BTC.D will go to 66%.
CRYPTOCAP:BTC.D to 66%, CRYPTOCAP:TOTAL2 / BTC down to 0.43 for CRYPTOCAP:BTC.D by RabishankarBiswal — TradingView
And again on May 20 I said the recent weakness in CRYPTOCAP:BTC.D is temporary and it will eventually reach 66%.
CRYPTOCAP:BTC.D : Have we seen the top or a local top in the CRYPTOCAP:BTC.D ? for CRYPTOCAP:BTC.D by RabishankarBiswal — TradingView
So where do we stand today. We are closer to 66% than to making a new local low. At 65.7% the path of least resistance is towards upside. And the USD valuation of CRYPTOCAP:BTC faces some resistance to breaking out of the upward sloping parallel channel which we have been following for the last few months. Currently the resistance level is 107K $ and we got rejected there.
Verdict : CRYPTOCAP:BTC.D goes to 66%. CRYPTOCAP:BTC consolidates here and 160K as Cycle top target.

Bullish Hidden Divergence on the DayOn the Day chart at this time, we see BTC making a Higher High compared to it's RSI, if I am not mistaken that is Bullish Hidden Divergence. Will Bulls be able to push prices back to the 107,000 price region? The Bears still have price under the 50 EMA on the daily. We need to see how price reacts to the wedge shape structure in purple.

BTC had break down the 4H trend line Time for long term shortTrend line had been broken down not only once but more than 1 time shows a strong bearish bias momentum with strong volume
Which confirmed by retest the resistance twice and failed to break it out and the pressure still on the downward momentum after several attempts to push higher and successfully pushed down-so set your short positions SL above 105,600 to avoid any wicks attempts
Entry 102,600. / 102,800
SL. 103,600
TP1 @. 101,220
TP2 @ 100,250
TP3 @ 99,550
Runners to hold if you wish 98,500
Wish for all best of luck and well managed Trade setup , enjoy the trend movment

BTC/USD Testing Channel Support – Bullish Rebound in Sight?Bitcoin is currently testing the lower boundary of the descending channel around the 101,844 support level. A strong bounce from this level suggests a potential bullish correction in the short term.
As long as the price holds above this key support, a move towards the next resistance levels at 103,449 and 104,411 remains likely. However, a clear break below 101,844 would invalidate the bullish outlook and resume the downward trend.
This setup offers a tactical opportunity for intraday traders to monitor price behavior around current levels.

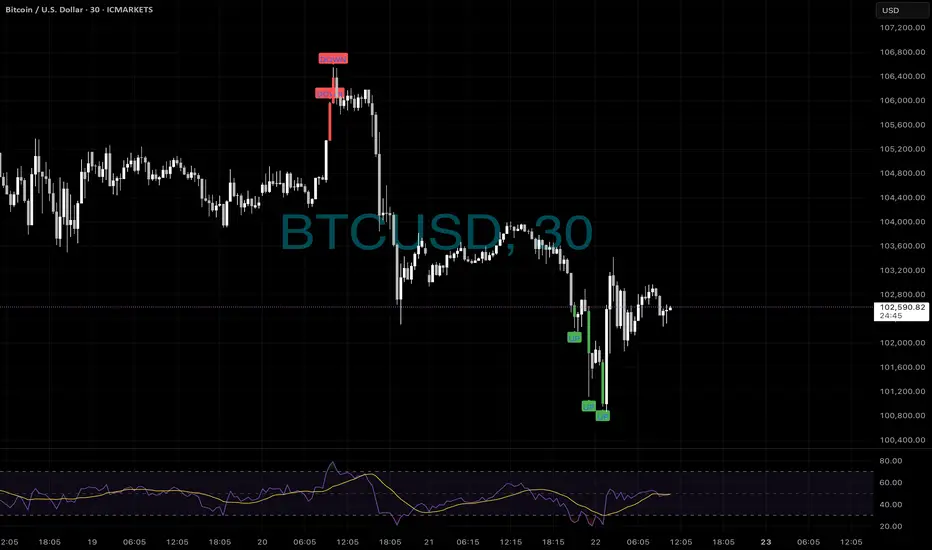
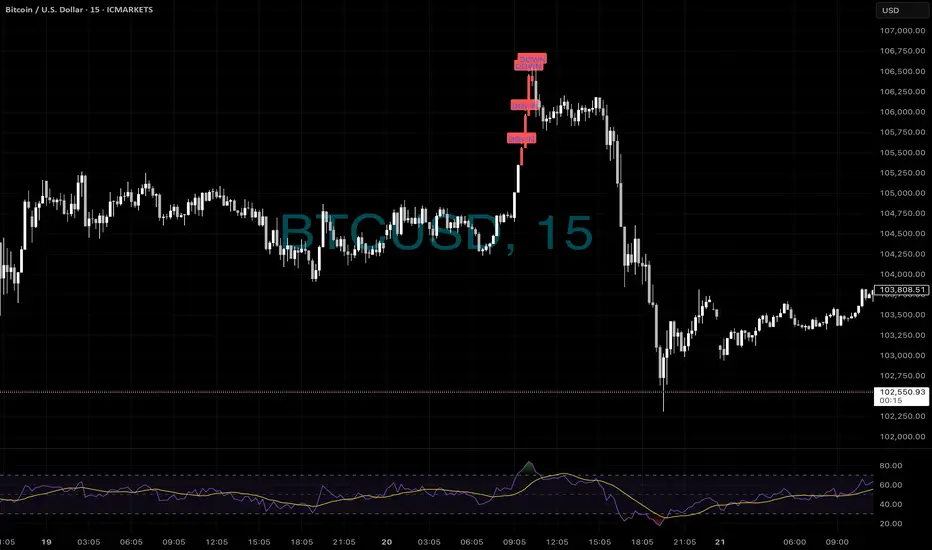
More BTC trades📊 BTCUSD 30m – Top AND Bottom Nailed with ELFIEDT
🔻 First, our system warned of a major top with double DOWN signals — just before the market dumped over 3,000 points.
🔼 Then, as panic set in, multiple UP signals printed near the low — before a clean reversal kicked in.
💡 This is the power of structured, data-backed reversals.
When price disconnects from value, and RSI confirms, our indicator steps in with laser precision.
🚫 No guessing.
🚫 No hype.
✅ Just consistently mapped turning points — visible in real-time.
🧠 If you’re still sitting on the sidelines or relying on lagging tools, it’s time to upgrade.
📲 Message us to get access and learn how to catch the turns, not chase the trends.
⸻
#BTCUSD #Bitcoin #CryptoReversals #ELFIEDT #RSIReversion #BTCSignals #CryptoTrading #BTC #TechnicalTrading #SmartEntries #TopAndBottom #NoLagJustEdge #ReversionStrategy #XReversion #BTC30min #CryptoEdge #TradingViewStrategies
My analysis on BTCUSD I'm expecting a push to the up side from this zone marked on my chart. Please make your own research and if you're entering use a proper risk management

BTC - Also works💥 BITCOIN 15m – Top Sniped by ELFIEDT Reversion
This wasn’t luck. This was precision.
Just before Bitcoin tanked over $2,000…
🔻 Our indicator printed multiple “DOWN” signals right at the top.
🔁 RSI divergence confirmed fading strength — and the reversal was brutal.
📉 If you caught this with us, you already know:
When price is overstretched and RSI signals weakness, we strike.
No hype. No chasing. Just high-probability trades, marked in real time.
🧠 You could still be buying tops and hoping…
Or you could be trading with structure, confluence, and edge.
📲 DM us to get access to the full ELFIEDT system and start dominating crypto and indices alike.
⸻
#BTCUSD #BitcoinTrading #CryptoSignals #RSIDivergence #ReversionTrade #ELFIEDT #SmartTrading #TradingEdge #PriceAction #TopReversal #TradingViewIndicators #PrecisionTrading #BearishMomentum #XReversion #CryptoTraders #BTCShort
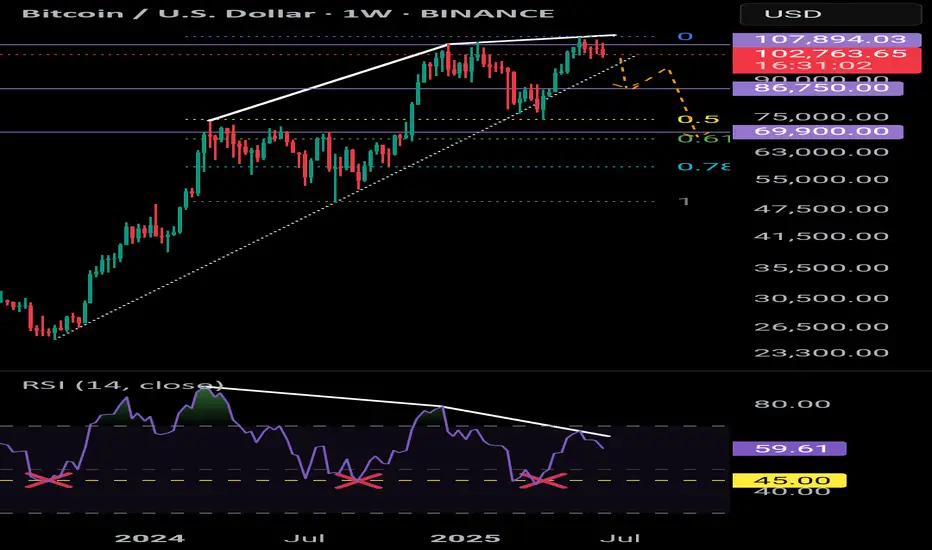
BTC - Macro RSI analysisHello 👋
Weekly TF
Bearish divergence currently playing out.
Observing the uptrend (dotted white line) we did see a brief break below this trendline in April. Another break could result in a correction to 67.5K - 69.9K price range which is the 618 fib and an area where price found resistance on multiple occassions.
Bitcoin has found support on the Weekly RSI @ 45 (yellow dashed line). I think if we lose this level we would see BTC moving into oversold territory.
The daily RSI was also recently "overbought".
BTC daily level observation New perspectivesOn the daily chart, MACD shows divergence.
In the yellow box, there is a possible head and shoulders top structure
Pay attention to whether there is a large real black candlestick at the daily level that breaks through the lower boundary of the box.
Let's wait patiently

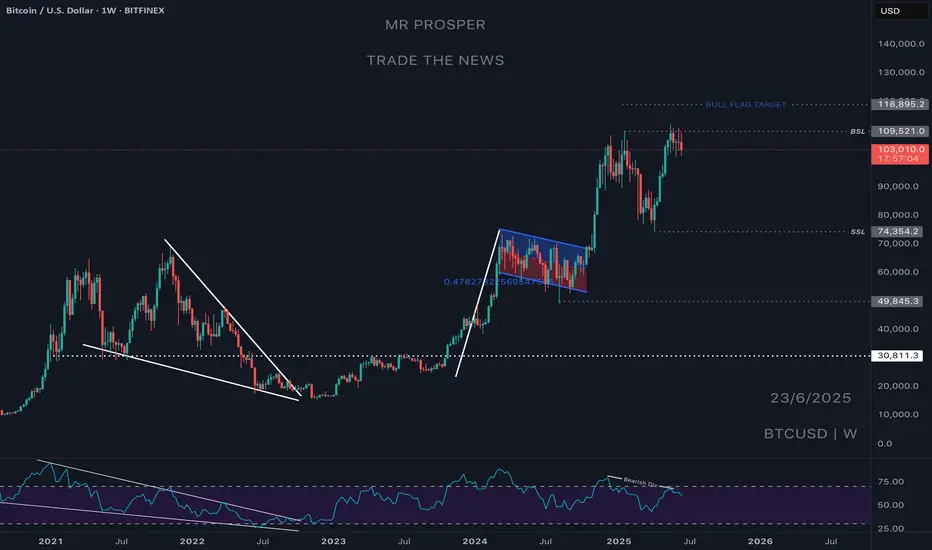
Bull Run Over, See you in 3 years Bitcoin Just took our previous resistance, and it's failing to displace or close above it; instead, it's rejecting and closing below it.
This to me signals a move to SSL and even lower prices for Bitcoin; I will be interested in Bitcoin around the year 2028.
Good bye crypto for now; I'm looking to stack up some funds until 2028 to buy cheap bitcoin around sub-40K levels.