BTC on the Daily: Bearish Structure Locked In?So, on the daily, price is in a clear bearish context.
PSAR is bearish
MLR < SMA < BB center
We're about to close below the 50MA
Price already broke below the Higher Lows trendline and the December 2024 top
At this point, it all depends on the macro situation and the FOMC tone tonight.
If the outcome is positive, there's a chance price rebounds.
If not, the chart looks ready to dive.
BTCUSD.PI trade ideas

BTCUSD like to reach level 107375BTC USD is in a reversal zone and likely to reach level 107375.00
This is for educational purpose only. Not an investment or financial advise.

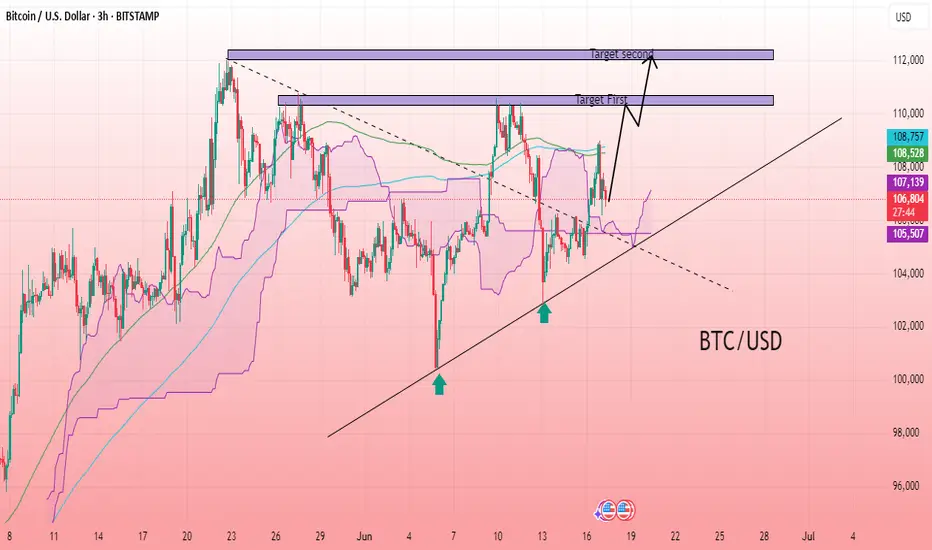
BTC/USD 3H CHART PATTERNThe BTC/USD 3-hour chart shows a bullish reversal forming from a higher low structure along a rising trendline, indicating increasing buyer strength. Price action has broken above the Ichimoku cloud and is now testing resistance levels, suggesting bullish momentum. The chart also highlights confluence with dynamic support from the 250 and 370-period DEMA indicators, adding to the strength of the uptrend. A breakout above current resistance may lead to continuation toward the marked target zones. Overall sentiment favors a bullish move with clear upside potential if momentum sustains and no major rejection occurs from the resistance zones.
Entry Point: 106,600
First Target: 110,360
Second Target: 112,000
BTC/USD H1 CHART ANNALSIS 18/6/2025
Trading Setup and Strategy Explanation:
Buy at:1042.000
Resistance at:103700
Important Note:
Resistance should be above the current price, not below. If 105,700 is below 106,800, it typically indicates support, not resistance.
**Corrected Interpretation:**
Here's how your setup likely looks:
- Buy Entry:** 104.200
Support (not resistance) 103700
Target 1:108.000
Target 2: 110.000
Level Type:
- 105,700 Support (Stop-loss zone)
- 104.200 Entry
- 10.7000Target 1
Trade Notes:
- If BTC holds above 104200, your long position is technically supported.
- A break below 105,700 might invalidate the bullish setup — consider a stop-loss below that.
- Momentum toward 110K–112K is possible if the market breaks out of short-term consolidation or reacts positively to macro news.
**Strategy Preference:**
Would you like a chart or confirmation based on technical indicators (RSI, trendlines, volume, etc.)?

The Bitcoin Manipulation Trick - How They Lure You Into the Trap📉 Bitcoin spends more time in deep drawdowns than at its peaks. Historically, BTC has spent over 80% of its existence trading 80-90% below its all-time highs, yet people keep falling for the illusion of wealth.
🧐 Here’s how the cycle works:
1️⃣ They drive up the price to make it enticing for new buyers.
2️⃣ You FOMO in at the highs, believing in the "next big wave."
3️⃣ Then they crash it, wiping out weak holders.
4️⃣ They keep it suppressed for years, forcing everyone out, via margin calls, financial strain, or sheer exhaustion.
5️⃣ When enough have capitulated, they restart the cycle.
📊 Historical Evidence:
- 2013 Crash: Over 400 days down 80%+ before recovery.
- 2017 Crash: Nearly 3 years below 80% of ATH.
- 2021 Drop: More than a year stuck 75% below peak.
🔎 If you’re buying now, be ready to:
⛔ Lose access to your money
⛔ Keep covering margins
⛔ Wait years for recovery, if it ever happens …
They play the same trick, every time. If you don’t recognize it, you’re just another part of the cycle. 🚀🔥
INDEX:BTCUSD NASDAQ:MARA NASDAQ:COIN NASDAQ:TSLA TVC:GOLD TVC:SILVER NASDAQ:MSTR TVC:DXY NASDAQ:HOOD NYSE:CRCL

Bitcoin And The 50 MABitcoin continues to consolidate in a tight range just below the $112,000 resistance, with the price currently hovering around $104,600. The chart shows clear horizontal support at $105,787 and dynamic support from the 50-day moving average – which has once again provided a modest bounce after being tested multiple times this month.
So far, the structure remains healthy but indecisive. BTC is printing a series of higher lows since the March bottom, but the repeated rejection near $112,000 raises the possibility of a developing lower high – a potential early signal of waning bullish momentum if follow-through selling emerges. Volume is declining slightly, suggesting a wait-and-see mode as the market anticipates macro events like the Fed meeting.
Overall, until Bitcoin breaks above $112K with conviction or loses $105K and the 50 MA, this chop is likely to continue. Bulls want to see a clean breakout and strong candle close above resistance, while bears are watching for a break back below $100,718 to open up downside potential toward $92,817.

June 17 Bitcoin Bybit chart analysisHello
This is Bitcoin Guide.
It's been a while.
I took a break recently because the participation rate was not good.
Since it's been a while since I did an analysis, I did it in a short form,
I hope you enjoy it.
If you "follow"
You can receive real-time movement paths and comment notifications on major sections.
If my analysis was helpful,
Please click the booster button at the bottom.
Here is the Bitcoin 30-minute chart.
I created a strategy based on the possibility of sideways movement in Nasdaq and the rebound of Tether Dominance.
* When the blue finger moves,
It is a two-way neutral short->long switching strategy.
1. $106,792.2 short position entry point / stop loss price when orange resistance line is broken
2. $105,082.8 long position switching / stop loss price when green support line is broken
3. $107,579.9 long position 1st target -> Top 2nd target price
If it goes down from the current position,
Check the bottom section -> up to $103,194.3.
Please use my analysis as a reference only
I hope you operate safely with principle trading and stop loss price.
Thank you.

Bitcoin - Trend Shift Confirmed, Eyes on $102.8K LiquidityMarket Context
Bitcoin showed signs of exhaustion after a strong short-term rally within a clean upward channel on the 1H chart. Price action had been respecting the trend structure until a key deviation occurred near $108,500, where we saw an internal liquidity sweep that hinted at potential distribution.
Fake-Out Confirmation and Shift in Momentum
After taking out local highs around $108.5K, price failed to continue higher and instead reversed sharply, confirming the sweep as a classic fake-out. This kind of internal liquidity grab is typically used to trap breakout buyers before reversing and targeting previous lows.
Break of Structure and Channel Retest
The rising channel was broken convincingly, and price has now retested the underside of the channel, aligning with the 50% equilibrium of the entire high-to-low range. This reinforces the bearish bias and suggests the market has likely shifted from accumulation to distribution.
Downside Targets and Key Levels
Immediate support sits around $104.6K, which served as a consolidation base during the earlier run-up. If this level fails to hold, the next key target would be a sweep of the previous significant low at $102.8K. This area is marked as a point of interest and could offer a reaction or reversal.
Price Expectations and Trade Outlook
As long as price remains below the broken channel and under $107K, the bearish scenario remains in play. I’m watching for bearish continuation into $104.6K first, and a potential full sweep toward $102.8K if that support fails.
Conclusion
The internal sweep followed by impulsive rejection, combined with a clear channel breakdown and retest, shifts the bias to bearish. A move into the $104.6K region seems probable, with a lower liquidity target at $102.8K in sight if downside pressure accelerates.
Disclosure: I am part of Trade Nation's Influencer program and receive a monthly fee for using their TradingView charts in my analysis.
___________________________________
Thanks for your support!
If you found this idea helpful or learned something new, drop a like 👍 and leave a comment, I’d love to hear your thoughts! 🚀

BTCUSD Analysis UpdateBTC/USD Analysis Update 📈
Bitcoin has rebounded successfully after touching the 103500 support level and is currently trading around 105500. However, the ongoing correction may continue to test the psychological support at the 100000 round number in the short term ⚠️.
Key Points:
Support Bounce 🎯: BTC found buying interest at 103500, in line with our previous strategic analysis.
Immediate Resistance 📉: The current rebound faces direct resistance near 106000 (200-hour moving average).
Downside Risk 📉: Failure to hold above 105000 could trigger another decline toward 100000.
Risk Management:
Long positions should set stop-loss below 103000 ⛔️.
Short entries may consider the 106000–107000 range, targeting 102500 and 100000
⚡️⚡️⚡️ BTCUSD ⚡️⚡️⚡️
🚀 Buy@ 102500 - 103500
🚀 TP 106000 - 106500
🚀 Sell@ 106000 - 106500
🚀 TP 103500 - 101500
Accurate signals are updated every day 📈 If you encounter any problems during trading, these signals can serve as your reliable guide 🧭 Feel free to refer to them! I sincerely hope they'll be of great help to you 🌟 👇

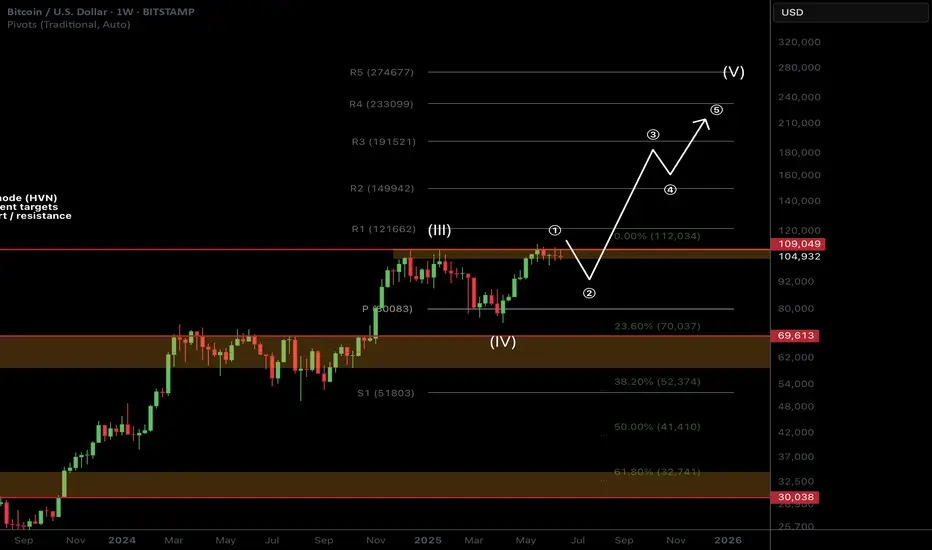
BTC Macro Analysis☕ 𝙂𝙈. CRYPTOCAP:BTC macro analysis update...
📈 𝙇𝙤𝙣𝙜 𝙩𝙚𝙧𝙢 outlook remains unchanged and recent price action is barely a blip on the weekly chart. SD+2 target is still $211k as a blow off top.
📉 𝙎𝙝𝙤𝙧𝙩 𝙩𝙚𝙧𝙢 outlook has investors looking lower towards the $92K target but this isn't guaranteed to be reached and price action may front those who wait.
War escalation's and retail selling are keeping price suppressed as price changes hands to private companies and large wallets.
The time for patience continues. Money is made in the sitting, weathering volatility, not flipping in and out of trades on every bit of news and price movement
𝙏𝙚𝙘𝙝𝙣𝙞𝙘𝙖𝙡 𝘼𝙣𝙖𝙡𝙮𝙨𝙞𝙨
Price is consolidating under all time high resistance. Consolidation under resistance has high probability of breaking out, the longer it remains the higher the probability.
Elliot Wave (EW) analysis suggests a motif wave ended with the poke above all time high (per the EW rules), with a wave 2 retracement underway. Price remains above the daily pivot (bullish) but below the DEMA (bearish). A triangle could still be forming but this is not my preferred EW count.
Safe trading
Bitcoin minor downtrend?B t c seems to be looking and a larger downttrend on a minor level.
Feed replacement fifty per cent around 93/94k..
100k down to wave 3 impulsive wave..4 and 5 up to 104k then last leg down two 93k?

Current BTC Trend Analysis and Trading RecommendationsThe daily candlestick chart of BTC shows a three - day consecutive bearish retracement, having fallen back to the vicinity of the starting point of the previous pinbar rebound and currently remaining in a recent low - level sideways consolidation zone. However, the 4 - hour trend is pressured by the middle band of the Bollinger Bands, staying within a downward channel and forming a rebound - retracement wave pattern.
For short - term strategies, anticipate a further retracement first. Long positions should be initiated only after the support level is confirmed valid. This retracement represents a necessary consolidation phase before the bullish trend continues, and the current adjustment range does not pose a substantial threat of trend reversal to the overall uptrend. With the core upward trend intact and the direction remaining clear, BTC is expected to resume its upward momentum after a brief consolidation. The operational approach remains to go long on retracements.
BTCUSD
buy@103500-104000
tp:105500-106500
Investment itself is not the source of risk; it is only when investment behavior escapes rational control that risks lie in wait. In the trading process, always bear in mind that restraining impulsiveness is the primary criterion for success. I share trading signals daily, and all signals have been accurate without error for a full month. Regardless of your past profits or losses, with my assistance, you have the hope to achieve a breakthrough in your investment.

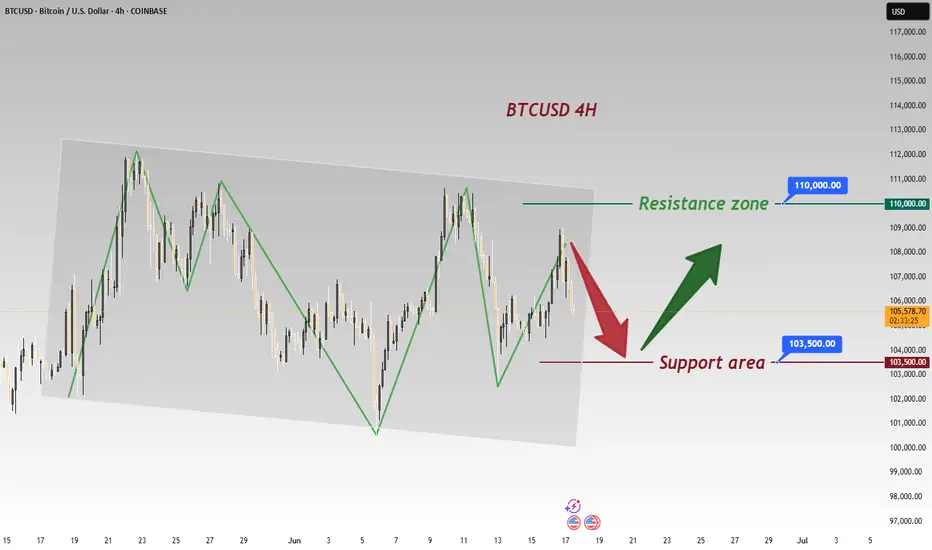
BTC/USD Potential Bullish ReversalBTC/USD Potential Bullish Reversal 🟢📈
🔍 Technical Overview:
The chart shows a potential bullish reversal pattern forming near a key support zone. Price action has consistently bounced from the support range between $100,000 – $103,700, marked by multiple higher lows (🟠 orange circles), suggesting strong buyer interest.
📌 Key Levels:
Support Zone: $100,000 – $103,700 🛡️
Immediate Resistance: $110,384 🔼
Current Price: $105,202 💰
📊 Pattern Observed:
The price structure shows a possible inverted head and shoulders pattern forming, with the right shoulder currently developing. If this structure completes and breaks the $106,000–$107,000 neckline region, we can expect a bullish breakout toward the resistance target of $110,384 or higher.
📈 Bullish Confirmation:
Bullish rejection from support area ✅
Clean structure with repeated higher lows 📈
Potential breakout arrow suggests move toward the top resistance zone
⚠️ Watch For:
Price must hold above $103,700 to maintain bullish bias
Break below this level may invalidate bullish setup and retest the broader support zone near $100,000
📌 Conclusion:
BTC/USD is setting up for a potential upside breakout if the neckline is broken. Traders should monitor for bullish confirmation before entering long positions.
🔔 Strategy Suggestion:
Buy Zone: $103,700 – $104,500 (on bullish confirmation) 🛒
Target Zone: $110,000 – $111,000 🎯
Stop-Loss: Below $103,000 🛑


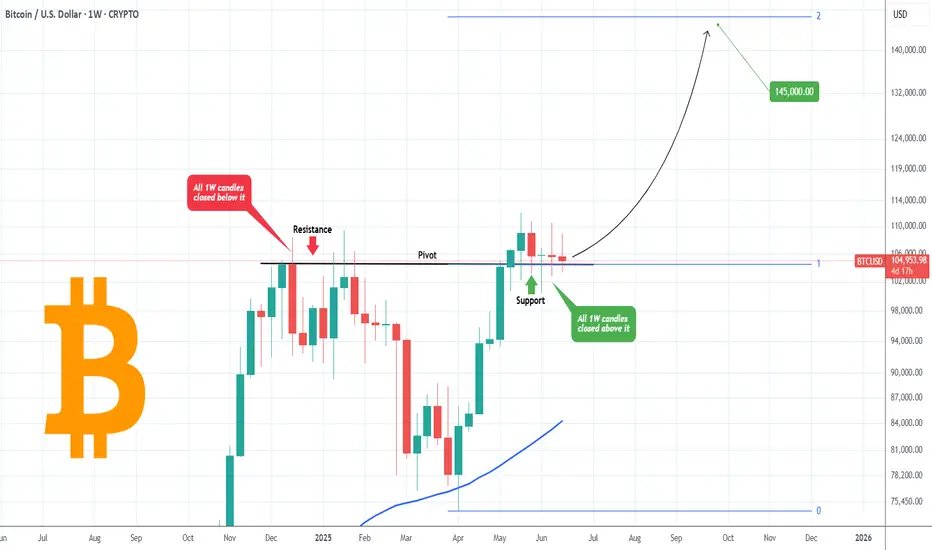
BITCOIN The secret trend-line that no one notices..Bitcoin (BTCUSD) was under heavy selling pressure yesterday and even the 1D time-frame turned marginally bearish. What most seem to ignore however is the larger picture. On the 1W time-frame, BTC has managed to close the last 5 weeks above the Pivot trend-line.
What that trend-line is? It is the level that initially started as a Resistance from December 09 2024 to January 27 2025, closing all 1W candles below it, despite occasional candle wicks breaking above it. That confirmed it's status as a Resistance at the time.
Now we see the opposite, five straight 1W candles closing above that Pivot line. Check in particular, how flat the last two 1W candles closed, showcasing no just the high volatility that the market is under in the past weeks, but also the same amount of sellers and buyers existing in the market (neutral).
This is an indication that this is a consolidation phase, preparing BTC for the next rally. If we place the top Fibonacci level (1.0) on that Pivot, we get the 2.0 Fib extension just above the $145000 mark. That gels perfectly with various other studies we've conducted showing a similar long-term Target.
So do you think the Pivot line will hold and push Bitcoin to $145k? Feel free to let us know in the comments section below!
-------------------------------------------------------------------------------
** Please LIKE 👍, FOLLOW ✅, SHARE 🙌 and COMMENT ✍ if you enjoy this idea! Also share your ideas and charts in the comments section below! This is best way to keep it relevant, support us, keep the content here free and allow the idea to reach as many people as possible. **
-------------------------------------------------------------------------------
💸💸💸💸💸💸
👇 👇 👇 👇 👇 👇
BITCOIN OUTLOOK FOR TODAYThose two zones are my possible buy entries for bitcoin today
Let's see how it plays out

Bitcoin - Trend Shift Confirmed, Eyes on $102.8K LiquidityMarket Context
Bitcoin showed signs of exhaustion after a strong short-term rally within a clean upward channel on the 1H chart. Price action had been respecting the trend structure until a key deviation occurred near $108,500, where we saw an internal liquidity sweep that hinted at potential distribution.
Fake-Out Confirmation and Shift in Momentum
After taking out local highs around $108.5K, price failed to continue higher and instead reversed sharply, confirming the sweep as a classic fake-out. This kind of internal liquidity grab is typically used to trap breakout buyers before reversing and targeting previous lows.
Break of Structure and Channel Retest
The rising channel was broken convincingly, and price has now retested the underside of the channel, aligning with the 50% equilibrium of the entire high-to-low range. This reinforces the bearish bias and suggests the market has likely shifted from accumulation to distribution.
Downside Targets and Key Levels
Immediate support sits around $104.6K, which served as a consolidation base during the earlier run-up. If this level fails to hold, the next key target would be a sweep of the previous significant low at $102.8K. This area is marked as a point of interest and could offer a reaction or reversal.
Price Expectations and Trade Outlook
As long as price remains below the broken channel and under $107K, the bearish scenario remains in play. I’m watching for bearish continuation into $104.6K first, and a potential full sweep toward $102.8K if that support fails.
Conclusion
The internal sweep followed by impulsive rejection, combined with a clear channel breakdown and retest, shifts the bias to bearish. A move into the $104.6K region seems probable, with a lower liquidity target at $102.8K in sight if downside pressure accelerates.
Disclosure: I am part of Trade Nation's Influencer program and receive a monthly fee for using their TradingView charts in my analysis.
___________________________________
Thanks for your support!
If you found this idea helpful or learned something new, drop a like 👍 and leave a comment, I’d love to hear your thoughts! 🚀

Bitcoin Bounced from a High-Volume Area at the 103,363 Support.FenzoFx—Bitcoin dipped to $105,175, creating a bearish fair value gap that highlights selling pressure. Immediate support is at $103,463, backed by high volume, while resistance stands at $107,792. If support holds, BTC/USD could rise toward $112,000.
A drop below $102,185 may accelerate the downtrend toward $93,363, the previous monthly low.

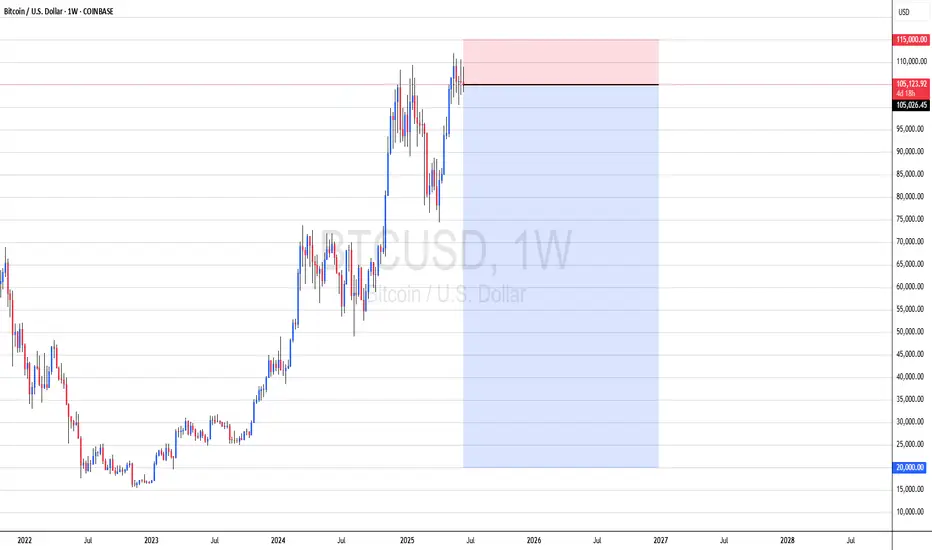
BTCUSDsell now
dump it to 20k
1% risk on this trade
i will send more sells all month to add on
game time
i seen enough
listen to me
BTCUSD Tests Support—Buy for ReboundBTCUSD opened high and trended lower today 📉, now approaching the support zone—time to buy directly and ride the rebound! 🚀
⚡️⚡️⚡️ BTCUSD ⚡️⚡️⚡️
🚀 Buy@ 105000 - 105500
🚀 TP 106000 - 107500
Accurate signals are updated every day 📈 If you encounter any problems during trading, these signals can serve as your reliable guide 🧭 Feel free to refer to them! I sincerely hope they'll be of great help to you 🌟 👇
BTCUSD UP Trend buy strong from key support 🚀 #BTCUSD Update (4H Time Frame)
Bitcoin is maintaining a strong bullish trend, bouncing confidently from the key support zone at $105,000. Momentum is building as buyers step in aggressively.
📈 Technical Targets:
🎯 1st Target: $110,000
🎯 2nd Target (Major Resistance): $111,900
Price action is showing strength — watch for consolidation or a breakout near resistance.
👇 Like, Follow & Drop a Comment 💬
Join us for more real-time updates, analysis & signals!
— Livia 😜
#Crypto #Bitcoin #BTC #Trading

Bearish reversal?The Bitcoin (BTC/USD) is rising towards the pivot which is a pullback support and could reverse to the 1st support which is also a pullback support.
Pivot: 106,391.59
1st Support: 103,654.27
1st Resistance: 108,761.68
Risk Warning:
Trading Forex and CFDs carries a high level of risk to your capital and you should only trade with money you can afford to lose. Trading Forex and CFDs may not be suitable for all investors, so please ensure that you fully understand the risks involved and seek independent advice if necessary.
Disclaimer:
The above opinions given constitute general market commentary, and do not constitute the opinion or advice of IC Markets or any form of personal or investment advice.
Any opinions, news, research, analyses, prices, other information, or links to third-party sites contained on this website are provided on an "as-is" basis, are intended only to be informative, is not an advice nor a recommendation, nor research, or a record of our trading prices, or an offer of, or solicitation for a transaction in any financial instrument and thus should not be treated as such. The information provided does not involve any specific investment objectives, financial situation and needs of any specific person who may receive it. Please be aware, that past performance is not a reliable indicator of future performance and/or results. Past Performance or Forward-looking scenarios based upon the reasonable beliefs of the third-party provider are not a guarantee of future performance. Actual results may differ materially from those anticipated in forward-looking or past performance statements. IC Markets makes no representation or warranty and assumes no liability as to the accuracy or completeness of the information provided, nor any loss arising from any investment based on a recommendation, forecast or any information supplied by any third-party.

BTC Daily & 4H Technical Analysis- Daily Chart :Three consecutive bearish candles retrace to the prior rebound starting point, now consolidating near lows with shrinking volumes—indicating the correction hasn't reversed the uptrend.
-
- 4H Perspective :Pressured by the Bollinger Bands midline within a descending channel, RSI in oversold territory and weakening MACD bearish momentum suggest a potential rebound.
-
- Trading Strategy :Go long after confirming support at 103,000-104,000 USD, targeting 106,000-107,000 USD. Maintain a dip-buying approach as the primary trend remains bullish.
BTCUSD
buy@103500-104500
tp:106000-107000
I am committed to sharing trading signals every day. Among them, real-time signals will be flexibly pushed according to market dynamics. All the signals sent out last week accurately matched the market trends, helping numerous traders achieve substantial profits. Regardless of your previous investment performance, I believe that with the support of my professional strategies and timely signals, I will surely be able to assist you in breaking through investment bottlenecks and achieving new breakthroughs in the trading field.
