BTCUSD: $150,000 on a repetitive pattern.Bitcoin is neutral on its 1D technical outlook (RSI = 54.823, MACD = 486.400, ADX = 23.402) possibly going through the last consolidation before the next breakout to a new ATH. The whole 2023-2025 Bull Cycle has been on a repetitive pattern, bottoming on the HL Zone and peaking on the HH trendline, while forming clear wave structures. According to this, the next HH should be around 150,000 (TP).
## If you like our free content follow our profile to get more daily ideas. ##
## Comments and likes are greatly appreciated. ##
BTCUSD.PI trade ideas

Bitcoin is bullish again!Bitcoin’s been on a wild ride lately!
After crashing down from its all-time highs earlier this year, it’s suddenly bounced back and shot up again over the last few weeks. Here’s what’s really going on, in plain English:
First off, a lot of this has to do with what’s happening in the broader economy and politics. The US dollar has gotten weaker recently, especially after Trump started criticizing the Federal Reserve and pushing for interest rate cuts.
When the dollar drops or there’s drama around central banks, people start looking for alternatives, and BITSTAMP:BTCUSD is like the go-to “digital gold” for a lot of investors these days.
There’s also been a ton of money flowing into Bitcoin ETFs (those are investment funds that directly hold Bitcoin), especially from big institutions like BlackRock and Fidelity. These huge inflows mean more demand, but since there’s only so much Bitcoin out there, the price gets pushed up even more.
Another big reason is the recent Bitcoin “halving,” which happened about a year ago. Basically, every four years, the reward for mining new Bitcoin gets cut in half, so fewer new coins are created. This makes Bitcoin even scarcer , and historically, prices have always jumped in the months after a halving event. As we said in previous ideas BTC could be near USD 200k this summer.
On top of that, there’s been some good news about trade relations between the US and China, which has made investors more optimistic and willing to take risks again. When people feel better about the global economy, they’re more likely to put money into things like crypto.
Technical confirmations
Bouncing in the previous 2024 highs is really good for Bitcoin, people was ready to buy a lot of BTC in the right price and after that a lot of inflows moved the price over the blue trendline meaning that this small downtrend is over.
Bitcoin is volatile, so this kind of movements are ideal to make money or invest in a discount. If the price moves below the support line, then I recommend to stay away of BTC because there could be a free fall...
So, to sum it up: weaker dollar, big institutional buying, post-halving scarcity, better vibes around global trade, and people running from stock market chaos—all of that has pushed Bitcoin back up after its recent dip. Who knows how long it’ll last, but right now, crypto’s hot again!

BTC/USD Today: Momentum Builds Toward the Next BreakoutBITSTAMP:BTCUSD Today: Momentum Builds Toward the Next Breakout
Previously on BTC...
1. Double Top Pattern and Target Hit
The chart shows a classic double top (early 2025), a bearish reversal pattern. Once the neckline broke, the price plunged and nailed the technical target (red arrow)—as if Bitcoin had read the textbook.
2. Trendline Break = Game Changer
After bottoming out, BTC broke through a downward sloping trendline, triggering a strong bullish move. This breakout signaled a trend reversal, and the market responded accordingly.
3. Perfect Pullback
Once the breakout played out, the price retraced back to previous resistance, now turned support. This “perfect pullback” is the kind of thing that makes technical analysts smile in their sleep.
4. Bull Trend Confirmation
The successful retest of support confirmed that Bitcoin had shifted from neutral/bearish into a full-on bull trend. Buyers stepped back in with confidence.
📊 BTC/USD – Current Outlook
Bull Flag Forming
Currently, price action is consolidating into a bull flag, a continuation pattern often seen mid-rally. If it breaks out to the upside, the projected target sits near $120,000 .
🚀 Bullish Catalysts:
- Strong structural trend: Higher highs and higher lows are still intact.
- Post-halving momentum: Historically, Bitcoin tends to go beast mode 6–12 months after each halving—and we’re right in that sweet spot.
- ETF inflows : Institutional capital continues pouring into Bitcoin ETFs, adding steady buying pressure.
- Supply crunch: With more BTC leaving exchanges, sell-side liquidity is drying up. Hodlers are hodling.
- Technical setup: A confirmed breakout from the bull flag could trigger a powerful leg higher.
⚠️ Risks and Levels to Watch:
A breakdown of the bull flag could send BTC back toward the $98k–91k range.
Macro headwinds (rate hikes, economic slowdown, dollar strength) could still rain on crypto’s parade.
🧠 Conclusion
This chart paints a textbook bullish setup for Bitcoin. The double top is in the rearview mirror, the trendline breakout gave us the green light, and now the bull flag is loading the next move.
If the breakout happens, the next destination could be $120,000.
It’s one of those “don’t blink” moments—BTC might just be stretching before its next sprint.

Bitcoin: Curve AdjustmentsBottoms can be expressed as a curve which matches logarithmic growth patterns. In the long-term perspective it serves as signal of trend's transition phase in broader scale. Coordinate of top adjusted accordingly.
Extending them is crucial because together they gives boundaries of range compression. Some sort of wave limits which help to clarify price-based levels.

This is a deception or maybe a technique !!!I think this head and shoulders pattern is trying to deceive us and is fake. I expect the price to drop to the support line and then rise to $109k. WAIT FOR IT....
Give me some energy !!
The Crypto Market Game: How to Win Against Fear and Manipulation
Did you really think profiting from the current bull run (a comprehensive upward market) would be easy? Don't be naive. Do you think they’ll let you buy low, hold, and sell high without any struggle? If it were that simple, everyone would be rich. But the truth is: 90% of you will lose. Why? Because the crypto market is not designed for everyone to win.
They will shake you. They will make you doubt everything. They will create panic, causing you to sell at the worst possible moment. Do you know what happens next? The best players in this game buy when there’s fear, not sell—because your panic gives them cheap assets.
This is how the game works: strong hands feed off weak hands. They exaggerate every dip, every correction, every sell-off. They make it look like the end of the world so you abandon everything. And when the market rises again, you’re left sitting there asking, “What just happened?”
This is not an accident. It’s a system. The market rewards patience and punishes weak emotions. The big players already know your thoughts. They know exactly when and how to stir fear, forcing you to give up. When you panic, they profit. They don’t just play the market—they play you. That’s why most people never succeed: they fall into the same traps over and over again.
People don’t realize that dips, FUD (fear, uncertainty, doubt), and panic are all part of the plan. But the winners? They block out the noise. They know that fear is temporary, but smart decisions last forever.
We’ve seen this play out hundreds of times. They pump the market after you sell. They take your assets, hold them, and sell them back to you at the top—leaving you with nothing, wondering how it happened.
Don’t play their game. Play your own.

111.65 against 105KMorning folks,
So we've got great entry with our H&S but it is early to relax. To avoid long explanations - BTC has to stay above 105K lows to keep current tendency valid. So, if you still plan to buy BTC here - you do not need to watch for too deep standing Fib levels.
If BTC will still drop below 105K, we could get extended downside action to 100K and maybe even deeper.
Nearest upside target with our current plan is 111.65K.

BTC breakdown before the run up to 115-116kSo from what I see here is that well come down to around 100-98k, then reverse up to 116662k at 1 fib level. Let me know your thought guys 👍


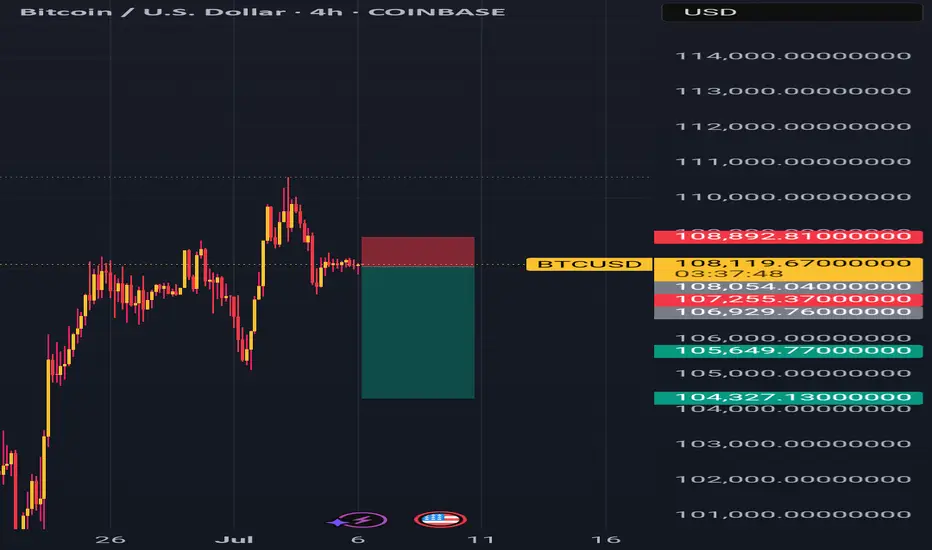
BTC Slumps Below 100000, Rebounds to Test 109500 Short Zone💎 BTC Rebounds After 100000 Drop, Eyes Short at 109500 Resistance 📊
BTC dipped below the 100000 threshold 🔻 before rebounding near 98000 🔺—a move tied to DXY weakness and easing geopolitical tensions. Now challenging the 110000 mark 🔼, it faces stiff resistance at 109500. First-time 110000 tests often spark pullbacks, making shorts the favored play here 📉.
🚀 Sell@108500 - 107500
🚀 TP 106500 - 105500
Accurate signals are updated every day 📈 If you encounter any problems during trading, these signals can serve as your reliable guide 🧭 Feel free to refer to them! I sincerely hope they'll be of great help to you 🌟 👇

Wait for something more reliableMorning folks,
Since our last update action was anemic. Nothing has changed seriously. BTC was able to show just minor upside action. Based on current performance, I do not want to take long position right here and prefer to wait for something more reliable. Because BTC action stands rather different from the one that we expected to see.
For example it might be H&S pattern on 1H chart. Thus, an area around 103K seems the one that we will keep an eye on.

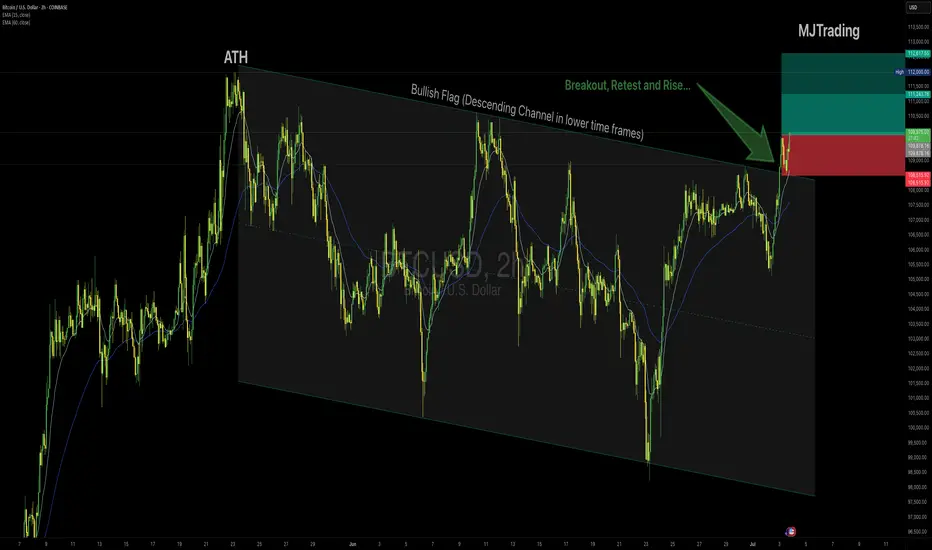
BTCUSD – Long Setup (2H Chart)👆👆🚀🚀Boost it if you like it (Thanks)🚀🚀👆👆
Idea:
Bitcoin is breaking out above the descending Flag after testing the upper boundary multiple times, showing bullish momentum confirmed by price holding above the 15 EMA and 50 EMA. The breakout aligns with strong impulse candles and sustained buying pressure.
Entry:
✅ Buy near $110,000
Stop Loss:
🔴 Below $108,500, under the breakout structure to protect against a false breakout.
Take Profit:
🟢 Tp1 $111,245
🟢 Tp2 $112,600
Rationale:
Clear breakout of the channel top resistance.
Bullish EMAs crossover with sustained slope.
Strong impulse move suggesting continuation.
Risk Management:
Position size accordingly, max risk 1–2% capital per trade.
#Bitcoin #BTCUSD #CryptoTrading #Breakout #LongSignal #TradingView #TechnicalAnalysis

Wait for your EDGE...
Discipline is what separates professionals from amateurs.
Stay patient. Wait for your edge. Let the probabilities work in your favor.
👉 “Agree with this? Hit Boost to spread the message.”
#TradingPsychology #Discipline #BTC #Bitcoin #Forex
#TradingMindset #AlBrooks #TradingDiscipline #PriceAction #ForexTrading #CryptoTrading #StockMarket #MJTrading #TradingQuotes #TraderLife #MindOverMarkets

BUY BTCUSD now for a four hour time frame bullish trend continuBUY BTCUSD now for a four hour time frame bullish trend continuation ...............
STOP LOSS: 107,194
This buy trade setup is based on hidden bullish divergence trend continuation trading pattern ...
Always remember, the trend is your friend, so whenever you can get a signal that the trend will continue, then good for you to be part of it
TAKE PROFIT : take profit will be when the trend comes to an end, feel from to send me a direct DM if you have any question about take profit or anything...
Remember to risk only what you are comfortable with... trading with the trend, patient and good risk management is the key to success here


Bitcoin Is Looking For A Bullish ContinuationMorning all! Bitcoin has impulsive characteristics on 4h time frame, and we can clearly see five waves up that can send the price even higher after recent projected ABC correction. With the current impulsive recovery back above 106k area, it confirms that bulls are still here and we should be aware of further rally in July, especially if breaks above channel resistance line near 110k area. Seems like it's in wave (1) of a new five-wave bullish impulse, so after current wave (2) pullback, we can expect more gains within wave (3).

BTC flag with a pole to 140on a weekly BTC formed a flag, on Daily it's already bouncing off the flag treandline. the pole measured move is to 140. Just what my eye thinks it sees :)

BTCUSD-SELL strategy. Monthly chart It looks a clear negative divergence case, and we are quite overbought. This requires again to alleviate the pressure and I feel $ 74k re-test is possible medium-term.
Short-term anything goes they say, and it feels it will try higher short term. just be careful for the longer-term situation.
Strategy SELL @ $ 108k-115k and take profit first @ $ 77k area.

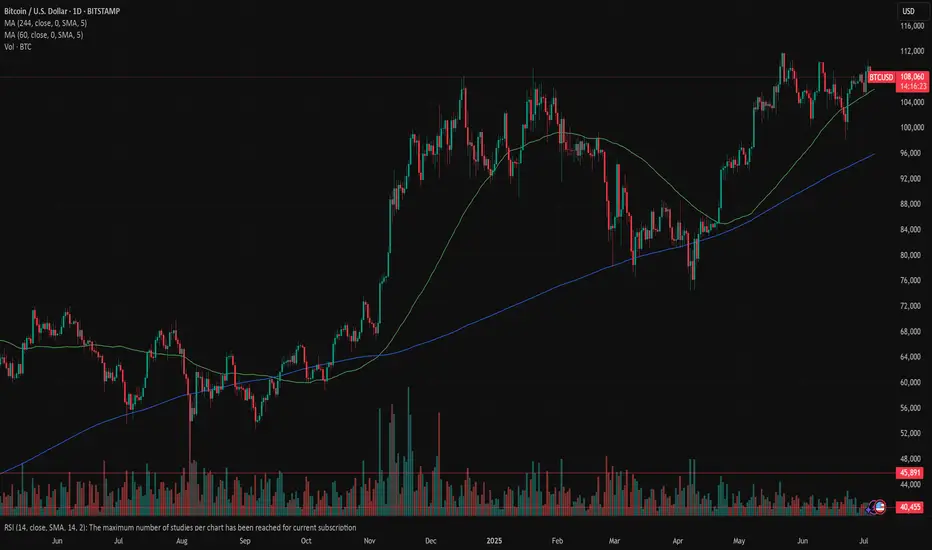
Bitcoin: higher for longer?The investors optimism supported by better than expected US jobs data was reflected mostly in the US equity market, but the crypto market was not left behind on this occasion. Although the week for crypto was quite volatile, it showed that investors are still strongly considering investments in crypto coins for diversification of portfolios, especially BTC. The BTC spent a week struggling around the level of $107K, while making its final breakthrough toward the upside, reaching the highest weekly level at $110K. It is ending the week around the level of $108K, with an equal level of buying and selling order during the weekend.
Although the price was pushed toward the $110K, the RSI did not reach the overbought market side. Actually, the indicator continued to move between levels of 50 and 60, indicating that the market is still not ready to finish the cycle and revert it toward the oversold market side. Although slowed down, the MA50 is still oriented toward the upside, same as MA200, without an indication that the cross might occur anytime soon.
Current charts are indicating the probability that the support line at $106K might be tested again in the coming period. This short reversal is necessary for BTC in order to collect enough interest for a further push toward the upside. Whether the BTC will have strength to try to reach old ATH, remains unclear from current charts, but some indication holds. However, there is some probability that the $110K might be tested for one more time.
BTC : Looking at the supplyPrice is stalling at the D @ 108,800 for some time now.
I think it is not because of a lack of demand. Just that there is no one selling. Owners prefer to keep the limited supply. Buyers are unwilling to chase after the few available at a higher price. We have a stalemate.
In 2022, to break this stalemate, price needs to drop, with sellers taking a profit and making supplies available. Then we will have buyers scrambling again to BUY.
Watch the OBV.
So, I should wait to BUY, but at the right price.
Good luck.

BTCUSDTDo you think Bitcoin is long or short? I think we are shorting it to the 104,500 range and I am in a short position myself🎯🎯
Bitcoin Approaches the $110,000 Level Once AgainDuring the latest trading session, Bitcoin gained over 3%, as renewed buying momentum entered the market. For now, the cryptocurrency appears to be approaching its historical highs once again, driven largely by the growing weakness of the U.S. dollar. This is reflected in the DXY index, which measures dollar strength and is now hovering around 96 points, consolidating a bearish trend not seen in years. As the dollar continues to weaken, BTC could benefit from the environment, maintaining consistent buy-side pressure in the short term.
Lateral Range Still Intact
Despite recent upward movements visible on the chart, it’s important to highlight that BTC has begun to consolidate within a defined short-term lateral range, marked by a ceiling at $110,000 and a floor near $100,000. While buying pressure has shown signs of resurgence, it remains insufficient to break out of the range, which continues to dominate in the short term. If price fails to break through these key levels, a wider consolidation channel could develop in the coming sessions.
Indicators:
MACD: The MACD histogram continues to hover near the neutral zero line, indicating a stable balance between buying and selling forces. If this behavior persists, neutrality could become more dominant in the short term.
ADX: A similar pattern is emerging on the ADX indicator, as the line remains below the neutral 20 level. This suggests that the average volatility of recent moves is steadily decreasing, and unless the ADX starts to climb, Bitcoin may struggle to sustain the current bullish momentum recently seen on the chart.
Key Levels to Watch:
$110,000 – Major Resistance: This level marks Bitcoin’s historical high. If buying pressure pushes price back to and above this level, it could signal the reignition of a strong bullish bias and set the stage for a resumption of the previous uptrend.
$106,000 – Mid-Range Support: The midpoint of the current consolidation range. It acts as nearby support and may serve as a barrier against short-term pullbacks.
$100,000 – Psychological Support Zone: This level aligns with recent multi-week lows. A return to this level could jeopardize the short-term bullish bias that has attempted to hold over recent sessions.
Written by Julian Pineda, CFA – Market Analyst

BTC/USD Bullish Reversal Breakout Pattern BTC/USD Bullish Reversal Breakout Pattern 🚀
Technical Analysis:
🔹 Trend Reversal: The chart shows a clear inverse head and shoulders pattern highlighted with orange circles — a strong bullish reversal signal after a downtrend.
🔹 Breakout Zone: The neckline resistance around 108,000 USD has turned into support (marked as “SU00QT” due to a typo, assumed to be “SUPPORT”). Price action is consolidating just above this zone.
🔹 Trendline Support: The upward blue trendline confirms bullish structure, with price forming higher lows. Recent price action is bouncing off this trendline, showing strength.
🔹 Bullish Confirmation: Green arrows indicate strong bullish rejections from key levels, aligning with breakout retests.
🔹 Target Projection: The measured move from the inverse head and shoulders pattern projects a target towards the 114,000 USD resistance zone 📦 highlighted above, suggesting a potential 5-6% upside move 📊.
Conclusion: As long as price holds above the 108,000 support zone and the ascending trendline, BTC/USD remains bullish with potential continuation towards 114,000 USD. A breakout above minor consolidation could trigger a strong bullish rally 💥.
🛑 Invalidation: A sustained break below 106,000 USD would invalidate the bullish structure and may lead to further downside.
