Long Setup Loading… (BTC)My key demand zone for potential long setup – confluence of Fibonacci 0.66/0.618 and liquidity grab expected.
This highlighted golden zone will be my key area to look for long entries. It's aligned with the 0.66–0.618 Fibonacci retracement from the previous impulse, and I expect potential liquidity sweep below recent lows before a strong bullish reaction.
BTCUSD.PI trade ideas

Btcusd techinical analysis.Btcusd.techinical analysis next move posibale at h1 time frame.not finchinical advice.

BTC with potential for $115,000/$120,000🔍 Market structure (Price Action)
📈 Trend:
The market previously formed higher highs (HH) and higher lows (HL) – a classic uptrend.
Then there was a correction and a lower high (LH) and lower low (LL) appeared – a potential change in the trend to a downtrend.
The last two lows are again HL (Higher Lows) – suggesting an attempt to return to the uptrend.
🔄 Key support and resistance levels
✅ Resistance (green horizontal lines):
117.469 – local resistance and potential breakout target from the current range.
115.802 – confirmed resistance from previous consolidations.
111.814 – strong local resistance (LH – Lower High formed there).
109.341 – current resistance, the price is currently testing it.
🛑 Support (red horizontal lines):
105.370 – local support, price reacted at this level in recent days.
102.650 – important support, level of previous HL.
100.095 – consolidation level before breaking out upwards.
98.213 – last LL – very important level in the context of defending the structure.
🧭 Structure of peaks and troughs
HH: Higher High – confirmed the previous uptrend.
LH: Lower High – first warning about changing the structure to down.
LL: Lower Low – confirmed a potential change to downside.
HL (x2): two more higher lows – suggest a possible return to growth.
📊 Stochastic RSI (at the bottom of the chart)
The oscillator is currently in the overbought zone (>80), approaching a downward crossover.
It suggests a possible short-term halt in growth or correction.
But in strong trends it may "stick" to the upper range.
📌 Potential scenarios:
🟢 Bullish:
If the price breaks above 109.341, it may test 111.814 and then 115.802.
Continuation of the HL → HH formation will confirm a trend reversal and further growth.
🔴 Bearish:
If the price does not stay above 109k and breaks below 105.370, there is a risk of a test of 102.650 and lower.
A break of 100.095 and especially 98.213 will negate the growth structure.
🧠 Conclusions:
The market is at a key decision point - HL formation vs. resistance zone.
Buyers' strength will be confirmed only after breaking 111-112k.
Stochastic RSI warns of potential pullback or consolidation.

$BTC Breakout $108k soonCRYPTOCAP:BTC is showing strength after bouncing from the $105K support zone.
It’s now trying to break above $108.5K.
If that happens, the next target could be around $111K–$112K.
The trend looks positive with growing momentum, but if BTC drops below $105K, this move could fail.
For now, bulls are in control.
Let’s see if they can keep it going.
DYRO, NFA

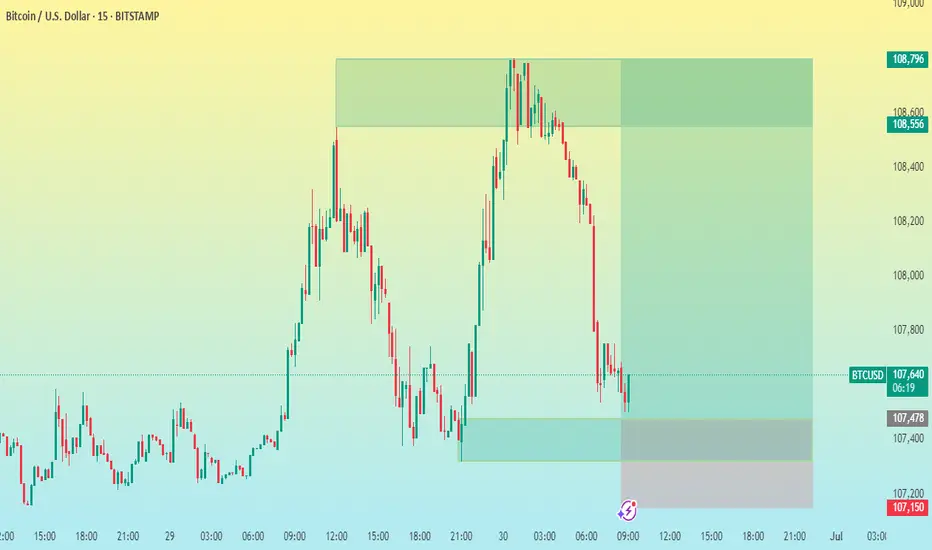
BTC/USD 15M CHART PATTERNHere's a summary of your BTCUSD 15-minute trade setup:
---
Trade Type: Buy
Entry Price: 107,500
Take Profit Levels:
1. TP1: 108,000
2. TP2: 108,300
3. TP3: 108,796
Stop Loss: 107,150
---
Risk-Reward Analysis:
Risk (SL): 107,500 - 107,150 = 350 points
Reward:
TP1: 500 points → ~1.43 R/R
TP2: 800 points → ~2.29 R/R
TP3: 1,296 points → ~3.70 R/R
---
Would you like me to turn this into a trading journal entry, script (e.g., for TradingView/MetaTrader), or analyze the probability based on recent price action?
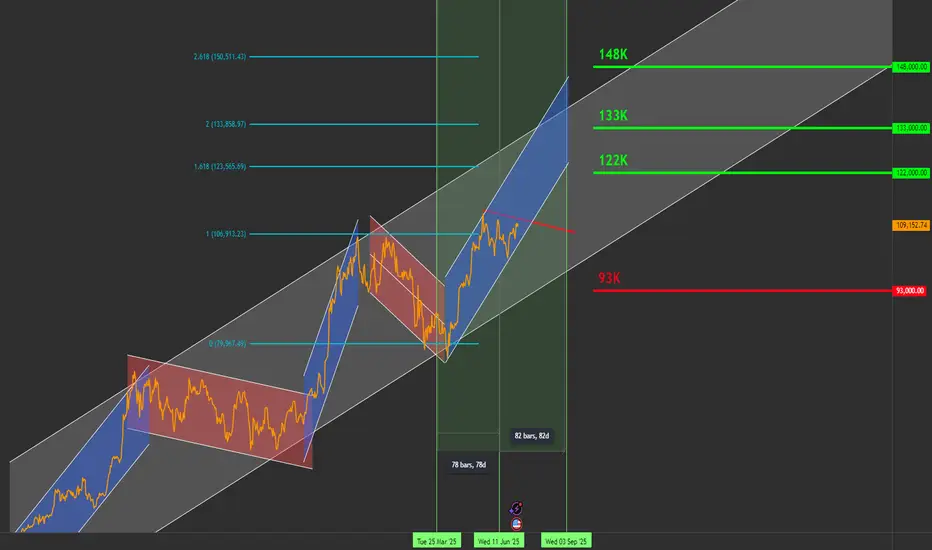
Bitcoin Roadmap to $144K by September – Daily Chart Breakout SetHello traders,
I'm sharing my current outlook on Bitcoin using the daily timeframe. Price is ~109K below a key descending trendline (in red), which has defined the structure since 21 May.
🔍 Key Levels to Watch:
Resistance: $111,000
Support: $91,000
Current Price: ~$109,000
⚡ Breakout Scenario:
If Bitcoin closes above $111K on the daily chart, backed by strong volume (ideally 30% above the 20-day average), I expect the next targets to unfold as:
✅ $122,000
✅ $133,000
✅ $144,000
🗓️ Target date for $144K: Around 22 September 2025
This projection is based on a pivot structure I’m tracking:
🟢 25 March 2025: Pivot low at ~$84K
🔴 12 June 2025: Pivot high
🟡 Expected pivot high: ~4 September 2025 (if symmetry holds)
This pattern suggests a 1-2-3 formation that could lead to a breakout move.
🧯 Failure Scenario:
If BTC fails to break out, I’m watching for a pullback toward the $91K support zone.
🛑 Current Stance:
I’m not in a position yet. Waiting for a daily candle close above $111K with volume confirmation and momentum indicators.
📣 Stay Updated
I’ll be sharing daily updates as the price action evolves.
Follow me here on TradingView, and feel free to share your analysis or ask questions in the comments!
🏷️ Hashtags:
#BTCUSD #BitcoinAnalysis #CryptoTrading #BTC #TechnicalAnalysis #SwingTrade #BreakoutSetup
Let me know your comments.
waiting for BTC to reach to demand area#BTC we will buy @107350 with the SL of 106800 for target 109000 and above

July 4 Bitcoin Bybit chart analysisHello
This is Bitcoin Guide.
If you "follow"
You can receive real-time movement paths and comment notifications on major sections.
If my analysis was helpful,
Please click the booster button at the bottom.
Here is the Bitcoin 30-minute chart.
There is no Nasdaq index announcement today.
There is a possibility that Nasdaq will fall sharply,
but even if it moves sideways, the probability of the strategy succeeding increases.
On the left, with the purple finger,
I connected the 2nd section of the long position that I entered yesterday.
*When the blue finger moves,
Bidirectional neutral
Short->Long or long waiting strategy
1. 109,638.1 dollars short position entry section / cut-off price when orange resistance line is broken
2. 108,764.4 dollars long position switching / cut-off price when green support line is broken
3. 110,273.1 dollars long position 1st target -> target price in order from Miracle
If the strategy is successful, I left a simulation with the pink finger,
so please refer to it.
Those who held long positions yesterday, please check if the purple support line is broken,
If it falls immediately from the current position or
If the pink resistance line is not broken when the 1st section at the top is touched,
It is a vertical decline section,
And if the 109,638.1 dollar short position entry section at the top is not touched,
It is a long waiting strategy at the 2nd section at the bottom.
I think it would be good to think of it as a game in the 1+4 section.
From the 2nd section breakout, I have marked the Bottom -> 3rd section at the bottom.
Up to this point, please just refer to and use my analysis,
I hope you operate safely with principle trading and stop loss prices.
Thank you for your hard work this week.

$BTC/USDT 6H Update BTC has broken out and is now retesting the breakout zone.
If this level holds, we could see a push toward $111K–$112K.
Key support remains around $108K.
DYRO, NFA

Bitcoin Faces Impending Drop to Mid-30,000sAs of July 02, 2025, Bitcoin’s price chart, crafted by "RoadToAMillionClub" on TradingView, paints a concerning picture. Currently hovering at $107,831, the cryptocurrency appears to be teetering at the edge of its upper channel, signaling potential trouble ahead. The recent 0.51% dip may be just the beginning of a more significant decline.
The long-term upward trend, marked by a supportive orange line since 2018, has been a beacon for bulls. However, the green trend line projecting a drop toward the mid-30,000s range, around $37,932, suggests a looming correction. This level, a historical support zone, could become the next battleground as selling pressure mounts.
Market indicators point to overextension, with the price hitting a 4-day and 14-day high of $107,831 before the recent pullback. The speculative fervor that drove Bitcoin to these heights seems to be waning, increasing the likelihood of a bearish turn. Investors should brace for volatility, as the cryptocurrency may struggle to maintain its current altitude, potentially sliding toward the mid-30,000s in the coming months.

BTCUSD Bullish sideways consolidation supported at 101.780Trend Overview:
BTCUSD remains in a bullish trend, characterised by higher highs and higher lows. The recent intraday price action is forming a continuation consolidation pattern, suggesting a potential pause before a renewed move higher.
Key Technical Levels:
Support: 101,780 (primary pivot), followed by 100,380 and 98,184
Resistance: 109,170 (initial), then 111,600 and 114.140
Technical Outlook:
A pullback to the 101,780 level, which aligns with the previous consolidation zone, could act as a platform for renewed buying interest. A confirmed bounce from this support may trigger a continuation toward the next resistance levels at 109,170, 111,600, and ultimately 114,140.
Conversely, a daily close below 101,780 would suggest weakening bullish momentum. This scenario would shift the bias to bearish in the short term, potentially targeting 100.390 and 98,180 as downside levels.
Conclusion:
BTCUSD maintains a bullish structure while trading above the 101,780 support. A bounce from this level would validate the consolidation as a continuation pattern, with upside potential toward the 109,170 area. A breakdown below 101,780, however, would invalidate this view and suggest deeper corrective risk.
This communication is for informational purposes only and should not be viewed as any form of recommendation as to a particular course of action or as investment advice. It is not intended as an offer or solicitation for the purchase or sale of any financial instrument or as an official confirmation of any transaction. Opinions, estimates and assumptions expressed herein are made as of the date of this communication and are subject to change without notice. This communication has been prepared based upon information, including market prices, data and other information, believed to be reliable; however, Trade Nation does not warrant its completeness or accuracy. All market prices and market data contained in or attached to this communication are indicative and subject to change without notice.

Is BTC getting ready for a new ATH?🔍 1. Key Support and Resistance Levels (Horizontal Lines):
🟢 Resistances (Green Lines):
114,295.54 — strong resistance resulting from previous highs.
112,767.65
111,009.00
110,685.35 — current key level that price may try to retest after a potential breakout.
🔴 Supports (Red Lines):
108,496.55 — current level being tested, also coinciding with local resistance from the past.
107,687.57
105,888.74
102,909.85
100,848.07
98,208.22 — strong long-term support; in the past, this level was reacted with a strong bounce.
🔶 2. Downtrend channel marked with orange lines:
The upper downtrend line acted as resistance.
The lower uptrend line acted as support.
The price recently broke above the upper line, but is now testing it again - this could be a retrospective retest.
➡️ If the close of the H4 candle is above this line - a possible confirmation of the breakout.
📊 3. Stochastic RSI indicator (at the bottom of the chart):
Currently in the uptrend phase after a bounce from the oversold level (<20).
The %K line (blue) is crossed upwards by the %D line (orange) - a bullish signal.
Still below the overbought zone, which suggests that the potential uptrend still has room to develop.
🧠 4. Market structure and price action:
Price broke above the 108.496 level, but is currently struggling to stay above this zone.
A retest of the broken triangle could be a healthy move, provided that support is maintained in the 108k–107.6k area.
A break below and a close below 107.6k could mean a false breakout and a possible decline towards 105.8k or even 102.9k.
🧭 5. Possible scenarios:
✅ Bullish scenario:
Maintaining the 108.496 level and closing the candle above the upper orange line → continued growth.
The nearest targets are:
110.685 (first resistance),
111.009 and 112.767 next.
❌ Bearish scenario:
The price will not stay above 108k and will fall below 107.687.
Possible return to the previous consolidation range with the target:
105.888,
and then 102.909 or 100.848.
🧮 Summary:
Currently, the decisive moment is underway: a test of support after breaking out of the convergent triangle.
The Stoch RSI indicator gives a bullish signal, but the price must confirm the movement by behaving above 108k.
Retest and bounce - this is a bullish scenario.
A breakdown and return under the trend line - means that the breakout was false.

BTCUSD parallel channel On the daily chart, BTCUDS is running in the parallel channel. The short-term market fell back after testing the upper resistance. At present, we can pay attention to the short-selling trading opportunities, and the downside target is around 98000. If the price breaks through the resistance near 108800, it will break the channel.

Bitcoin Long: Going for Final Wave 5 of 5Bitcoin has hit the previous target and even breached lower. Now I believe the time has come to go long again with the stop just below recent low of around $98,500 and the take profit target as the old high of $112,000.
Good luck!

BITCOIN STRONG RESISTANCE AHEAD|SHORT|
✅BITCOIN is going up now
But a strong resistance level is ahead at 112,000$
Which is also an All-Time-High
Thus I am expecting a pullback
And a move down towards the target of 107,300$
SHORT🔥
✅Like and subscribe to never miss a new idea!✅
Disclosure: I am part of Trade Nation's Influencer program and receive a monthly fee for using their TradingView charts in my analysis.

BTCUSD RISKY 4H SHORTPrice broke out of bearish trendline but formed resistance at $110600. Price printed a bearish engulfing pattern following Positive US jobs data. A potential two tops or double tops formed. A potential reversal to at least $105000.

EMA SystemThe system of Moving Averages I started out using is the 9-21-50 SMA. I would use the Fast EMA as a trailing stop loss and only trade long when it's above the 50 SMA. The 21 SMA is often a zone where price can bounce back.
12-21 EMA—EMA of EMA can work as well. So can 50-200 SMA or EMA of EMA for telling the larger trend if you want to enter an Option, then trading against it can be fatal.

Bullish bounce for the Bitcoin?The price is falling towards the pivot which is a pullback support and could bounce to the 1st resistance.
Pivot: 108,797.87
1st Support: 106,083.15
1st Resistance: 112,003.20
Risk Warning:
Trading Forex and CFDs carries a high level of risk to your capital and you should only trade with money you can afford to lose. Trading Forex and CFDs may not be suitable for all investors, so please ensure that you fully understand the risks involved and seek independent advice if necessary.
Disclaimer:
The above opinions given constitute general market commentary, and do not constitute the opinion or advice of IC Markets or any form of personal or investment advice.
Any opinions, news, research, analyses, prices, other information, or links to third-party sites contained on this website are provided on an "as-is" basis, are intended only to be informative, is not an advice nor a recommendation, nor research, or a record of our trading prices, or an offer of, or solicitation for a transaction in any financial instrument and thus should not be treated as such. The information provided does not involve any specific investment objectives, financial situation and needs of any specific person who may receive it. Please be aware, that past performance is not a reliable indicator of future performance and/or results. Past Performance or Forward-looking scenarios based upon the reasonable beliefs of the third-party provider are not a guarantee of future performance. Actual results may differ materially from those anticipated in forward-looking or past performance statements. IC Markets makes no representation or warranty and assumes no liability as to the accuracy or completeness of the information provided, nor any loss arising from any investment based on a recommendation, forecast or any information supplied by any third-party.


BITCOIN ANALYSIS - What's Next for for BTC?🎯 KEY LEVELS DECODED
🛡️ FORTRESS SUPPORT: $102,800 - $103,200
_____________________________
NEUTRAL STRATEGY:
Buy Zone: $102,800 - $102,600
Sell Zone: $110,000 - $112,000
Stop Loss: $100,500 (range breakdown)
Target: Opposite end of range
Position Size: 3-5% of portfolio
_____________________________
🎢 SCENARIO : (Probability: 35%)
If BTC consolidates between $102K-$108K :
Range-bound trading for 2-3 weeks
Accumulation phase before next major move
Key levels: Buy $102K, Sell $110K
_________________________
🛡️ RISK MANAGEMENT 🚨 DISCLAIMER 🛡️ DYOR

Bitcoin Running Out Of TIME.Bulls are doing a nice job at holding price in a tight range but are running out of TIME from the 1hr and 4hrs TF's pov while the Daily still needs a few days more to complete its setup for its next burst.
As long as Bitcoin stays within that $106k - $110k range soon we will be testing the ATHs which it should it done by now but its playing a little bit lazy.
Bitcoin still has like 26 1hr bullish candles of TIME to go as high as it can before the next drop take place and that drop will be the one that can put and danger the uptrend direction again so the higher the drop starts the less damage to the trend bears will do.
Buckle up ladies and gentlemen cause Bitcoin will get wild again.
Btc / UsdtBITSTAMP:BTCUSD
1. **Current Price Zone (\~108,000):**
* Price is consolidating just under a supply zone (red rectangle), showing potential rejection from the upside.
* The price briefly pushed above the rising trendline but failed to hold it.
2. **Bearish Structure Forming:**
* Price action suggests a **lower high** and potential **head-and-shoulders** pattern.
* Red squiggle indicates a likely **short-term bearish movement** — a drop to the **demand zone** around **105,700–106,900**.
3. **Demand Zone/Order Block:**
* Marked below near **105,741** with label **"Order"**, showing where potential buy orders may sit.
* This is the first major area where price might find support.
4. **Downside Levels:**
* **106,933** and **105,741**: Potential short-term supports.
* **98,332 (Weekly level)**: If the structure breaks fully, price could revisit this major demand zone.
5. **Upside Resistance:**
* **Red supply zone above 109,000** acts as strong resistance — if BTC breaks that with volume, bullish bias resumes.
---
### 📉 **Short-Term Bias:**
* **Bearish** unless BTC breaks and holds above **109,000**.
* Expecting a pullback toward **106.9k** or **105.7k**, which may offer **buy-the-dip** opportunities.
Disclaimer : Not Financial Advice

$BTC Long Setup. CRYPTOCAP:BTC Long Setup
Price bounced from the key demand zone.
- Entry: CMP
- SL: $108,517
- TP: $110,030
DYOR, NFA
