BTCUSD.PI trade ideas

July 1 Bitcoin Bybit chart analysis
Hello
This is Bitcoin Guide.
If you "follow"
You can receive real-time movement paths and comment notifications on major sections.
If my analysis was helpful,
Please click the booster button at the bottom.
Here is the Bitcoin 30-minute chart.
Shortly later at 10:30 PM and 11:00 PM, there will be a NASDAQ index announcement.
On the left, with a purple finger,
I connected the long position entry point of $106,775.9, which I entered yesterday, to today's strategy.
Since the rebound was not strong yesterday,
the 12-hour chart -> daily chart MACD dead cross is currently under pressure.
Depending on the situation, it can drop strongly to the 3rd section at the bottom,
and since there may be some people who are maintaining long positions yesterday,
I will explain in detail the operating method such as the loss cut price,
so please check it carefully.
*When the blue finger moves,
Bidirectional neutral
Short->Long switching strategy
1. 107,300.3 dollars short position entry section / stop loss price when orange resistance line is broken
2. 106,222.2 dollars long position switching / stop loss price when section 2 is touched
3. Top section long position 1st target -> Good 2nd target
It is important until 9 o'clock when the 12-hour candle is created.
After 9 o'clock, the blue finger 106,222.2 dollars at the bottom
Becomes the main support line
If it comes down from the current position, section 2
The main support line is divided.
In terms of the pattern, it is section 6+12.
If section 2 is touched right away,
There is a high possibility of a strong drop today,
So you should be careful.
- Those who are maintaining a long position
If you touch the 2nd section before 9 PM without touching the short position entry point at the top
You should operate at a loss cut price.
I think it would be good to adjust it according to leverage.
If it falls after touching the 1st section at the top
It becomes a vertical decline condition.
From the bottom, from the 3rd
Maximum Bollinger Band daily chart support line section
Please note that it can be pushed up to 100,685.5 dollars.
I have never changed my perspective suddenly or irresponsibly after leaving an analysis article.
I did my best until the end today.
Please use my analysis article so far only for reference and use
I hope you operate safely with principle trading and loss cut prices.
Thank you.

#5572025 | BTCUSD Supply Zone 1:10BTCUSD Supply Zone Appears in D1 Time Frame Looking Price Action for Long Term Sell
Risk and Reward Ratio is 1:10
After 50 pips Profit Set SL Entry Level
"DISCLAIMER" Trading & investing business is "Very Profitable" as well as risky, so any trading or investment decision should be made after Consultation with Certified & Regulated Investment Advisors, by Carefully Considering your Financial Situation.

BTCUSD Trading Opportunity! SELL!
My dear subscribers,
This is my opinion on the BTCUSD next move:
The instrument tests an important psychological level 10686
Bias - Bearish
Technical Indicators: Supper Trend gives a precise Bearish signal, while Pivot Point HL predicts price changes and potential reversals in the market.
Target - 10417
My Stop Loss - 10836
About Used Indicators:
On the subsequent day, trading above the pivot point is thought to indicate ongoing bullish sentiment, while trading below the pivot point indicates bearish sentiment.
Disclosure: I am part of Trade Nation's Influencer program and receive a monthly fee for using their TradingView charts in my analysis.
———————————
WISH YOU ALL LUCK
Bitcoin ConsolidatesBitcoin is currently consolidating just below a clear descending trendline, showing a series of lower highs since its recent local top near $112,000. Price is hovering around $106,300, holding just above key horizontal support at ~$105,800. This level coincides with the 50-day moving average (blue), which is currently acting as dynamic support.
So far, Bitcoin has respected the ~$100,700 level as major support after the mid-June shakeout. As long as price remains above that zone and holds the 50 MA, the bullish structure remains intact despite the short-term lower highs. But the more price compresses beneath the descending resistance, the more likely we see a breakout (or breakdown) soon.
The 200-day moving average (red) is well below current price action, hovering near $95,000. That’s a long way down and would likely only be tested if broader market conditions deteriorate significantly.
Volume is tapering, suggesting traders are waiting for a decisive move. A break above the descending trendline and reclaim of $110,000+ would invalidate the current short-term downtrend and likely bring $112,000 and new highs into view. A loss of $105,800, on the other hand, puts $100,700 back in play – and below that, things could get ugly quickly.
For now, the trend is neutral within a broader uptrend. The bulls are holding the line – but just barely

BEARISH ELLIOTT WAVE PATTERN ON BITCOINIn this short video, I explain the complex Triple Three Elliott wave pattern identified on the hourly chart on Bitcoin.
Based on the identification of the second wave X at $110,600 my most probably expectation is the completion of wave Z which will take the corrective form of an A-B-C pattern to an intended target below $98,225.
The alternative scenario is that the corrective wave ended at wave Y and the depicted Y-X wave is an impulse wave 1 and were likely on wave 2 to continue to a wave 3 which will break into a new all time high above $125,000.
Currently, I am personally in favor of the completion of wave Z as wave Y-X could not break above the MAJOR Resistance at $112,000.

BTCUSD parallel channel On the daily chart, BTCUDS is running in the parallel channel. The short-term market fell back after testing the upper resistance. At present, we can pay attention to the short-selling trading opportunities, and the downside target is around 98000. If the price breaks through the resistance near 108800, it will break the channel.

BTC/USD Short Setup – Breakdown from Bear Flag Edge🚀||| 👆Your Boost is appreciated in Advance👆 |||🚀
Thesis: Bitcoin is trading within a well-defined descending channel, potentially forming a bear flag on the higher time frame. Price is currently hovering just below the key resistance zone near $108,600 (“The Edge”), failing to reclaim the upper boundary of the flag.
==================================================================
Entry: 🔻 Short at $106,850 – Price is rejecting the upper channel resistance and failing to break above “The Edge”
Stop-Loss: 🔺 $109,000 – Above the recent swing high and invalidation of the flag structure
Take-Profit 1: ✅ $104,700 🎯
Take-Profit 2: ✅ $102,400 🎯
Optional extended:
TP4: $98,000 – Full measured move of the flag breakdown
Risk-Reward Ratio: ~1:1 to 1:4 depending on target
====================================================================
#MJTrading
#BTCUSD #Bitcoin #CryptoTrading #ShortSetup #BearFlag #TechnicalAnalysis #PriceAction #MarketStructure #SwingTrade #TradingView

BITCOIN - NEW BREAKOUT !Hello Traders !
The BTC failed to break the support level (101570 - 100377).
Currently, The resistance line is broken !
So, I expect a bullish move🚀
___________________
TARGET: 110400🎯

Bitcoin Wave Analysis- Bitcoin reversed from long-term resistance level 110000.00
- Likely to fall to support level 105000.00
Bitcoin cryptocurrency recently reversed down from the major long-term resistance level 110000.00 (which has been steadily reversing the price from the start of this year, as can be seen below) – intersecting with the upper daily Bollinger Band.
The downward reversal from the resistance level 110000.00 stopped the previous medium-term impulse wave (3) from the start of June.
Given the strength of the resistance level 110000.00 and the overbought daily Stochastic, Bitcoin cryptocurrency pair can be expected to fall to the next support level 105000.00 (low of the previous correction (2)).

Has Bitcoin Topped? Trump’s SBR Impact | Deep Dive Analysis🚨 Has COINBASE:BTCUSD topped? Even with Trump's Bitcoin Strategic Reserve? 🚨
In this deep dive, we analyze COINBASE:BTCUSD major factors that could point to a major reversal or breakout and to uncover whether a market top is forming.
We’ll cover:
Powerful Indicators
Bitcoin / BTC Trends
Price Action
EMA / SMA Trends
Volume Delta
Trend reversal / breakout
Bullish / Bearish / Confirmation from Indicators
order flow analysis
Timeframes (1W, 1D, 1m, 6M etc.)
Bullish and Bearish Sentiment
Strength Candles
👉 Like, comment below, and follow for more pro-level crypto insights.
MartyBoots here , I have been trading for 17 years and sharing my thoughts on COINBASE:BTCUSD .
Whether you're a short-term trader or long-term investor, this post provides the technical insight and edge to help you make better informed decisions.
📉 Stay ahead of the market. Watch the full breakdown and view charts to decide for yourself: Has Bitcoin really topped?
Watch video for more details and below I will show some powerful charts with descriptions.
Warning in near term - LARGE ORDERS
Consolidation in price with large orders above
The Red lines = LARGE ORDERS
Large orders can act as an magnet to price
Large orders can also be support and resistance
Price Above the white 100 moving average
Price strong above it
Price weak below it
Strength Candles
Still Bullish
Multiple timeframes still green
Sentiment Tool Still Bullish
Still Bullish
Multiple timeframes and settings still green
3 Drive Structure
Equal Measured moves
Implies Top Is Not In
Target = $126k
Bullish Engulfing Candle
Implies higher prices to come
👉 Like, comment below, and follow for more pro-level crypto insights.
#Bitcoin #Trump #BTC #CryptoTrading #TechnicalAnalysis #CryptoMarket #BitcoinTop #TradingView #StrategicBitcoinReserve

BITCOIN Cup & Handle completed! Technical Target $169k!Bitcoin (BTCUSD) is about to complete the Handle of a Cup and Handle (C&H) pattern. This comes only days after breaking below its 1D MA50 (blue trend-line) buy holding the 1D MA200 (orange trend-line) and rebounding.
Well the 1D MA50 has been recovered and on top of that, the 1D MACD just formed a Bullish Cross. This (isolated) Bull Flag, which is the Handle, technically targets the 2.0 Fibonacci extension at $169000.
Do you think that's realistic or a little excessive within thin time-frame? Feel free to let us know in the comments section below!
-------------------------------------------------------------------------------
** Please LIKE 👍, FOLLOW ✅, SHARE 🙌 and COMMENT ✍ if you enjoy this idea! Also share your ideas and charts in the comments section below! This is best way to keep it relevant, support us, keep the content here free and allow the idea to reach as many people as possible. **
-------------------------------------------------------------------------------
💸💸💸💸💸💸
👇 👇 👇 👇 👇 👇

BTC/USD BULLISH 30 MINUTES ANALYSISmarket may be going to buy side . i feel the market will rise further ,and i am quite confident it can go significantly higher and hit its target .

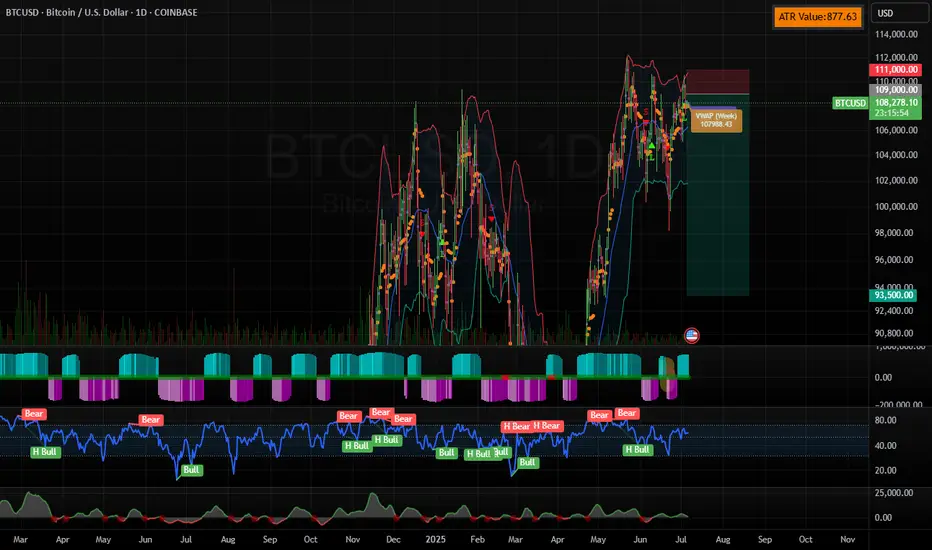
BTCUSD H4 Potential DropHi there,
BTCUSD H4: As long as the 85,119.33 level holds, the overall trend remains bullish in a larger scope.
Currently, the price is trading below the diagonal dotted trendline. The further it stays below this trendline, the stronger the bears' position.
The level of 101,574.21 is open for a bias towards 93,511.35.
Happy Trading,
K.
Not trading advice.

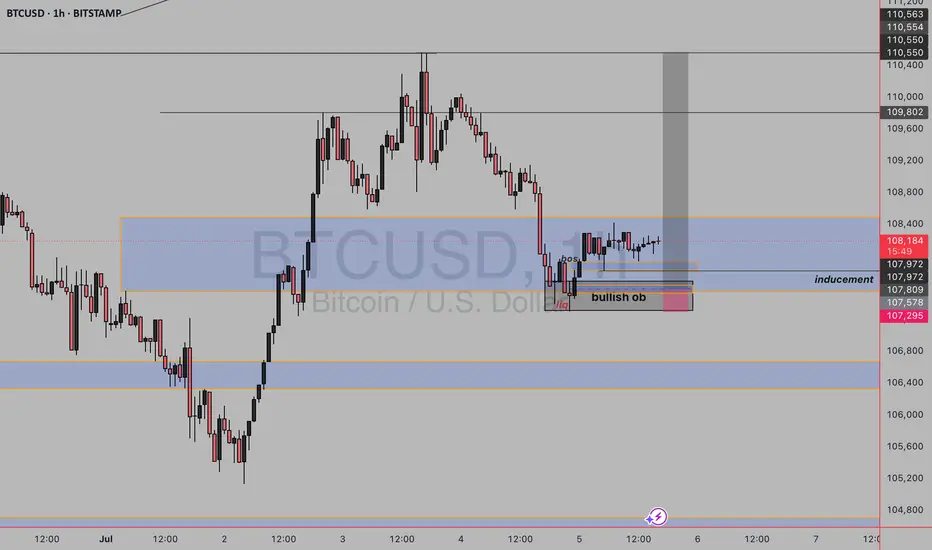
BULLISH BITCOINAs we can see we are currently on an uptrend on higher timeframe and price is in daily fvg and has mitigated the bullish order block on daily tf on lower timeframe we have seen liquidity sweep and break of structure and clear inducement provided so we wait for price to tap the ltf orderblock and buy
BTCUSD Daily TF Bull FlagThe daily timeframe bullish flag is a strong indication that the market is preparing for another bull run. The target for this will be around $140k - slightly higher.
I am anticipating a minor pullback to either one of the daily demand zones - (most likely the highest one) before the bulls take over.

Bitcoin long $600k- long Bitcoin targeting $10-12T market cap by 2028
- acceleration of companies accumulating Bitcoin + continuation of Saylor & Strategy's ongoing TWAP
- notable uptick in global concerns w/ having access to non-sovereign store of wealth not affected by government intervention + over-reliance on USD + US Debt
- Gold's current market cap: $23T. Bitcoin is incredibly more useful as a SOV that's transferable easily across nation states & easier to transact with between parties anywhere globally
- currently holding $100k support after selling off to ~$75k during tariff fears + austerity with DOGE + macro higher low from last year and held support from November election
- including improved crypto regulatory environment otw soon + general sentiment around crypto a lot more positive

BTC ShortResistance at 111k has proven to be challenging for BTC, and I believe that it needs to retrace to regain momentum to go meaningfully higher.
On the hourly chart, price has been squeezing for the longest since June which resulted in a drop of more than 10%. The squeeze and RSI divergence pattern between the two periods is very similar. BTC enjoyed the tailwind of the USD falling significantly since the beginning of the year, but I believe it will start to strengthen again.
TP is the 93-94k range. I will cut losses at 111k. If the trade gains momentum and slices through 93k, then I will continue to trail stops until it reverts. At that time, I will most likely go long for the next major upside push.
Risks:
There are three major pieces of crypto legislation that could cause unpredictable swings.
Also, it's crypto, so anything can and routinely does happen :P
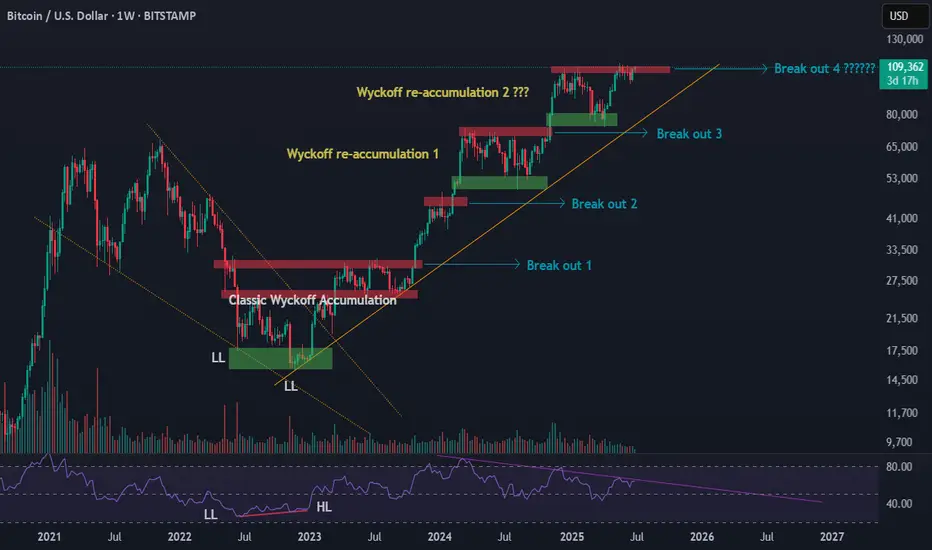
BTC Market Structure (June 22 - June 25): Wyckoff Insights + RSIOver the past few months, I’ve been closely studying Bitcoin’s macro structure from June 2022 to June 2025, and I believe we’re witnessing a textbook example of Wyckoff theory unfolding in real time — not just once, but in multiple phases.
🔍 Phase 1: Classic Wyckoff Accumulation (June 2022 – Oct 2023)
Starting June 2022, BTC began forming a major bottoming structure.
By November 2022, price made a lower low — but RSI (14) was making higher lows, a clear sign of bullish divergence.
From there until October 2023, BTC moved sideways in a Wyckoff accumulation range.
This was Phase A–E in classic Wyckoff terms:
Selling Climax (SC)
Secondary Test (ST)
Spring (false breakdown)
Last Point of Support (LPS)
Sign of Strength (SOS)
🚀 Phase 2: Markup with Re-Accumulations at Each Leg
After the October 2023 breakout, BTC has followed a highly structured rally with multiple consolidation phases and healthy corrections:
✅ Breakout 1:
From ~$31K to $48K → +53% move
Followed by a ~20% pullback to ~$38K
➜ This formed a re-accumulation phase, consolidating above prior resistance
✅ Breakout 2:
From $38K to $73K → +50% move
Then a deeper ~31% correction to ~$50K
✅ Breakout 3:
From $50K to $109K → +48% move
Current pullback to ~$74K → ~31% retracement
Now trading near ATH region again
🧠 Key Observation
In this cycle, we’re seeing not only one accumulation at the bottom, but also clear Wyckoff Re-Accumulation zones forming after each breakout, especially after Breakouts 1 and 3.
This suggests institutional accumulation continues during the trend, supporting the idea that:
Pullbacks are for re-loading, not distribution
Trend strength remains intact as long as prior re-accumulation lows hold
🧭 What This Means for the Current Cycle
If this structure continues, BTC may be preparing for another markup leg above $110K
Historical fractals from past bull markets (e.g., 2020–2021) show similar behavior
RSI structure and market rhythm continue to favor trend continuation, not exhaustion
📌 Conclusion
We are likely in the mid-to-late phase of a well-structured bull market, supported by:
Wyckoff Accumulation at the bottom
Re-Accumulations after each breakout
Healthy 20–31% pullbacks
RSI confirming internal strength
🔔 Next levels to watch:
Support: $74K, $88K
Resistance: $111K–$115K
Breakout target (if pattern continues): $145K–$175K zone
📢 Let me know what you think!
Do you see similar Wyckoff structure?
Drop your thoughts or charts below 👇
#BTC #Bitcoin #Wyckoff #CryptoTA #TradingView #BTCAnalysis #Reaccumulation #RSI #BullMarket
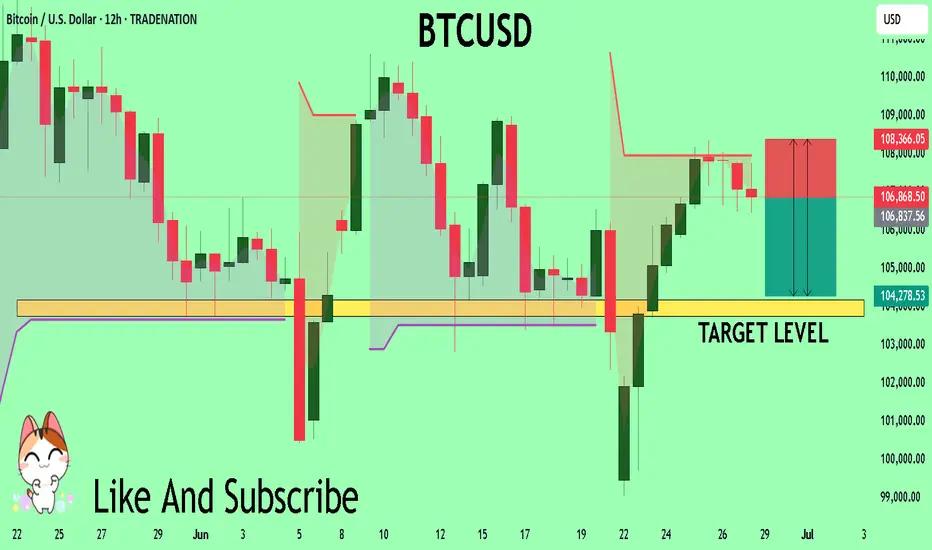
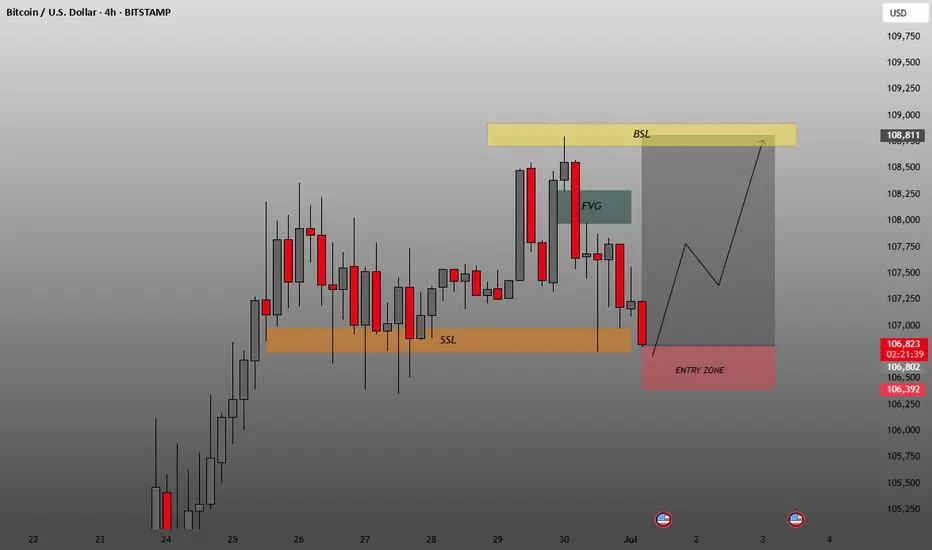
Often targeted before potential reversal or continuation moves.Key Zones & Annotations
BSL (Buy-Side Liquidity) – Yellow box at the top (~$108,811):
Represents liquidity above recent highs.
Often targeted before potential reversal or continuation moves.
SSL (Sell-Side Liquidity) – Orange box below current price:
Represents liquidity under recent lows.
The market just swept this area, possibly to trigger liquidity grabs or stop hunts.
FVG (Fair Value Gap) – Blue shaded box:
Indicates an imbalance area where price could return for mitigation.
Price might revisit this area before or during a bullish move.
Entry Zone – Red box around current price:
Marks a potential long entry area.
Positioned just after sweeping the SSL.
Projected Move (Gray Box):
Forecasted price trajectory is bullish, aiming for levels above $108,500+, targeting the BSL area.
🧠
Interpretation Based on Smart Money Concepts
Market swept sell-side liquidity (SSL), suggesting weak hands or stops were taken out.
Entry zone aligns with a potential order block or demand zone.
Anticipated move is bullish, likely targeting the imbalance and BSL.
✅
Trading Insight
This is a classic Smart Money reversal setup:
Liquidity sweep below.
Entry near demand zone.
Targeting inefficiencies and liquidity above.
Last chance to make profit from BTC with buying positionBullish flag
Strong resistance breakout
2 bull points
Position trade spot buying
Bitcoin completing timecycle on oct 2025 after that it would be 4th time if market again crash for around 70%
Manage your risk in both future and spot trading
Note: NO analysis would 100% profitable trading is the game of probability and risk management so follow your trading plan with proper risk reward and win rate.

Weekend books are razor-thinUnless we now see follow-through into a daily close > $112 k, the move is noise, not signal. The key pivot levels and base-case roadmap (range drift toward 104 k or 101 k unless 112 k breaks) stay the same—just powered by weekend whipsaw rather than weekday flow.
BTC setup with a 3.9 risk-to-reward ratio.Is BTC beginning a bullish move toward 120K?
This setup offers a 3.9 R:R with an
Entry at 109,000
Stop loss at 106,355
Target 120,000
Not financial advice.
