108400 Breakout Level – Bullish Above, Bearish BelowWatching 108400 closely as a key breakout level.
Above 108400: Momentum shifts bullish – potential for upward continuation.
Below 108400: Bias remains bearish – risk of further downside.
BTCUSD.PI trade ideas

BITCOIN STRATED FORMING BEARISH TREND STRUCTURE.BITCOIN STRATED FORMING BEARISH TREND STRUCTURE.
Market started forming lower low, which indicate bearish trend.
After a long Bullish trend, a correction is expected in market.
Market is expected to remain Bearish in upcoming trading session.
On lower side market may hit the target level of 99,000$ in upcoming trading sessions.
On higher side 12,000$ price may act as a key resistance level for the market.

Bitcoin setup: bearish for now but watch Trump’s crypto deadlineBitcoin is sliding, and the technicals point lower with clear RSI divergence and a possible descending triangle. But this could all change fast. Trump’s crypto working group is set to propose major changes by 23 July. If the news points to deregulation or a return of ICOs, Bitcoin could explode higher. In this video, we break down the chart, the risks, and the potential trigger that could flip sentiment overnight.
This content is not directed to residents of the EU or UK. Any opinions, news, research, analyses, prices or other information contained on this website is provided as general market commentary and does not constitute investment advice. ThinkMarkets will not accept liability for any loss or damage including, without limitation, to any loss of profit which may arise directly or indirectly from use of or reliance on such information.

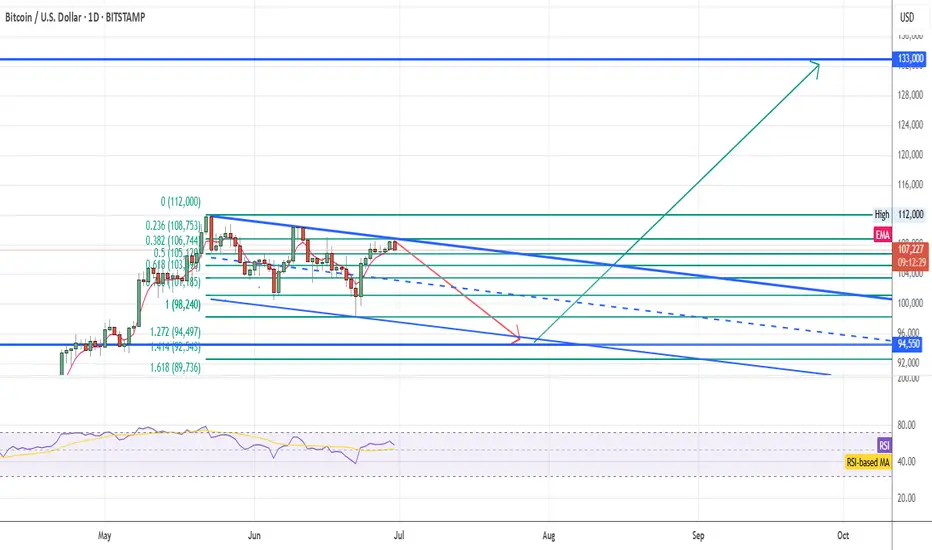
BTC updateBTC is moving in a falling wedge once broken my final target is still intact @133k but in the short term we could see a retracement to 94,5k .
So my plan is to buy BTC in case of 94,5k or in case of bullish continuation , to buy BTC once falling wedge will be up broken.
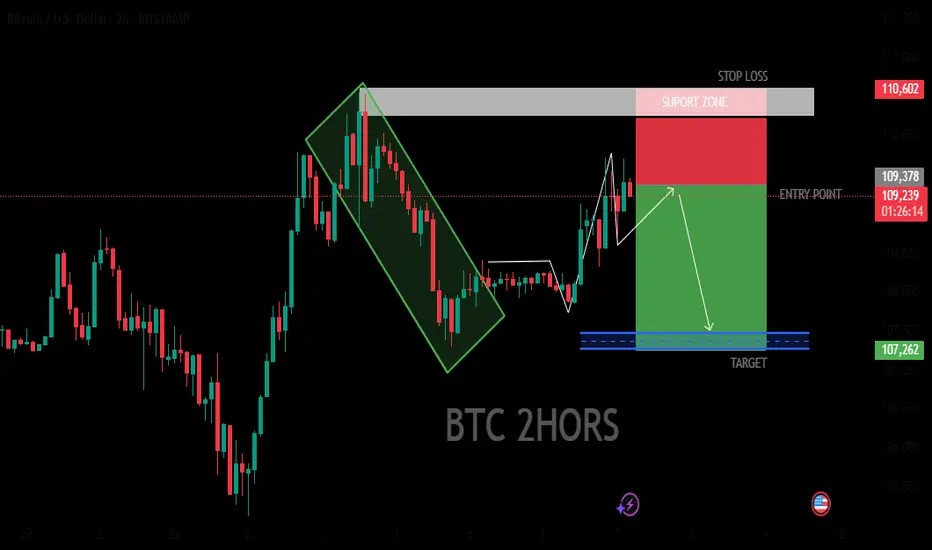
BTC 2HORS BEARISH ANALYSIS
The image suggests that the trader is using technical analysis to identify potential trading opportunities in the Bitcoin market. The use of specific patterns and indicators, such as the descending triangle and target price level, indicates a systematic approach to trading. However, it's important to note that trading carries inherent risks, and past performance is not necessarily indicative of future results.
Bitcoin(BTC/USD) Daily Chart Analysis For Week of July 4, 2025Technical Analysis and Outlook:
During this week's trading session, Bitcoin rebounded from our Mean Support level of 104900 and, with significant momentum, subsequently completing the Mean Resistance level of 110300. Currently, the cryptocurrency is poised for a continuation of its downward trajectory, with a target set at the Mean Support level of 105500. This downward trend may necessitate heightened resilience to address the Key Resistance point at 111700 and the emerging historical price action of the Outer Coin Rally at 114500 and beyond. Nonetheless, it remains essential to acknowledge the possibility that current prices may experience an uptick from this juncture, bolstering the rally mentioned above.

A clear Understanding of $BTC next move As seen in this chart labeled. are the areas we are looking for interest of BULL breakout or bearish and leading into a alt season. Today JULY 4th. less market activity and small bear trap occured leading into today!
keep an eye out for rally in the near future.

BTC? and
It's alliance..
I have this knowledge will like to share: Use it caveat emptor Okay.
US30 and BTC correlate 1:2 approximately.
If US30 moved 10% BTC will move 20%
I will plot from the bottom till now (example) and get the % for US30
Then will double that % from bottom for BTC
This is no mean a crystal ball, but it gives a sense of confidence.
You will then be on a lookout in BTC for??
Whatever you like / preference on BULLISH SIDE; fav pattern bla bla..
All the best.
Do your own research. I am not guru.
NB/ May you will bless with abundance

Navigating BTC the Volatile Path to a Potential $117,000 PeakBitcoin at a Crossroads: Navigating the Volatile Path to a Potential $117,000 Peak
Introduction: A Tale of Two Forces
The world of Bitcoin is once again a theater of high drama. After a breathtaking surge that brought the digital asset tantalizingly close to its all-time high, the market now stands at a pivotal crossroads, caught in a tense tug-of-war between powerful bullish undercurrents and formidable macroeconomic headwinds. On one side, a confluence of unprecedented institutional adoption, potent on-chain signals, and a volatile derivatives market suggests an imminent price explosion. Analysts and investors whisper of a short-term upper bound of $117,000, with some seeing a potential tap of $116,000 as early as July amid a ‘perfect storm’ of macro catalysts. A move to this level would represent a significant 6.45% jump from Bitcoin’s recent price, a leap that seems entirely within reach when viewed through the lens of the asset's internal momentum.
Yet, on the other side stands the unyielding wall of global economic reality. Bitcoin’s recent attempt to decisively conquer the $110,000 level was swiftly reversed as strong U.S. jobs data and other factors tempered expectations of a near-term Federal Reserve rate cut. This macroeconomic reality has cast a long shadow over risk assets, including Bitcoin, creating significant resistance at the previous all-time high of around $112,000. Analysts point to an absence of new, retail-driven buyers and the kind of "FOMO-driven greed" that characterized previous bull runs as a key factor pinning the price down.
This creates a fascinating and high-stakes dichotomy. The very structure of the Bitcoin market has undergone a "paradigm shift," with institutional exchange-traded funds (ETFs) providing a steady, relentless stream of demand. At the same time, the asset remains tethered to the decisions of central bankers and the health of the global economy. This article will delve into the intricate layers of this conflict, exploring the powerful bull case built on on-chain data and market structure, the sobering macroeconomic headwinds, the psychological barrier of the all-time high, and the long-term predictions that see Bitcoin potentially reaching $200,000. As the market braces for pivotal events like the upcoming Jackson Hole Economic Symposium, the question on every investor's mind is which of these two powerful forces will ultimately dictate Bitcoin's next monumental move.
The Bull Case: A Cauldron of On-Chain and Derivatives Strength
Bitcoin’s impressive rally was not a random speculative whim; it was underpinned by a bedrock of strong on-chain and technical signals that paint a compelling picture of underlying market health and explosive potential. These indicators, which provide a transparent view into the blockchain’s activity, suggest that the current price action is just the beginning.
On-Chain Analysis: The Blockchain's Transparent Ledger
On-chain analysis is the practice of examining the public and immutable data on a blockchain to understand the behavior of network participants. Unlike traditional financial markets, where investor actions are opaque, Bitcoin’s ledger allows for a granular assessment of transaction volumes, wallet balances, and investor profitability, offering a data-driven glimpse into market sentiment.
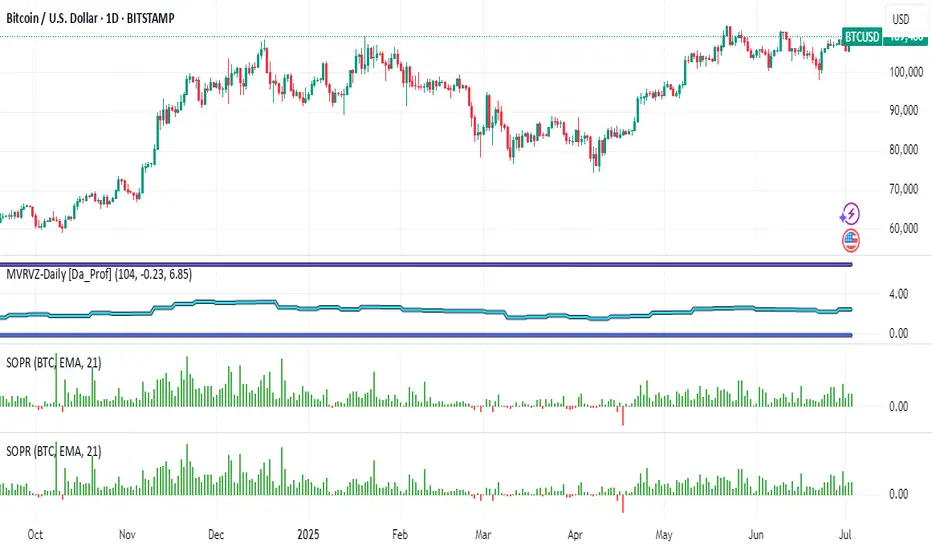
Two of the most powerful on-chain metrics in this context are the Market Value to Realized Value (MVRV) ratio and the Spent Output Profit Ratio (SOPR).
The MVRV ratio is a fundamental valuation tool that compares Bitcoin's total market capitalization to its "realized capitalization." While market cap is the current price multiplied by all coins in circulation, realized cap values each coin at the price it was last moved on-chain. Essentially, MVRV compares the current market price to the average cost basis of all investors. A high MVRV ratio suggests the market is overheated, while a ratio below 1.0 signifies that the average investor is underwater, a condition often seen at market bottoms.
The Spent Output Profit Ratio (SOPR) offers a more immediate look at market behavior by analyzing the profitability of transactions occurring on the network. It is calculated by dividing the sale price of a Bitcoin by the price it was last acquired.
• When SOPR is greater than 1, it means that, on average, coins being sold are in profit.
• When SOPR is less than 1, it means coins are being sold at a loss.
• A SOPR value of 1 acts as a critical psychological level. In bull markets, the market often "bounces" off this line, as investors are reluctant to sell at a loss, creating strong support.
The Derivatives Market: Funding Rates and the Looming Short Squeeze
Beyond the blockchain itself, the cryptocurrency derivatives market provides another layer of bullish sentiment. This market is dominated by perpetual futures contracts, which use a funding rate mechanism to stay tethered to the spot price.
• Positive Funding Rate: When the futures price is higher than the spot price, longs pay shorts, indicating dominant bullish sentiment.
• Negative Funding Rate: When the spot price is higher than the futures price, shorts pay longs, indicating dominant bearish sentiment.
Paradoxically, a deeply negative funding rate can be an extremely bullish contrarian indicator. A crucial historical precedent exists: Bitcoin price rallied 80% the last time BTC funding rates flipped red. When funding rates are negative, it means a large number of traders are shorting the market. If the price begins to rise against them, these short sellers must buy back Bitcoin to close their positions and limit their losses.
This forced buying can trigger a "short squeeze." A large cluster of potential short liquidations has been identified near the $111,320 level, with an estimated $520.31 million in leveraged positions at risk. If the price can push through this zone, it could trigger a cascade of liquidations, providing the fuel to accelerate Bitcoin’s next leg higher into price discovery. This mechanism represents one of the most powerful potential catalysts for a rapid move toward the $116K-$117K target.
The Macroeconomic Maelstrom: A "Perfect Storm" of Headwinds
While Bitcoin’s internal metrics flash green, its path is being obstructed by a formidable storm of macroeconomic factors. In today's interconnected financial world, no asset is immune to the policies of central banks. The recent reversal from the push beyond $110,000 is a stark reminder of this reality, as markets began to discount the odds of the Federal Reserve lowering interest rates.
The Federal Reserve and Interest Rate Jitters
For the past several years, the price of Bitcoin has been highly correlated with monetary policy. A policy of low interest rates generally creates a favorable environment for assets like Bitcoin by lowering the opportunity cost of holding them compared to bonds or savings accounts. Conversely, a period of monetary tightening—characterized by higher interest rates—has a negative effect on Bitcoin's price.
The market's sensitivity to this was on full display when strong U.S. economic data reinforced the case for keeping rates "higher for longer" to contain inflation. This immediately took the wind out of Bitcoin’s sails and halted the rally. An unexpected rate cut, however, could send Bitcoin back toward its all-time high of $112,000.
All Eyes on Jackson Hole
This brings into focus the immense importance of the Jackson Hole Economic Symposium. This annual conference is a crucial event where central bankers from around the globe discuss pressing economic issues and signal future policy directions. Speeches from key figures, particularly the Federal Reserve Chair, are scrutinized by global markets for clues about the future of monetary policy.
The anticipation surrounding the event highlights its high stakes for risk assets. Market participants will be listening for any hint of a dovish pivot (a signal that rate cuts are back on the table) or a hawkish stance (a reinforcement of the "higher for longer" narrative).
• A dovish signal could be the catalyst that reignites Bitcoin's rally by weakening the dollar and sending risk assets soaring.
• A hawkish signal, on the other hand, could reinforce the current headwinds, potentially leading to a deeper correction for Bitcoin.
The Great Wall of $112K: Why All-Time Highs Are Hard to Break
Every seasoned market participant knows that previous all-time highs (ATHs) are not just numbers on a chart; they are formidable psychological barriers. For Bitcoin, the level around $112,000 represents this wall. Breaking through it requires immense momentum, and the current struggle to do so is explained by a critical missing ingredient: widespread, retail-driven Fear of Missing Out (FOMO).
The Psychology of an All-Time High
An ATH represents a point of maximum financial opportunity and maximum regret. This creates a powerful and complex dynamic:
1. Profit-Taking: Long-term holders and traders who bought at lower prices see the ATH as a prime opportunity to realize their gains.
2. Break-Even Selling: Investors who bought at or near the previous peak may be eager to sell as soon as their position returns to break-even.
3. Hesitation from New Buyers: For new investors, buying at an all-time high feels inherently risky, leading to hesitation.
Overcoming this selling pressure requires a massive wave of new demand, a force often fueled by pure, unadulterated FOMO.
The Absence of FOMO-Driven Greed
FOMO, or the "Fear of Missing Out," is the force that turns a rally into a parabolic ascent, characterized by a surge in retail interest and media saturation. Analysts suggest that a key reason Bitcoin can’t break the $112K all-time high is the absence of new buyers and FOMO-driven greed. While there have been spikes in retail enthusiasm, the kind of euphoric mania seen at the peak of previous cycles has yet to fully materialize in 2025. Without that surge of irrational exuberance, there may not be enough buying pressure to absorb the natural selling that occurs at an all-time high, creating a stalemate.
The Paradigm Shift: How Institutional ETFs Changed the Game
While the lack of retail FOMO explains the resistance at the all-time high, the very reason Bitcoin reached this level so quickly is due to a fundamental, game-changing development: the approval and launch of spot Bitcoin Exchange-Traded Funds (ETFs) in the United States. This event represents a true "paradigm shift" in market structure, providing a powerful counterbalance to the whims of retail sentiment.
A spot Bitcoin ETF directly holds Bitcoin and allows investors to gain exposure through traditional brokerage accounts, dramatically simplifying the investment process. This has had a revolutionary impact:
1. Accessibility and Legitimacy: ETFs have democratized access to Bitcoin for a massive new audience and conferred a new level of legitimacy on the asset class.
2. Unlocking Institutional Capital: Most importantly, ETFs created a regulated pathway for institutional investors to allocate capital to Bitcoin.
The impact has been staggering, with massive ETF inflows directly fueling Bitcoin's price appreciation. In a recent two-month period, for instance, U.S.-based spot Bitcoin ETFs recorded nearly $10 billion in inflows. This is not the fickle demand of a retail FOMO cycle; it is the steady, calculated allocation of capital from major financial players, providing a strong floor for the price.
Gazing into the Crystal Ball: Near and Long-Term Price Horizons
With these conflicting forces shaping the market, analysts are looking at both short-term technical targets and long-term fundamental models to chart a potential path forward.
Short-Term Targets: The Path to $117,000
The immediate upper bound for Bitcoin is pegged by many analysts at $117,000, with some suggesting a move to $116K in July is possible. This target is derived from a combination of technical analysis, historical seasonal trends, and the potential for a short squeeze. A decisive break above the $112,000 all-time high would clear the path for a rapid move toward this level.
The Long-Term Vision: A $200,000 Call
Looking further ahead, some of the most bullish predictions from institutional players call for Bitcoin to hit $200,000 by the end of 2025. This forecast is not based on short-term chart patterns but on a fundamental assessment of supply and demand in this new era. The reasoning is that there is simply too much institutional demand to keep prices flat for long, a trend driven by the continued success of spot Bitcoin ETFs and growing regulatory clarity.
Interestingly, this bullish institutional sentiment for Bitcoin is not always extended to other major cryptocurrencies. Some outlooks are less confident that assets like Ethereum (ETH) and Solana (SOL) will hit new all-time highs this year. Challenges such as network reliability issues and the lack of similar institutional products are cited as reasons for a more tempered outlook on these other assets. This suggests a potential future where Bitcoin's performance decouples from the broader altcoin market, driven primarily by its unique status as an institutional-grade digital asset.
Conclusion: The Great Tension and the Path Forward
Bitcoin's current market position is one of profound tension. In the world of its own blockchain and market structure, the signals are bullish. A new era of institutional demand, evidenced by billions flowing into spot ETFs, has created a paradigm shift. This is reinforced by a derivatives market primed for a potential short squeeze.
However, Bitcoin does not exist in a vacuum. It is also a participant in the broader financial ecosystem, where a hawkish Federal Reserve has put a damper on risk-on sentiment. This macroeconomic resistance is amplified by the psychological barrier of the all-time high, where natural profit-taking meets the absence of the retail-driven FOMO that defined past cycles.
The resolution of this conflict will define the next chapter for Bitcoin. A catalyst could come from the Jackson Hole Symposium, a sudden acceleration in ETF inflows, or a shift in the macroeconomic landscape. What is certain is that Bitcoin is no longer just a retail phenomenon; it is a maturing asset on the global stage, navigating a complex interplay of internal strength and external pressures. Whether it reaches $117,000 in the coming months or faces a setback, its journey will be a masterclass in the collision of technology, finance, and human psychology.
BTC AT RESISTANCEThe jobs report just dropped and was stronger than expected. That means the Fed has less reason to cut. That means less chance of immediate liquidity. Since we live in the upside down, apparently more jobs are bad for markets. And we generally see Bitcoin react first and then quickly go back to trading on its own.
All of that said, this is an interesting spot. Bitcoin broke out yesterday, before closing back below the resistance. The same is happening so far today, with a potentially ugly top candle if the day stays this way. But it is WAY too early to judge.
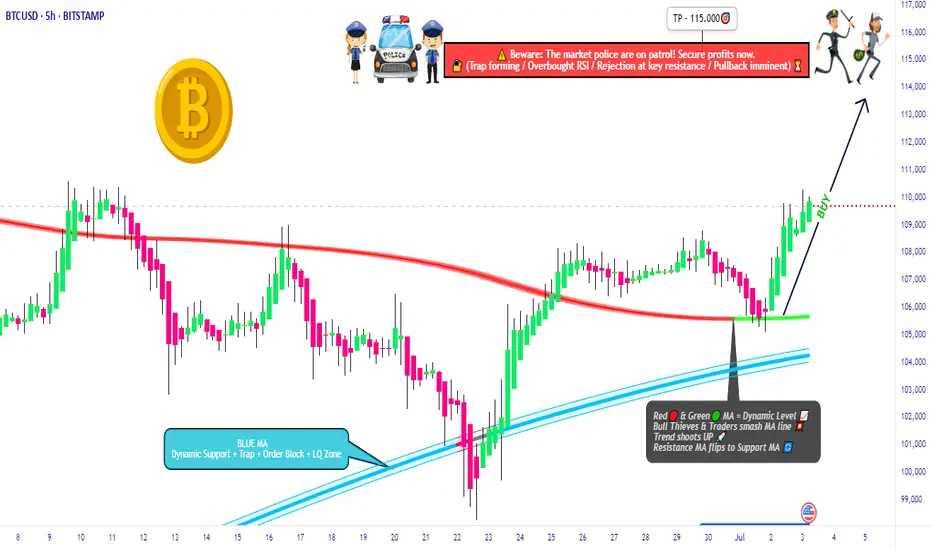
BTC/USD Heist Mode: Buy Low, Escape Rich🔓 BTC/USD Crypto Vault Breach: Thief Strategy for Long Entry Robbery (Swing/Day Setup) 🔓
🌟Hi! Hola! Ola! Bonjour! Hallo! Marhaba!🌟
Dear Money Makers & Robbers, 🤑💰💸✈️
🚨 Welcome to our next Thief Trading-style breakout mission — this time targeting the mighty BTC/USD vault. Using a fusion of technical precision and macro-level insight, we're charting a long entry blueprint for a profitable heist.
🔑 Entry Plan
"The vault is open!" 💥
Buy at current price or set Buy Limit near swing lows (15–30min timeframe pullback entries). We're timing the entry with stealth—precision over panic.
🛑 Stop Loss Setup
SL set near recent swing low (4H TF reference: ~104.000).
Adjust based on position sizing, risk appetite & multi-order tactics.
🎯 Take Profit Target
Targeting 115.000—or exit earlier if price action stalls. Get in, get out. Efficiency is the code.
👀 Scalpers' Notice
Only work the Long side. If your bag’s heavy, strike instantly. If light, ride with swing robbers. Use trailing SLs to protect your bag.
📈 Why We’re Bullish
Market momentum favors the bulls:
Overbought zones acting as lures
Bearish traps ready to flip
Key confluences from sentiment, COT, on-chain & macro analysis
➡️ Full supporting breakdown available 👉👉🔗🔗.
📢 Risk Note – Stay Sharp
Major news events = increased volatility ⚠️
Avoid entries during news. Trail stops to protect running profit. Rob smart.
💖 Boost the Crew
If this blueprint aligns with your mission, hit that Boost button. It fuels the team, and together, we profit like pros. One heist at a time. 💪🎉
🧠 Stay ready—next plan drops soon. Until then, rob safe, rob smart. 🐱👤
Bitcoin summer of fun...If we are in a continuation pattern, and Bitcoin breaks the neckline soon.
We could be on the cusp of a very interesting and strong few months of price action.
Continuation upward sloping #inverseheadandshoudlers

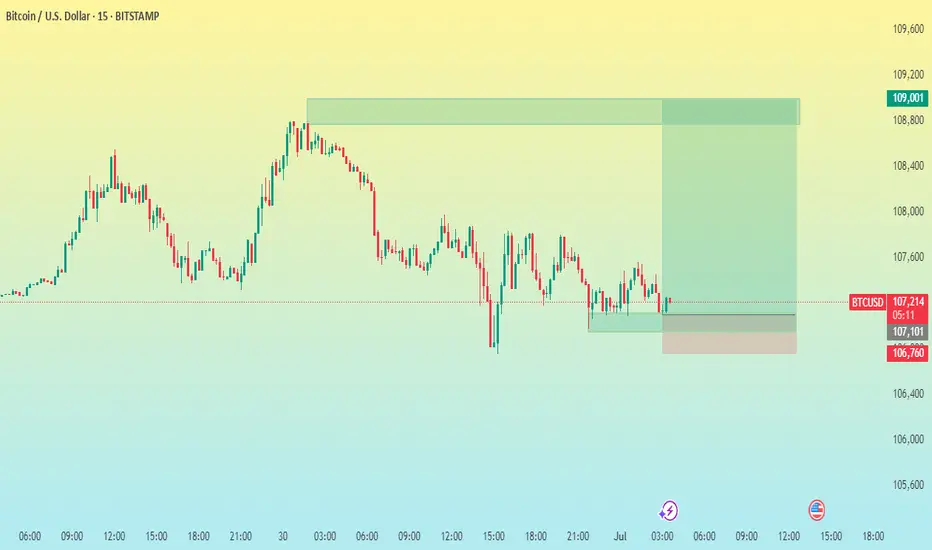
BTC/USD 15M CHART PATTERNHere’s a summary of your BTCUSD trade setup:
---
🟢 Buy Entry: 107,195
🎯 Take Profits:
1. 107,600
2. 108,400
3. 109,000
🔴 Stop Loss: 106,760
---
🔍 Risk-Reward Analysis:
Target Distance from Entry Risk-Reward Ratio (approx)
TP1: 107,600 +405 ~1.1:1
TP2: 108,400 +1,205 ~3.3:1
TP3: 109,000 +1,805 ~5:1
SL: 106,760 -435 —
---
📌 Notes:
Solid R/R: TP2 and TP3 offer favorable risk-reward ratios.
Scalping TP1: TP1 is close; good for quick exit or partial take.
Stop-loss proximity: 435 points below entry; tight but reasonable for short-term trading.
Market condition check: Make sure momentum is in your favor (use indicators like RSI, MACD, or price action confirmation).
Would you like help with setting this up in a trading platform, or converting it into a script for TradingView (Pine Script)?
BTC Blow off top coming soon?BTC cycles is showing the blow off top might be closer then we think, by the end of year 2025
BTC has always done this cycles and I hear "this time is different" since forever.
Do I expect this time to be different? Absolutely not.
Even if it goes to 140k? it is still the same wave and its expected to be honest, 120-140k is still at play and that will be the end of the fireworks finale.

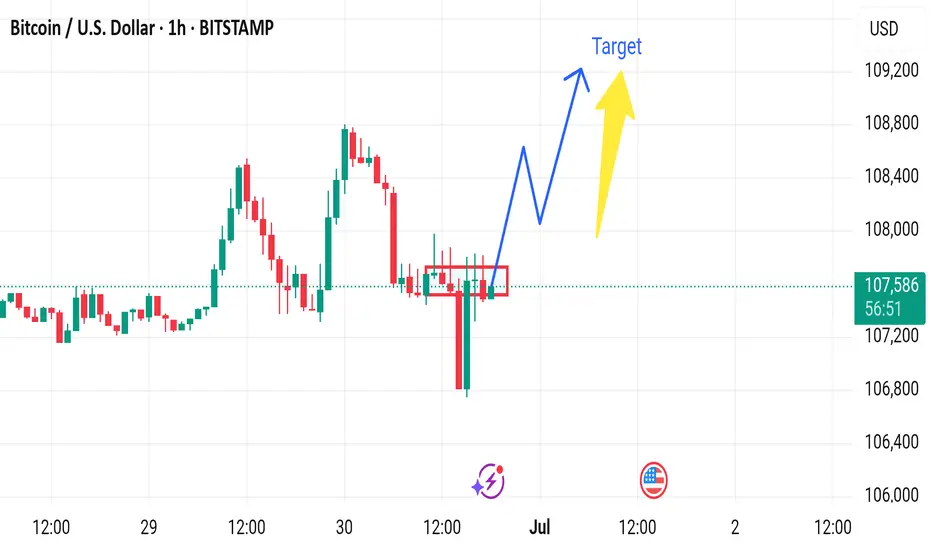
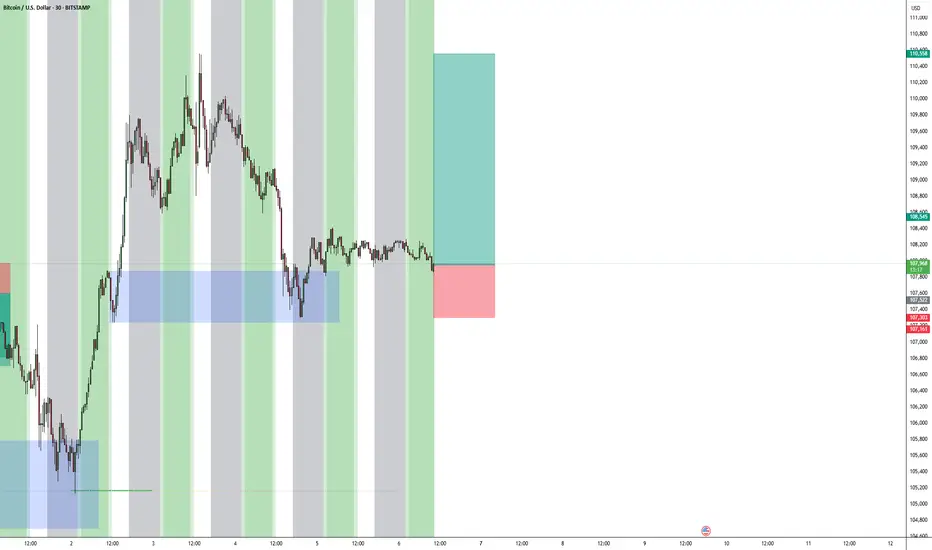
Market next target 🔀 Disruption Analysis – Bearish Alternative Scenario
The current chart suggests a bullish continuation from the consolidation zone around $107,300–$107,500, with a projected move toward $108,500+. However, the following bearish disruption could invalidate that path:
---
🔻 Bearish Disruption Possibility:
1. False Breakout Trap:
If price briefly spikes above the consolidation zone and quickly reverses, it could trap breakout buyers.
A failed bullish move around $107,800–$108,000 would be the first bearish signal.
2. Weak Volume Confirmation:
Lack of volume during the breakout would signal lack of institutional interest, increasing downside risk.
3. Break Below Support Zone:
If BTC breaks below $107,000, it would signal a loss of momentum and invalidate the bullish scenario.
This breakdown may lead to a quick move toward $106,000 or even $105,800, the recent swing low.
4. Macro Influence:
Any negative U.S. economic data or regulatory news could spark bearish sentiment and accelerate the drop.

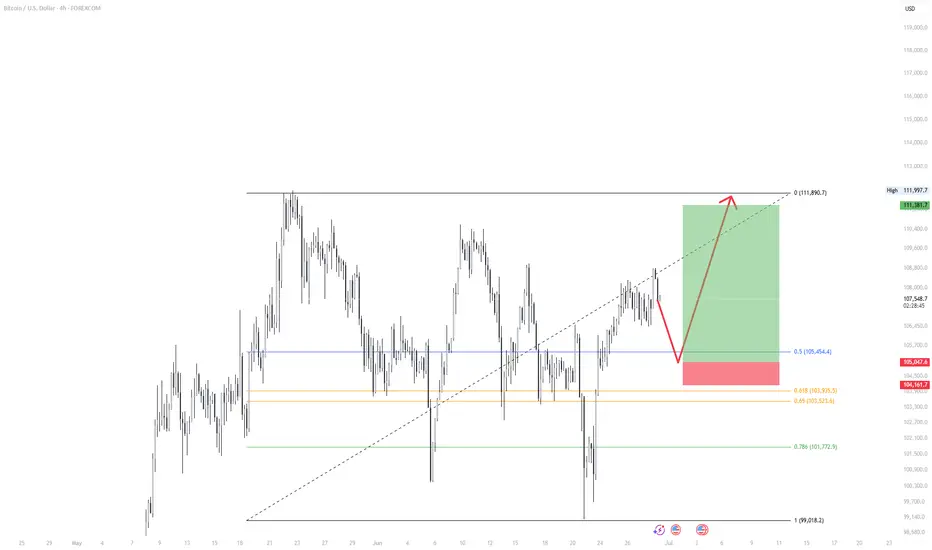
BTC/USD Long Setup – Buy the Dip into SupportMarket Context:
Bitcoin is currently in a retracement phase after rejecting from the local high near 111,900. Despite the short-term pullback, the broader structure remains bullish. This setup is based on a retracement into a key support zone, offering a potential entry for the next leg up.
Setup Idea:
Price is pulling back into a confluence area that includes:
The 0.5 Fibonacci retracement at 105,454
Previous structure support
A retest of the broken diagonal trendline
This zone is expected to act as demand, providing a favorable long entry opportunity.
Trade Plan:
Entry zone: Around 105,400
Stop loss: Below 104,100 (beneath structure and fib zone)
Target: Retest of the previous high near 111,890
Risk/Reward: High R potential with clearly defined invalidation
Notes:
If price breaks below 105,000 and fails to show buying strength, the setup becomes weaker. A decisive break below 103,900 invalidates the trade idea. Wait for bullish confirmation (e.g. higher low or volume reaction) in the entry zone before committing.
This is a clean, structured opportunity aligned with the prevailing trend. Patience and confirmation are key.
Bitcoin May See Short-Term Pullback After Hitting $108,000📊 Market Overview:
Bitcoin surged to $108,000 amid renewed risk-on sentiment, a softer US dollar, and slightly declining bond yields. However, weekend trading sees lower liquidity, and some profit-taking has emerged. Traders are also cautious ahead of next week’s Fed-related news.
📉 Technical Analysis:
• Key Resistance: $108,500 – $110,000
• Nearest Support: $106,200 – $105,500
• EMA 09 (1H): Price is above EMA 09, indicating bullish momentum remains.
• Candlesticks & Volume: Doji candle and falling volume in 1H → suggests weakening upside momentum and possible retracement.
📌 Outlook:
Bitcoin may face a short-term pullback if it fails to break above $108,500 and no fresh catalysts emerge. Holding above $106,200 would keep the broader bullish structure intact.
💡 Suggested Trade Setup:
🔻 SELL BTC/USD at: 108,200 – 108,500
🎯 TP: 106,800
❌ SL: 109,300
🔺 BUY BTC/USD at: 106,200 – 105,500
🎯 TP: 107,800
❌ SL: 104,800


Market ViewWatch
Trade
Manage
SmileWatch
Trade
Manage
SmileWatch
Trade
Manage
SmileWatch
Trade
Manage
SmileWatch
Trade
Manage
Smile

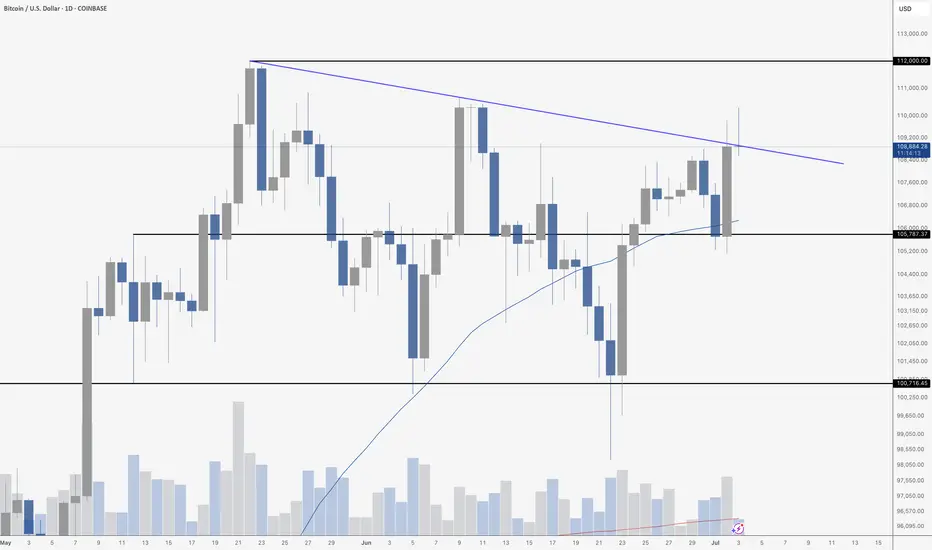
BTC Bulls Target $111,653, Is This the Next Explosive BreakoutThe BTCUSDT 4-hour chart is showing a clearly bullish structure. After consolidating below the $108,664–$107,800 resistance for several weeks, Bitcoin finally broke above this area with a strong impulsive move, confirming the zone as a new support. This breakout coincides with improving market sentiment, especially after Metaplanet’s $108 million purchase of BTC and a surge in ETF inflows, which have been helping Bitcoin reclaim levels above $109,000. The price is currently consolidating just above the breakout area, indicating that buyers are defending this zone aggressively.
Resistance Level 1, around $110,254, is the first significant barrier and aligns with the area that rejected price several times in late May. If this level is broken, the next target sits at Resistance Level 2 near $111,653, which was the major swing high established in early May. Holding above the current support is critical, as a decisive 4-hour close below $107,440 would invalidate this bullish scenario and likely trigger a deeper retracement.
The recent price behavior suggests a potential ascending triangle breakout retest, a classic continuation pattern where buyers step in on each dip. Momentum remains strong, and the risk/reward profile favors long setups as long as the higher-low structure is preserved.
Trade Setup (Bullish Idea)
Entry Zone: $108,700–$109,000 (on a confirmed retest of support)
Stop Loss: $107,440 (beneath the invalidation zone)
Take Profit Targets
o TP1: $110,254
o TP2: $111,653
The setup offers an estimated 2.4–2.7 risk/reward ratio, depending on precise entry and execution. As always, it’s recommended to wait for confirmation candles or wicks rejecting the support zone before entering.
If the breakout holds and volume expands on the push through TP1, Bitcoin could quickly revisit the $112,000 area in line with broader market optimism and institutional buying. Just be aware of the invalidation level, as any breakdown below $107,440 could trigger a fast move back to prior range lows.

BTC BULLISH FLAG AND POLE PATTERN 135,000$ TARGETAs seen in the charts, BTC is currently forming a flag and pole pattern.
Expect price to cover one last liquidity sweep before pumping to the 135-140k price range.
ESH.
