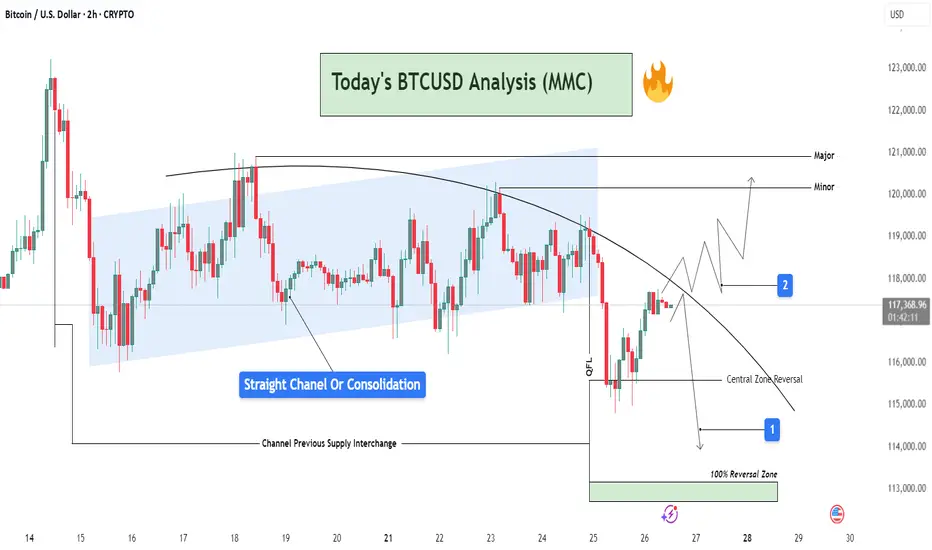
BTCUSD Analysis : Channel Break + QFL Setup | Structure Analysis📊 Chart Overview
This 2H BTCUSD chart reveals a comprehensive view of market behavior transitioning from a phase of consolidation into a potential breakout or further rejection. The price action is analyzed inside a parallel channel, transitioning into a curved resistance path, which is currently governing the market structure.
🔵 Phase 1: Consolidation Inside a Straight Channel
Price has respected a clear ascending channel (highlighted in blue) from July 16 to July 24.
This phase shows a range-bound movement with defined supply and demand zones.
Labelled as “Straight Channel or Consolidation”, this represents a potential accumulation/distribution zone.
The Channel Previous Supply Interchange marks an important S/R flip zone, now serving as a key reference for future reactions.
🔻 Phase 2: Break of Structure & Curved Resistance
Price broke down below the channel support and is now respecting a downward curved trendline.
This indicates a shift in momentum from neutral to bearish, forming lower highs.
A sharp drop occurred post-channel exit, marking a QFL (Quasimodo Failure Level) area—hinting at smart money involvement or liquidation hunt.
🔁 Reversal Scenarios & Key Levels
There are two possible future paths visualized:
🟥 Scenario 1: Bearish Continuation
Price respects the curved trendline, failing to break resistance.
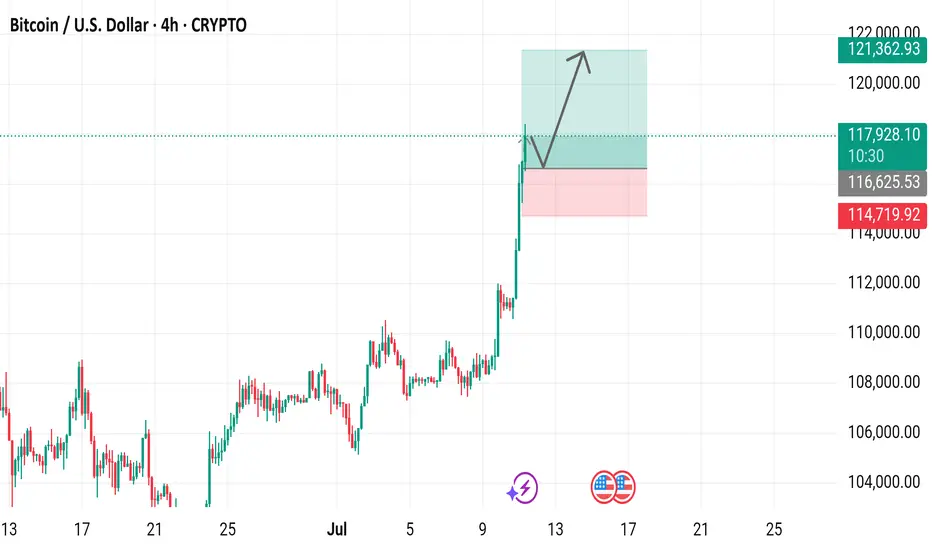
A rejection near the current region (~117.5k) could lead price back toward:
Central Zone Reversal near 115,000 USD
Further into the 100% Reversal Zone (green zone) near 113,500–114,000 USD
Ideal for short entries after clear rejection confirmations.
🟩 Scenario 2: Bullish Breakout
Price breaks and sustains above the curved resistance.
Temporary resistance seen at Minor level (~120,000 USD), followed by Major resistance near 121,000 USD.
This scenario requires bullish volume and reclaim of structure, invalidating the short bias.
🧠 Strategic Viewpoint & Trade Mindset
Market is at a decision point—either confirming a bearish rejection from dynamic resistance or invalidating it for a bullish reversal.
Patience is key; wait for either:
A failed breakout attempt (short opportunity), or
A confirmed breakout and retest (long opportunity).
Use lower timeframes (15m–1h) for execution once direction is confirmed.
BTCUSD.PM trade ideas
BTC #The chart depicts a 15-minute Bitcoin (BTC/USD)The chart depicts a 15-minute Bitcoin (BTC/USD) price action forming a cup and handle pattern, which is generally considered a bullish continuation pattern. The rounded base signifies consolidation, followed by a potential breakout above the $120,250 resistance zone (blue line). A breakout with volume could confirm upside momentum. The shaded grey area below (~$117,000) represents a support zone, crucial for invalidation of the pattern if breached.
thanking you

BTCUSD LOST SHORT-TERM BULLISH POTENTIALBTCUSD LOST SHORT-TERM BULLISH POTENTIAL
Bitcoin has been trading sideways since July 15th within a range of 116,000.00-120,000.00. Indicators show no signs of a new bullish/bearish trend.
How to trade sideways movements or range?
It is better to wait for a price to come close to one of the levels (support or resistance), then open buy/sell order. Or just pace a limit order and wait. Take-profit may be above/below the support/resistance levels with a stop-loss behind these levels (below for the support and above for the resistance).
So, the price decline towards 116,000.00 is expected, where potentially the price may rebound once again.

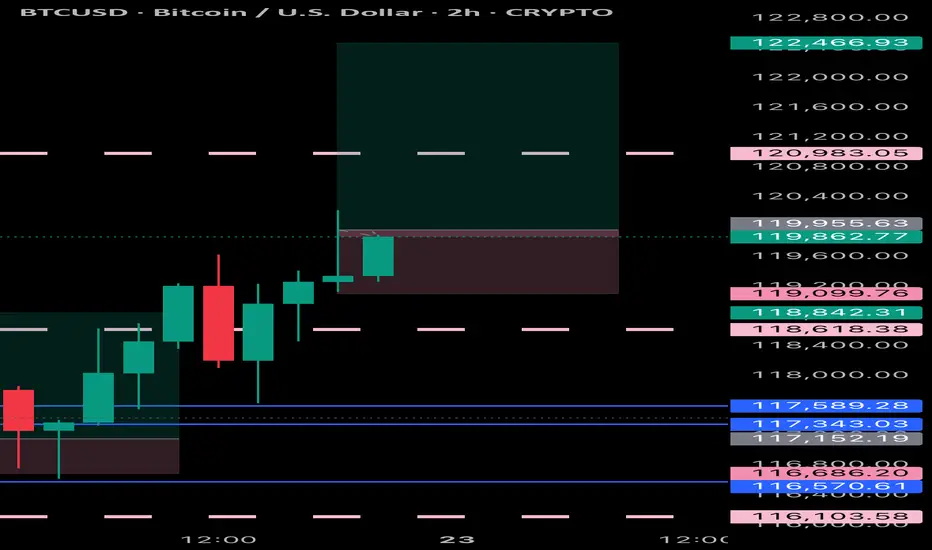
BTCUSD Analysis is Ready BTC/USD 30-min chart shows a potential bounce from the support zone around 116,187.5, aiming for a bullish move toward the target at 121,640.6. Price may retrace before pushing upward.

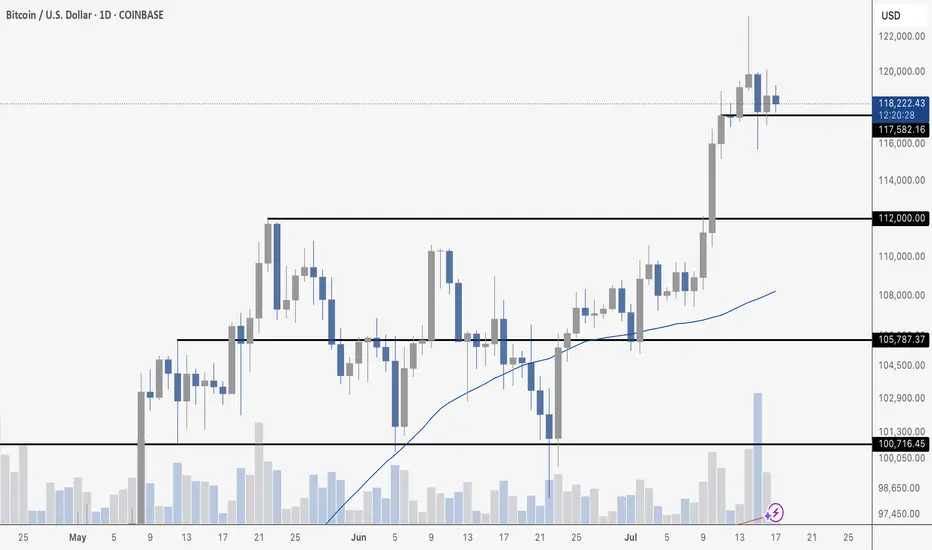
BTC Makes New Daily HighBitcoin is consolidating near its highs, and yesterday’s candle marked the **highest daily close in BTC’s history**, settling just below \$120,000. That’s a major technical milestone and a clear sign of strength in the ongoing trend.
While today’s price action has pulled back slightly – down about 1.19% at the time of writing – BTC remains firmly above the key support zone at \$112,000. This level, once resistance, has now flipped to support after a sharp breakout in mid-July. As long as BTC holds above it, the bullish structure remains intact.
Volume has cooled slightly since the breakout, but the recent candles show healthy consolidation rather than weakness. The 50-day moving average continues to trend upward, currently sitting just above \$108K – offering dynamic support for any deeper retracements.
The next key level to watch is the all-time high wick around **\$123,231**. A breakout above that zone would likely trigger another leg higher, possibly into price discovery. But even without immediate upside, the market appears to be digesting gains in a constructive way.
In short: **highest daily close ever**, bullish structure intact, consolidation healthy. Momentum is cooling, but the setup still favors the bulls.


BTC CONSOLIDATESBitcoin continues to consolidate just below resistance after a strong multi-week rally, currently trading around $118,813. Last week’s candle was notably toppy, with a long wick to the upside that hinted at some exhaustion near the highs. Despite that, this week’s price action has remained relatively firm, suggesting the bulls are still in control for now. The key overhead resistance remains at $123,231 – a level that marked the recent high – and BTC has yet to close above it. Support at $112,000, previously a ceiling during the consolidation in May and June, has now flipped to critical support and must hold to maintain the bullish structure.
Volume has declined modestly since the breakout in early July, a typical sign of consolidation rather than distribution. The 50-week moving average continues to rise and now sits well below price around the $89,000 zone, confirming strong momentum. Still, traders should remain cautious here – failure to break above resistance or a close below $112,000 could lead to a deeper pullback toward the mid-$90K range. Until then, this remains a textbook consolidation just beneath resistance in a larger uptrend, with the potential for a breakout continuation if strength returns.

BTCUSD Technical Analysis | Smart Money Concept (SMC) BreakdownBTCUSD Technical Analysis | Smart Money Concept (SMC) Breakdown
🧠 Smart Money Market Structure Insight
📌 Key Elements Identified:
BOS (Break of Structure): Multiple BOS points indicate bullish intent early on. However, the latest BOS on July 14 followed by a significant drop signals a shift in momentum—possibly a distribution phase.
Liquidity Sweep: Price swept prior equal lows/liquidity before reversing, a typical Smart Money trap setup.
FVG (Fair Value Gap) / Imbalance: Identified around the mid-section of the chart—price filled partially but failed to hold, suggesting internal weakness.
Strong Support Zone (Demand Area): Marked between 115,000 - 114,640; this zone is anticipated to act as a springboard for bullish reversal.
📉 Current Price Action Observation:
BTCUSD is hovering around 118,152 - 118,560, moving sideways with lower highs indicating compression.
Price is projected to form a "W" pattern or double bottom in the shaded region.
Expected liquidity grab beneath 115,902 followed by potential bullish reaction targeting 121,562, as indicated by the white arrow.
🧩 Strategic Outlook & Potential Play:
🔻 Bearish Sweep First:
Market likely to sweep the support one more time, tapping into deeper liquidity pools between 115,000–114,640.
This is aligned with the concept of Smart Money hunting for retail stop-losses before reversing.
🔼 Bullish Recovery After Sweep:
Strong probability of bounce due to presence of:
Fair Value Gap (already tested),
Fresh demand zone,
Liquidity grab setup.
Projected Bullish Target: 121,562
Confirmation Needed: A strong bullish engulfing or BOS on lower timeframes near support.
🏷️ Conclusion:
This BTCUSD setup is a textbook Smart Money scenario: BOS ➝ Liquidity Grab ➝ FVG ➝ Reversal from Demand. Traders should wait for confirmation from the support region before entering long positions.

Bitcoin positive diversion to $131,000Using fibonacci retracements for price targets based off of positive divergences on the 15 min time frame and hourly time frame. I am utilizing 2 ioscilating indicators: RSI length is 36 with smma at 50 and the Chande momentum oscillator with a length of 24. My conservative estimate is $131,000 for a safe trade close. $132,400 exact area for pullback to $128,500?

Btc outlook A simple outlook on Bitcoin
A corrective sell-off to gain some momentum.
The yellow zone is crucial and must hold without being broken.

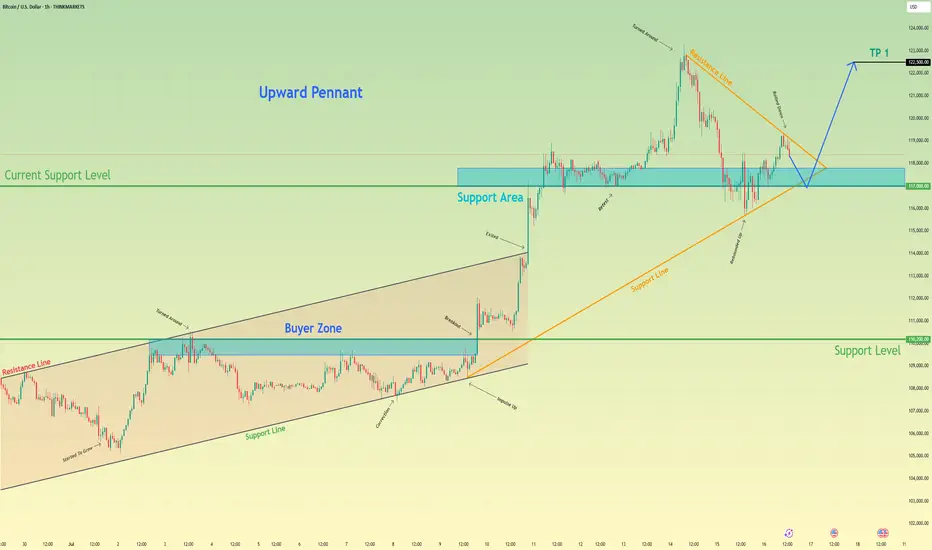
Bitcoin may exit of pennant and then rebound up of support areaHello traders, I want share with you my opinion about Bitcoin. Earlier, the price was moving inside an upward channel, respecting both the resistance and support boundaries. After reaching the buyer zone (110200–109500 points), BTC made a strong impulse up, breaking out of the channel and entering a new phase of growth. This breakout led to the formation of a bullish pennant, which often signals a continuation of the uptrend. Right now, the price is testing the support area between 117000 and 117800, which previously acted as a breakout zone and now serves as a current support level (117000). The structure shows that this level has already worked as a rebound zone multiple times. In my opinion, BTC may continue the correction toward this support area, potentially exiting the pennant to the downside for a short-term pull-back. After that, I expect a new upward movement, targeting the next local high. That’s why I set my TP at 122500 points, which is just below the recent ATH. Given the impulse move, strong support zone, breakout from the channel, and the bullish pennant pattern, I remain bullish and expect BTC to resume its upward trend soon. Please share this idea with your friends and click Boost 🚀
Disclaimer: As part of ThinkMarkets’ Influencer Program, I am sponsored to share and publish their charts in my analysis.
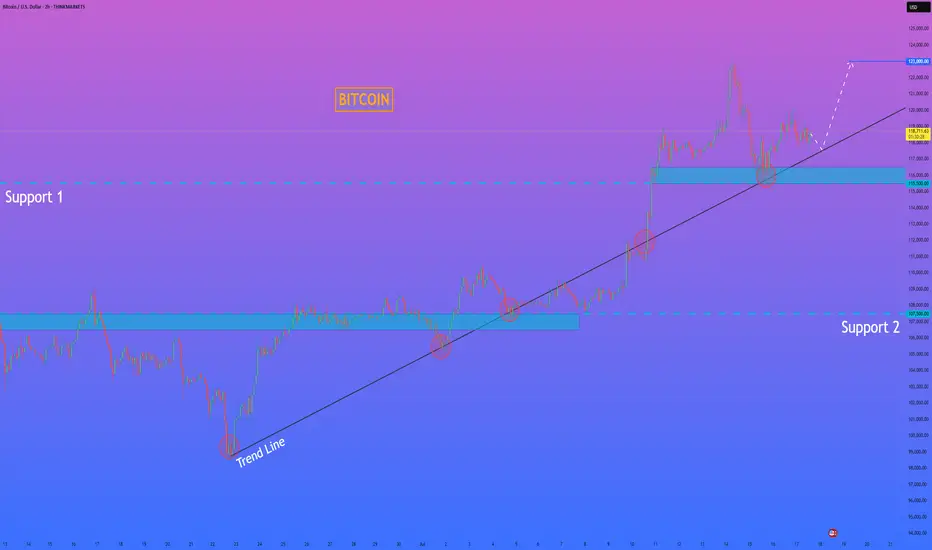
HelenP. I Bitcoin will correct to trend line and then start riseHi folks today I'm prepared for you Bitcoin analytics. The price has been trading in a strong bullish structure, clearly respecting the ascending trend line since the rebound from the 107500 level. Each time the price touched the trend line, it formed a higher low and continued the upward movement. After breaking through the important Support 1 zone (115500–116500), BTC made a strong impulse upward and reached a local high above 122000 points. Currently, the price is making a pullback and moving closer to the trend line again. This area has previously acted as a major point of interest for buyers, and now it's expected to play a key role once more. The support zone and trend line are converging, which makes this level critical for the next move. I believe BTCUSD will bounce from this area and continue its bullish momentum. My goal is set at 123000 points. Given the market structure, higher lows, and strong reaction from the support zones, I remain bullish and expect further growth from current levels. If you like my analytics you may support me with your like/comment ❤️
Disclaimer: As part of ThinkMarkets’ Influencer Program, I am sponsored to share and publish their charts in my analysis.
Bitcoin Ready For Another Leg Higher?Bitcoin currently shows characteristics of bullish consolidation. Following a notable upward move after the election , the price action has entered a phase of sideways trading within a defined range since inauguration.
This period allows the market to digest recent gains and for buyers to accumulate further positions before the next anticipated leg up. Technical indicators, while showing a temporary pause in upward momentum, generally remain supportive of a bullish continuation, with key support levels S1-75k, S2-100k holding firm. The consolidation phase, marked by decreasing volatility, often precedes a strong directional move, suggesting that Bitcoin is coiling for another potential surge.

Do you think I'm joking ???As I said, Bitcoin broke the triangle, and now with a slight price correction, it could surge to $160,000, and you still think I'm joking!!
Previous analysis
Best regards CobraVanguard.💚

BTC #ARC FormationThe chart **15-minute Bitcoin (BTC/USD)** candlestick pattern with a clearly drawn **cup and handle** or **rounded bottom** formation. Let's identify key levels:
---
🔍 **Key Levels Identified:**
1. **Resistance Zone (Neckline of Cup)**
Level:** \~**118,400 USD**
Significance:** This is the upper gray zone where price has repeatedly been rejected. It's acting as a **resistance** and also forms the **neckline of the cup pattern**. A breakout above this level may indicate bullish continuation.
2. **Support Zone (Bottom of Cup)**
Level:** \~**115,800 – 116,000 USD**
Significance:** This is the **lowest point** in the recent pullback and serves as strong support**. The price rebounded from here to form the cup.
3. **Mid-Level / Breakout Point**
Current Price:** \~**118,067 USD**
Significance:** Price is testing the **resistance**. A candle close and confirmation above 118,400 could trigger a bullish move, possibly targeting previous highs near **121,600 USD** or more.
---
⚠️ Watch For:
Breakout confirmation above 118,400 USD** with volume for bullish continuation.
Rejection at 118,400 USD** could lead to a pullback or handle formation.
Support holding above 116,000 USD** is key to maintain bullish structure.
Let me know if you want price targets or entry/exit suggestions based on this setup.
thank u

BTC! BREAK OUT.Initially i was hesitant to call thiss bottom and I will risk my non exsistant repution. That if we break through this resistance and pump a 1-2% break through 4 hour FVG we going ballistic I dont belive in 150k this month I believe in 127-130 k and a trtacement to 113k to fill CME gap. W tradez.

Bitcoin / U.S. Dollar 4-Hour Chart (BTCUSD)4-hour chart displays the recent price movement of Bitcoin (BTC) against the U.S. Dollar (USD) as of July 11, 2025. The current price is $117,979.53, reflecting a 4-hour increase of $1,938.91 (+1.67%). The chart highlights a significant upward trend, with a notable breakout above the $114,719.92 resistance level, reaching up to $121,362.93. Key price levels include support at $116,625.93 and resistance at $121,362.93, with buy and sell options marked at the current price.
BTCUSD - GOOD SUPPORT ESTABLISHED?BTCUSD - GOOD SUPPORT ESTABLISHED?📈
Yesterday, after a record-breaking nine-hour House session, U.S. lawmakers passed three major crypto bills: CLARITY Act (294-134), which establishes a market structure for cryptocurrencies, GENIUS Act (308-122) that supports U.S. stablecoin innovation and an Anti-CBDC Surveillance State Act (219-210) that opposes central bank digital currencies. All of this supports crypto and especially Bitcoin.
Technically, BTCUSD looks bullish also, establishing a new bullish trend. I expect the ATH at 123,190.30 will be rewritten soon. Where will be the next stop, I've got no idea. To my mind, the best strategy here will be to buy on trend support, then transfer the stop loss at your entry point and sell o local hikes.
Stay tuned for the next report! 🔔

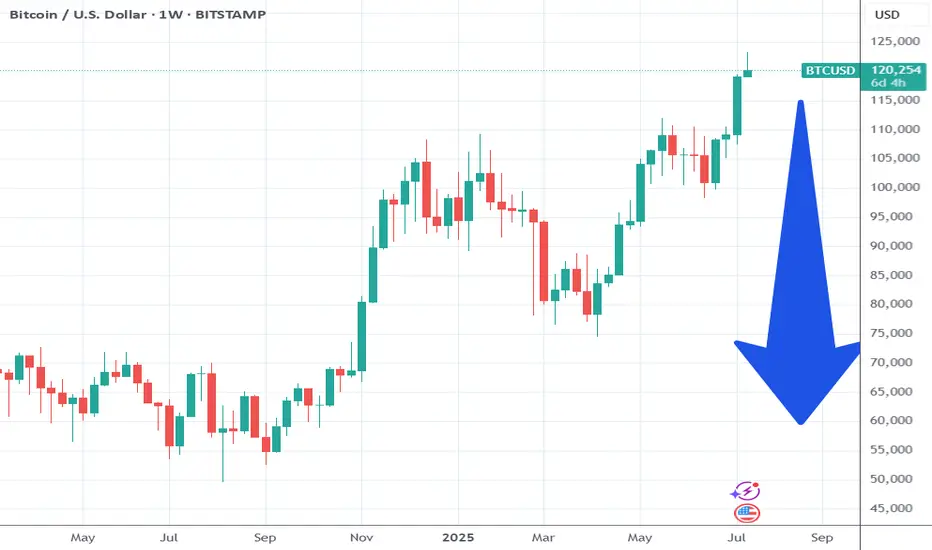
Bitcoin Pump & Dump.. Something Nobody Is Mentioning.A massive Bitcoin correction is coming. This was the peak imo.
Ask yourself this question.... Why did Bitcoin move now?
Simple answer it is a pump into events in a few months and will dump.
They pumped it and promoted the pump mainstream to get newbs to chase at the high.
Now the important part that nobody else is talking about except me!!!!
Look at Bitcoins chart over 15 years. It either drops or runs flat when the FED cuts rates.
What is coming soon? Multiple Fed cuts and a new FED chief. That is why they pumped it now.
Remember Bitcoin is traded against the dollar. When the dollar is cheap Bitcoin falls. When the dollar is expensive Bitcoin moves.
Form 2017 to 2020 the FEDs left rates unchanged and low... Bitcoin traded in the 7k-13k range for those 3- 4 years...
In October 2021... They dropped it hard from 60k to 16k in 2 years (shakeout). Used the Sam Bankman story as the catalyst.. Investors knew rates were going back up in the near term so they got people out.
What happened in 2022 after Covid to justify this 3 year bull run.... FEDS KEPT RAISING RATES AND KEEPING THEM HIGH and here we are at the end of that cycle.
Expecting this to slowly start dropping at this level, for the next year or 2.
HelenP. I Bitcoin will go to a correction after a strong impulseHi folks today I'm prepared for you Bitcoin analytics. If we look at the chart, we can see that the price has recently made a powerful impulse upward, breaking out of a long consolidation range between 110500 and 102500. This range acted as a strong accumulation zone, where the price bounced multiple times from both support levels. After the breakout, Bitcoin gained momentum and pushed sharply toward the 122000 mark. Now, after this sharp rally, I believe a correction is highly probable. Often, after such strong bullish moves, the market tends to pull back to retest the trend line or previous breakout zones. In this case, the trend line has been respected several times and now aligns with the 117500 area, which also acts as local support. That’s why I consider this zone to be a logical target for the correction. I expect BTCUSD can drop from the current highs and retest the trend line near 117500 points - that is my main goal for this setup. If the trend line holds, buyers may return to the market and push price higher again. Given the strong impulse, the breakout from consolidation, and the importance of the trend line, I remain bearish short-term and expect a drop toward 117500 points. If you like my analytics you may support me with your like/comment ❤️
Disclaimer: As part of ThinkMarkets’ Influencer Program, I am sponsored to share and publish their charts in my analysis.

BTC CONSOLIDATESBitcoin is consolidating just below \$120,000 after Tuesday’s sharp pullback – which came on the highest daily volume since the \$74,000 bottom in March – mostly driven by selling. Despite the pressure, price held support cleanly at \$117,582 and continues to range tightly, suggesting healthy consolidation after a strong breakout above \$112,000. As long as \$117,582 holds, the structure remains bullish. A close above \$120,000 could ignite the next leg higher.
Bitcoin – Rising channel with critical support at $119.000!The chart presented shows Bitcoin in a well-defined rising channel, highlighting a strong bullish momentum over recent trading sessions.
Rising channel
The price action is currently oscillating within the boundaries of this upward sloping channel, marked by parallel trendlines. The channel suggests that Bitcoin has been consistently making higher highs and higher lows, with the current price hovering around $121,794. The upper boundary near $123,200 acts as potential resistance, while the lower boundary of the channel provides dynamic support, suggesting a continuation pattern if this structure holds.
Uptrend
The overall uptrend is clearly visible and remains strong, especially since July 10th, where a significant bullish breakout occurred. The breakout was followed by steady gains, with minimal pullbacks, indicating strong buying interest and market confidence. The momentum shows a healthy bullish structure with minimal price overlap, characteristic of a trending market, which favors continuation as long as critical support levels remain intact.
Support area
A critical element in this chart is the key support area, highlighted in green. This support zone is located between approximately $118,500 and $119,600. This zone was previously a resistance level that has now turned into support following the breakout. It also aligns with the mid-level of the rising channel, reinforcing its significance. Should the price retrace, this area is likely to act as a cushion where buyers may step in again to defend the trend.
Fibonacci
Additionally, the chart features a Fibonacci retracement drawn from the swing low to the current swing high. The 0.618 Fibonacci level is particularly noteworthy, sitting at around $119,623. This level is known as the “golden ratio” in technical analysis and often acts as a strong retracement level during corrections. Below it, the 1.0 level is marked at $116,669, which represents a full retracement of the move and a deeper correction scenario if the support fails. These Fibonacci levels coincide with the key support zone, further validating it as an area of high confluence and likely buying interest.
Final thoughts
Overall, the technical structure remains bullish within the rising channel, with key levels of interest lying around $119,600 for support and $123,200 for potential resistance. A successful defense of the support area could propel the price higher toward the channel’s upper bound, while a breakdown may lead to a test of deeper Fibonacci retracement levels.
Disclosure: I am part of Trade Nation's Influencer program and receive a monthly fee for using their TradingView charts in my analysis.
Thanks for your support. If you enjoyed this analysis, make sure to follow me so you don't miss the next one. And if you found it helpful, feel free to drop a like and leave a comment, I’d love to hear your thoughts!
