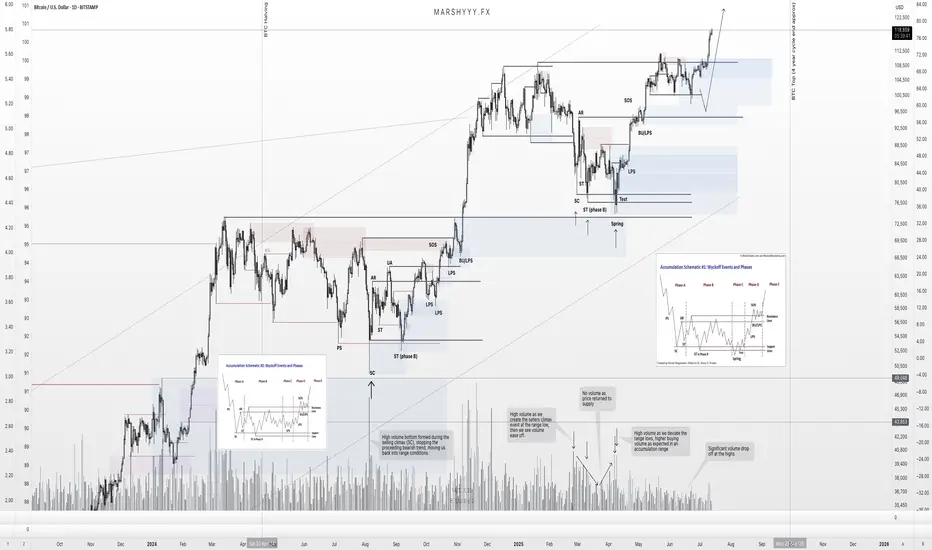
correctionGiven the completion of the current upward trend, the corrective pattern is expected to move along the specified path and go to the specified Fibonacci levels. Then the continuation of the upward trend will be possible.
BTCUSD.PM trade ideas
Retail in?After almost 3 decades as a trader, if there is one thing I have learned over the years, significant highs are made when sentiment is at extremes. Whether it is "mom and pop" or the "shoeshine guy" calling the top, it's when the buying (or selling) by retail is at a fever pitch. These days, you can't find a bear in Bitcoin, and the days on end of reports preaching "record inflows" is almost deafening.
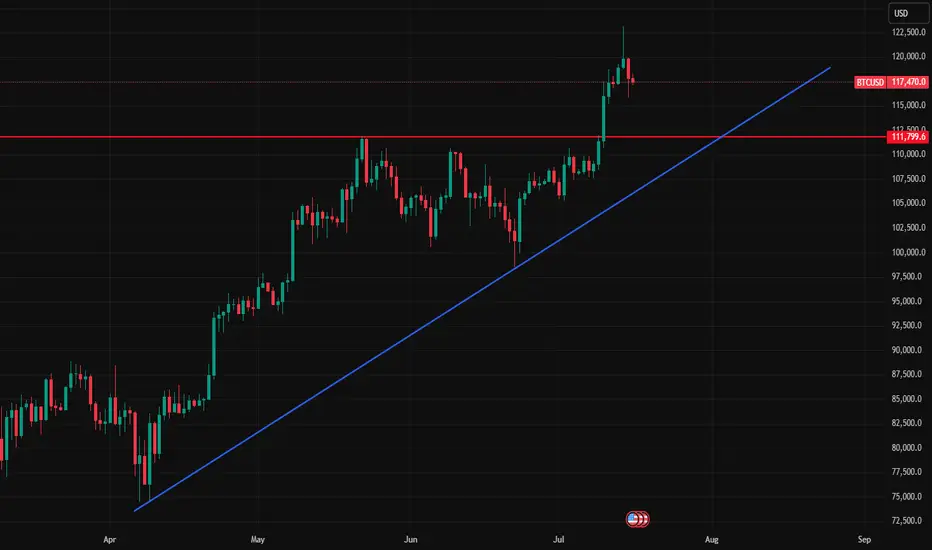
Technically, Bitcoin is probing some key resistance today. It's stalled by the 161% Fibonacci extension of the recent early May highs to June lows. More importantly is the 127% extension of the January highs to April lows. RSI is very divergent as price hits new highs. And with sentiment at near extremes, bulls should be careful now. And a break back below the 112k level would be a very bearish "topping pattern" event.
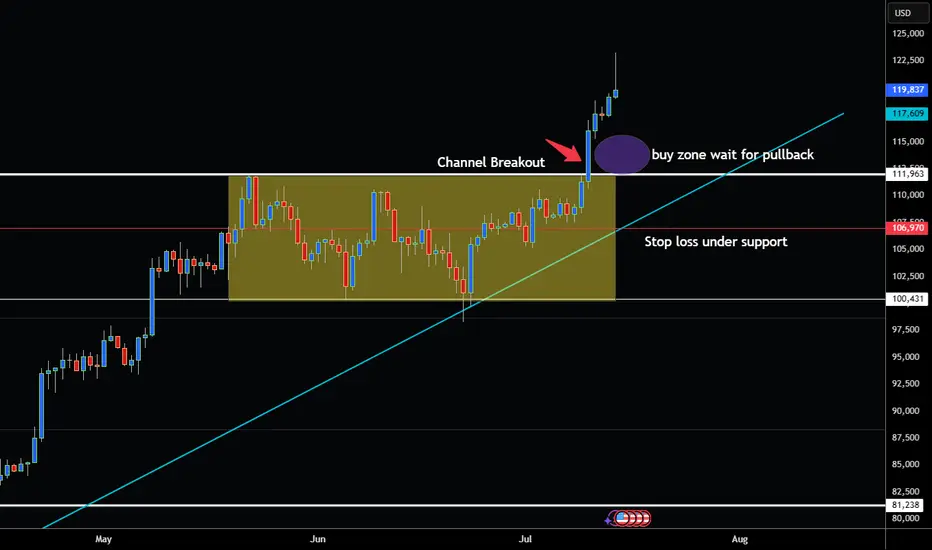
BITCOIN BREAKS OUT OF CHANNEL AND NOW AT ALL TIME HIGHS!Hey Traders wow just a few week ago I was watching to see if it was going to pullback instead smashes above all time high. Thats how quick these markets can change in the blink of an eye!
Lesson here (Always Expect the Unexpected in the Markets!) 😁
Ok so now we have channel breakout above resistance at 112,100. About 70% of the time market will retest this level before continuing the trend.
This could be a great place to buy on the pullback!
So if your bullish buy around $112,100-113,000 I would recommend a wide stop to give the market room to breath around 106,970.
However if bearish I would not consider selling unless market has complete reversal and has daily close below uptrendline at 106,000 .
Bears Be careful because this Bull looks like it has Horns!
Good Luck & Always use Risk Management!
(Just in we are wrong in our analysis most experts recommend never to risk more than 2% of your account equity on any given trade.)
Hope This Helps Your Trading 😃
Clifford
What Btc actually wants to sayThis trend line on daily chart shows sustain growth in BTC and it is rising day by day, Pure bullish in long run.
Bitcoin Backtest and continuation to $135000See trendline and respecting the support, looking for continuation up this week
Bitcoin breaking out - 150k likely, possibly soon- complimentary analysis to the USDT D. one since they trade opposite of each other:
- 5D volatility is extremely low
- 150k is a mid-term target, it is likely Bitcoin reaches +200k before this bull market cycle is over

BTC: Buy idea: Bearish ChannelOn BTC we are in a bearish channel situation with a succession of numerous red candles. In such circumstances, we would have a high probability of seeing the market go up. This rise will be impressive if the resistance line is broken forcefully by a large green candle and followed by a large green volume. Good luck everyone!!!

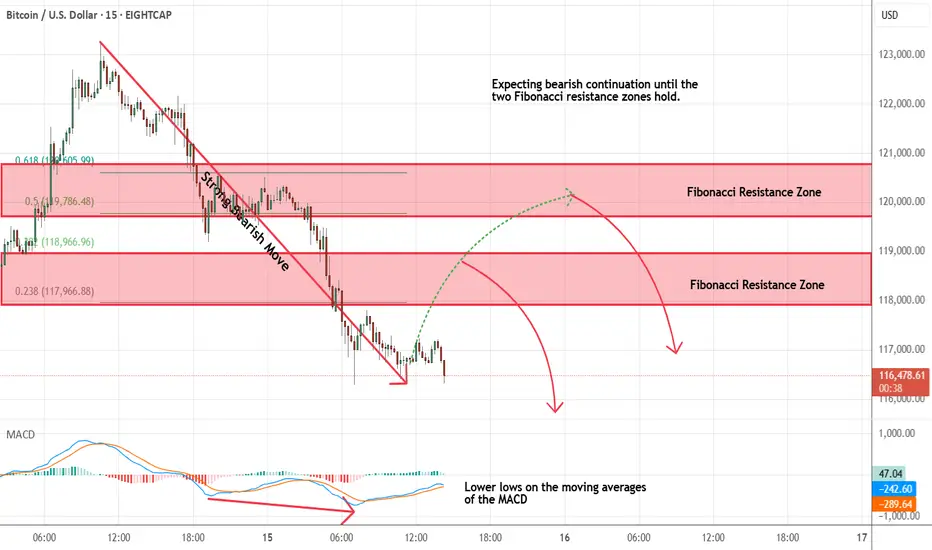
Bitcoin - Looking To Sell Pullbacks In The Short TermM15 - Strong bearish move.
Lower lows on the moving averages of the MACD.
No opposite signs.
Currently it looks like a pullback is happening.
Expecting bearish continuation until the two Fibonacci resistance zones hold.
If you enjoy this idea, don’t forget to LIKE 👍, FOLLOW ✅, SHARE 🙌, and COMMENT ✍! Drop your thoughts and charts below to keep the discussion going. Your support helps keep this content free and reach more people! 🚀
--------------------------------------------------------------------------------------------------------------------
Bitcoin Blow-Off Top?Bitcoin’s daily chart is flashing caution after a sharp reversal candle on Monday was followed by downside continuation today. Yesterday’s session printed an unmistakably ugly candle – a long upper wick signaling rejection at the highs near $120K, with a close well off the top of the range. Crucially, that candle came on elevated volume, adding weight to the move and suggesting a possible blow-off top in the short term.
Today’s follow-through confirms that sellers are taking the reins, at least for now. Price is currently sitting around $116,800 after dropping over 2.5%, with the next major support zone near $112,000 – a level that previously capped price throughout early June before the breakout. If that fails, the 50-day MA and horizontal support around $105,800 should act as the next line of defense.
Volume has remained elevated, showing that this pullback has real participation – not just apathy or a lack of buyers. Bulls need to see price stabilize above $112K and reclaim lost ground quickly, or risk a deeper retrace after such an aggressive upside move.
For now, momentum has clearly stalled, and the risk of a more meaningful correction is on the table.

Rally! : My Target in Sight, and It’s Only a Matter of TimeInverted Head&Shouldres -- Breakout -- Double top -- Retest Neckline -- BOOM !!

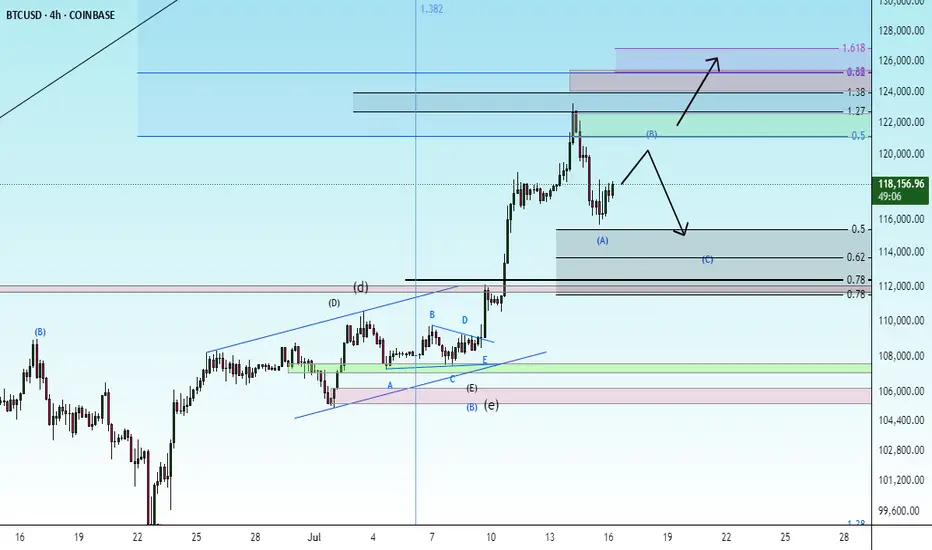
Are you falling for 141k?The bull run on BTCUSD was not sudden, it corrected properly making a flat from 98K and breaking out the structure. this upward impulse looks too sharp to peirce 120-122k range its 1.618 fib extension of the broken structure.
Be cautious with the sell though, any rejection followed by a bear flag could be a great short with Stop above the top.
Good luck.
BTC/USD Technical Analysis — Educational BreakdownBTC/USD Technical Analysis — Educational Breakdown (July 13, 2025)
🔍 Market Context
Bitcoin (BTC/USD) is currently trading around $117,913, exhibiting a clear reaction from a well-defined resistance zone between $118,439 and $119,000. This resistance aligns with a previously unfilled 4H Bullish Fair Value Gap (FVG) — a price inefficiency left behind during a strong bullish move — which has now been filled, triggering a pause and reaction in bullish momentum.
🧠 Key Concepts Explained
📘 1. Fair Value Gap (FVG)
In Institutional Price Delivery models (often used in Smart Money Concepts), a Fair Value Gap represents an imbalance in price action — usually between the wicks of candles where price moved too quickly, leaving inefficient trading zones. Price often retraces to these areas before resuming its direction. Here, BTC has filled the 4H Bullish FVG, which acts as a magnet for price and a potential reversal point once filled.
📘 2. Liquidity Sweep
The chart highlights a Sell-Side Liquidity Sweep — this occurs when price dips below a key short-term low or consolidation range to trigger stop-losses and collect liquidity before making its next move. This move is typically engineered by larger market participants to capture orders before deciding on true directional intent.
📘 3. Resistance and Support
Resistance ($118,439 – $119,000): This area is acting as a supply zone where sellers are stepping in after price filled the FVG.
Support ($115,580): This level has previously provided demand and also holds liquidity (stop-losses from long positions), making it a probable target if bearish pressure follows through.
📈 Potential Trade Insight (Educational)
⚠️ This is not financial advice but an educational scenario based on the current technical setup.
Bearish Setup: If price rejects from resistance and forms a lower high, a short entry targeting the support zone at $115,580 could be considered, using a stop above $119,000.
Bullish Invalidator: A break and hold above $119,000 would suggest bullish continuation, potentially targeting higher time frame imbalances or resistance.
📚 Summary & Takeaway for Learners
This chart presents an excellent case study in understanding how institutional concepts like FVGs, liquidity sweeps, and key supply/demand zones interact in real price action. Traders can learn the following from this setup:
Price doesn’t move randomly — it often targets liquidity and imbalances.
Patience is key — waiting for confirmation at known reaction zones can improve trade accuracy.
Market context matters — a filled FVG at resistance combined with a liquidity sweep gives confluence to a bearish outlook.

BTC CUP and HANDLE?BTC made triple top not it is making cup and handle pattern. If it successfully brakes the handle it might reach to 120-122K

Bitcoin: Support at $112K Holds Key to Bullish ContinuationFenzoFx—Bitcoin is bullish, trading above $112,000.0 after forming a new all-time high at $123,231.0. The current dip may offer a strong reentry if $112,000.0 holds as support, aligning with a bullish fair value gap.
Price remains above the ascending trendline, reinforcing the bullish outlook. If momentum continues and BTC breaks past $123,231.0, the next target could be $130,000.0.
A fall below the trendline would invalidate the bullish setup.

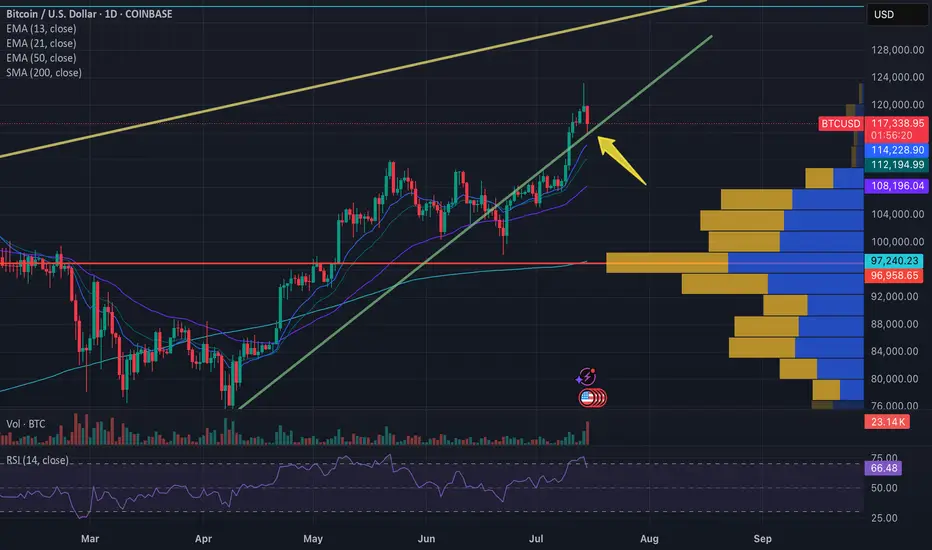
Bitcoin Hits First Target: What I Traded and What Comes NextBitcoin just hit my first target. I went long on BTC, XRP, Chainlink, and more. Booked profits and jumped into two new breakouts with better risk-reward. In this video, I break down my trades, the setup, and why I’m still bullish between 116K and 120K. I also explain how crypto deregulation and the Genius Act could fuel the next move.
Let me know in the comments how you traded this breakout.
This content is not directed to residents of the EU or UK. Any opinions, news, research, analyses, prices or other information contained on this website is provided as general market commentary and does not constitute investment advice. ThinkMarkets will not accept liability for any loss or damage including, without limitation, to any loss of profit which may arise directly or indirectly from use of or reliance on such information.

BTC Rebounds From Channel Support With Critical Levels In Focus BTC Rebounds From Channel Support With Critical Levels In Focus 🟢📉
Structure remains firmly bullish, and price action is still unfolding within our previous analysis. After the breakout above the yellow trendline, BTC has entered a new ascending channel, and we’re now testing the lower boundary of this rising structure.
The main support sits at 114,921, the level from which the breakout occurred—an essential zone that may or may not be revisited. Based on market behavior and momentum, I currently do not expect this level to be retested, but it's one that must always be respected.
🟩 A deeper correction could lead us toward the previous ascending channel support near 112,400. This would be the last resort for bulls to hold structure intact.
⚠️ A break below 112K changes the narrative completely. That would mean we’re stepping into a potential trend reversal zone—so the market could be setting up for something more significant if that unfolds.
That said, my expectation leans toward a rebound from current levels. The sell-off may have flushed out late long entries, creating space for renewed bullish momentum. Let’s follow the levels and trade what we see—not what we feel.
One Love,
The FXPROFESSOR 💙
Disclosure: I am happy to be part of the Trade Nation's Influencer program and receive a monthly fee for using their TradingView charts in my analysis. Awesome broker, where the trader really comes first! 🌟🤝📈

Next stop 125 can we go to 145 k?This channel is not providing individualized trading or investment advice, nor is it a banking service, brokerage service, trading service, investment service or money management service

BTC BULLISH FLAG AND POLE PATTERN 135,000$ TARGETAs seen in the charts, BTC is currently forming a flag and pole pattern.
Expect price to cover one last liquidity sweep before pumping to the 135-140k price range.
ESH.

ROS #Repeat of structureROS #Repeat of structure
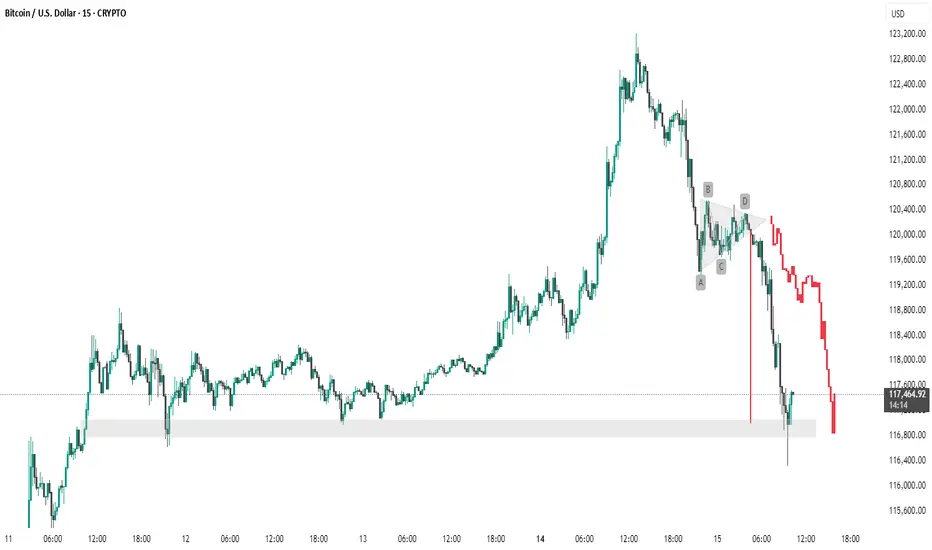
The chart you've provided is a 15-minute candlestick chart of **Bitcoin (BTC) / USD**, showing a recent price action pattern followed by a significant drop. Here are the **key points** identified on the chart:
**Key Support Zone**
* Highlighted in **light gray** at the bottom.
* Range: **\~116,800 to \~117,500 USD**
* This zone has acted as **support multiple times** (seen around July 11–12 and now again on July 15).
* Price **bounced** off this area during the most recent dip, but the current candle is testing it again.
---
**Chart Pattern: Bearish Triangle (ABCD Structure)**
Marked by the labels **A, B, C, D**, forming a **descending triangle**, typically a **bearish continuation pattern**:
* **A to B:** Sharp drop (initial leg down).
* **B to C:** Rebound, but fails to reclaim highs.
* **C to D:** Tightening price action inside the triangle.
* After **D**, there’s a **breakdown**, leading to heavy selling.
---
**Breakdown and Sharp Decline**
* Price **breaks below the triangle support** with a long red candle.
* Massive sell-off continues, pushing BTC below **\$118,000**.
* The current price is around **\$117,481**, hovering near the key support zone.
---
**Trend Observation**
* Before the triangle, there was a **strong uptrend** leading up to \~\$123,000.
* The triangle acted as a **distribution zone** before the **reversal** began.
* The trend has shifted from **bullish** to **bearish** post-pattern.
---
🔍 Summary of Key Levels:
| Level Type | Price Range |
| ---------------- | ------------------- |
| Resistance (Top) | \~\$123,000 |
| Breakdown Point | \~\$120,400 |
| Support Zone | \~\$116,800–117,500 |
thanking u
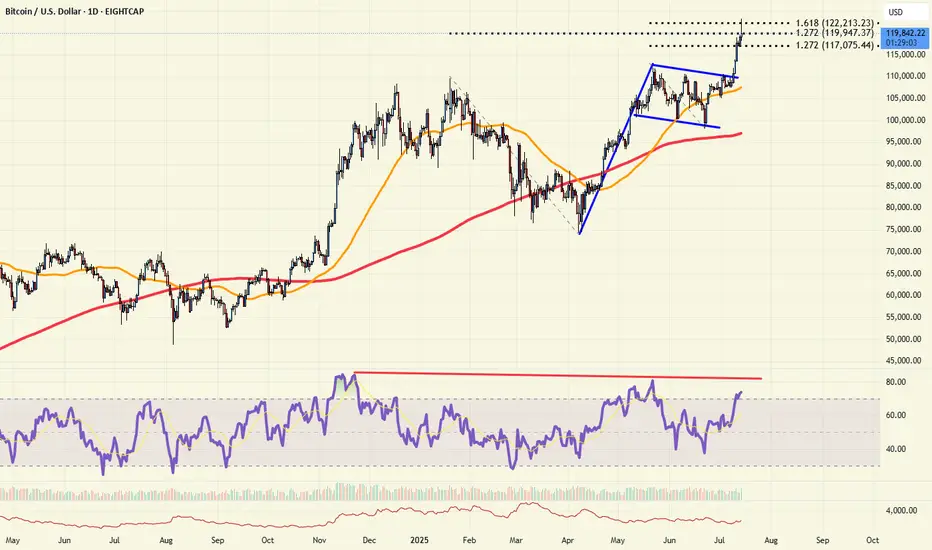
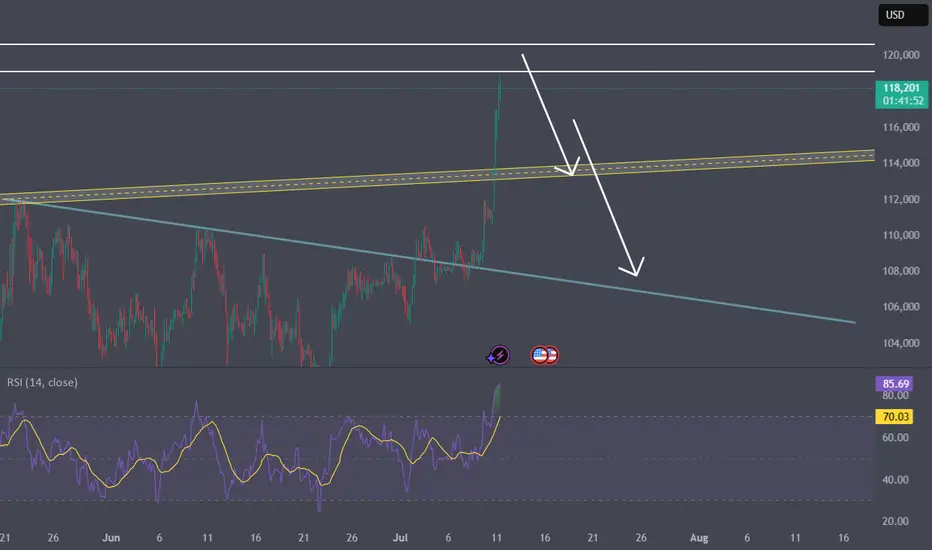
Divergence on all 3 RSI VOLUME AND TTMWe might have a large pullback if the weekly closes below the 1.272 Fib and there's a divergence on RSI VOLUME AND TTM I'm saying might nothing is 100% good luck to everyone I hope we all eat good
Valtrix Group: Crypto Today – Bitcoin Explodes Toward $120,000The global cryptocurrency market continues to surprise: Bitcoin is confidently approaching the $120,000 mark, reinforcing the role of digital assets as an integral part of the global financial system.
Record Growth: What’s Behind Bitcoin’s New Surge?
Amid rising institutional interest, growing retail demand, and expectations of interest rate cuts in the U.S., Bitcoin is demonstrating impressive growth. Over the past few weeks alone, the cryptocurrency has surged by more than 20%, and Valtrix Group analysts believe the psychological threshold of $120,000 could be crossed in the near future.
Key drivers of this growth include:
Active institutional buying, including investment funds and major banks;
Reduced Bitcoin supply following this year’s halving;
Stabilizing regulatory environment in regions like the U.S., Europe, and Southeast Asia;
A shift by traditional investors into digital assets amid geopolitical instability and inflationary concerns.
How Is the Market Reacting?
Altcoins are also experiencing significant growth, following the market leader. Ethereum has surpassed $7,000, while tokens such as Solana and Avalanche have jumped more than 30% in a week.
Investors are increasing trading volumes and locking in profits, but interest in long-term HODL strategies is also on the rise. According to Valtrix Group, this is not just a short-term speculative wave, but a sustainable trend backed by strong fundamentals.
What’s Next? Forecast from Valtrix Group
Our analysts believe that Bitcoin could reach $125,000–$130,000 in the short term if the current momentum continues. However, we advise investors to proceed with caution: high volatility remains a defining feature of the crypto market.
Valtrix Group recommends:
Diversifying portfolios to include digital assets;
Applying risk management strategies;
Monitoring news cycles and macroeconomic indicators.
Valtrix Group continues to closely monitor market developments, providing clients with up-to-date analytics, investment guidance, and digital finance support.

₿itcoin: Pushing Higher—But Watch for a Reversal AheadAfter taking a brief pause over the weekend, Bitcoin resumed its upward momentum early this morning, trading within the blue Target Zone between $117,553 and $130,891. This marks the first time the cryptocurrency giant has traded above the key $120,000 level. Within this zone, and in line with our primary scenario, we continue to anticipate the peak of the corrective wave B rally, followed by a trend reversal to the downside. We expect a significant wave C decline, targeting the lower blue zone between $62,395 and $51,323. As such, prices in the upper blue Target Zone may present an opportunity to take (partial) profits on existing long positions and, where appropriate, to initiate potential short positions as a hedge. These shorts could be protected with a stop 1% above the upper boundary of the zone, given there remains a 35% probability that Bitcoin could break directly above the $130,891 resistance and set a new high as blue wave alt.(i).
📈 Over 190 precise analyses, clear entry points, and defined Target Zones - that's what we do.

BTC – Textbook Pullback. New ATHs. What’s Next?Back in mid-June, I published a BTC update calling for a local correction into HTF demand while most were screaming bear market and waiting for deeper breakdowns.
Price action played out exactly as forecasted.
BTC swept the $100k swing low, front-ran my first demand zone by $400, and launched into a powerful reversal — just like it did back in April, where it also front-ran the key HTF demand before rallying.
That move took us straight into new all-time highs (ATHs) — now trading comfortably around $118k.
🧠 What Happened?
✅ Liquidity sweep of the prior low
✅ Front-run demand zone (perfect HTF structure)
✅ Strong bullish reaction and higher high
✅ Confluence from USDT.D rejection at 5.25%
✅ Alts showing signs of strength as BTC rallies
The entire setup aligned perfectly across BTC, USDT.D, TOTAL, and OTHERS.D — all of which I’ve been tracking in tandem.
🔮 What Now?
With BTC now in price discovery, I expect continuation higher — but not without the possibility of a short-term pullback.
📉 A potential retest of the $108k zone isn’t off the table. This level aligns with:
- Prior breakout structure
- Range high retest
- Local demand before continuation
But even if we go straight up — I remain HTF bullish into the final phase of this cycle, supported by:
- USDT.D structure still bearish
- BTC.D showing signs of distribution
- ETH.D and OTHERS.D gaining momentum
- Altseason rotation already starting to pick up
🧭 The Macro Outlook
The 4-year cycle projection still points to a Q3 2025 top — likely between August late and September based on historical cycle timing, but this could deviate.
That gives us a window of 2–3 months for this final leg to unfold — and it’s already in motion.
Stay focused. Stick to your plan. Ride the trend, don’t chase it.
Let me know what levels you're watching next, and whether you think we get that $108k retest — or we go vertical from here.
1D:
3D:
4D:
1W:
1M:
— Marshy 🔥