BTCUSD.PM trade ideas

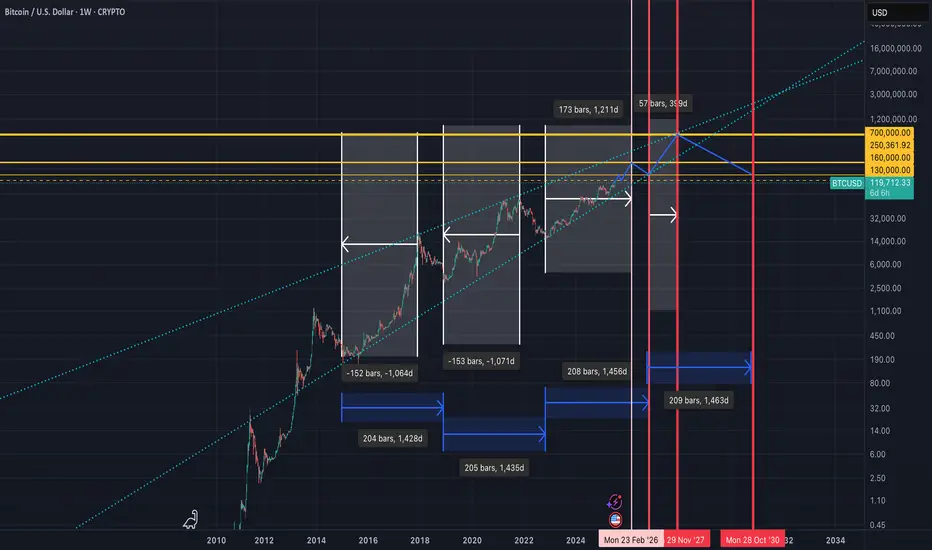
What if Analysis for BitcoinNormal Cycles are dead!! According to extended measurements, elliot waves, fib retracements, trend analysis, cyclic lines and QE timeframes, we might see a different play this time, which will leave everyone sidelined i.e Max Pain. We saw for the first time a Bitcoin bull run while we are in a Quantitative Environment. This means that BTC from now on works as a risk off asset. So, imagine we have a local top on September 2025, where the normal cycle ends around 160k then a quick drop at 130k where everyone thinks the bear market is here and after that quick pump on 250k. Then 9 months bear market (usually 12 months) but now shorter cause we have an extended short term cycle for bull run and after that we hit on 2027 directly 700k USD, where we find the huge bear market which will last longer than usual leading to 100k usd on 2030. The target of 700k usd alligns perfectly with fib levels, trend resistances Larry Fink prediction of BTC going to 700k and lastly and most important due to the published data of FED of wanting to revalue gold to buy 1 million btc in the next years. If we multiply gold's price around 3400k per ounce, multiply USA gold reserves (which is in tons, so we have to convert ounces to tons) and then divide that number with 1,000,000 BTC, guess the price--> yes correctly 700k per BTC!!!!!!!!! Let's go boyz!
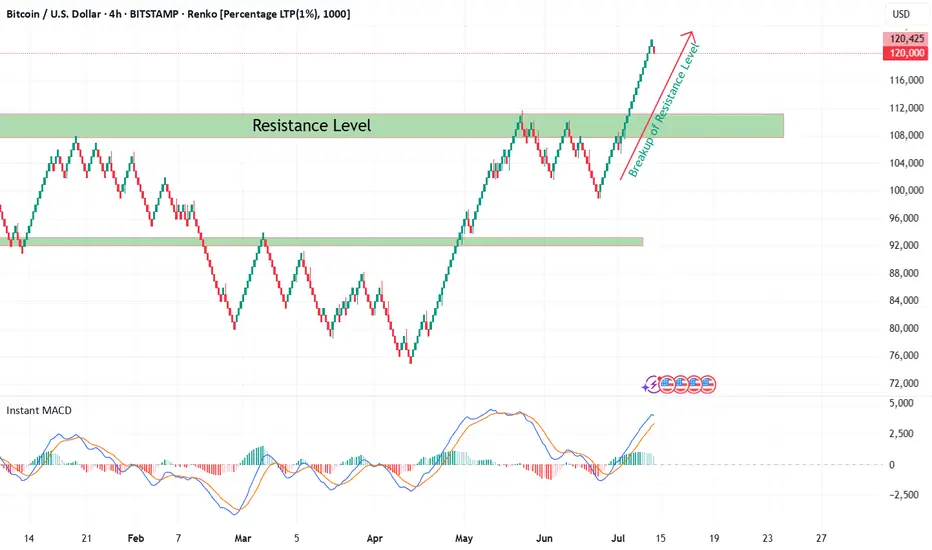
Bitcoin Renko Breakout Confirmation with CryptoQuant NetflowFrom late 2024 till now, Bitcoin (BTC/USD) was consolidating within a broad sideways range between well-defined support and resistance levels on the 4H Renko chart. During this time, market indecision was obvious as neither bulls nor bears could establish dominance.
Recently, BTC has decisively broken out above the major resistance zone at ~$108,000 — as seen with my custom Renko + Decision Tree + S/R Channel script ( ). This breakout above resistance technically suggests the end of range-bound price action and the potential start of a new bullish trend, especially when confirmed by on-chain data.
On-Chain Netflow Confirmation
As I originally highlighted in my CryptoQuant Netflow analysis (published under the username ‘cryptoonchain’ on CryptoQuant platform):
Total Exchange Netflow for Bitcoin has recently dropped to its lowest level since February 16, 2023 — at which point the last bullish cycle began.
Negative Netflow means more BTC is being withdrawn from exchanges than deposited, indicating reduced selling pressure and strong holder conviction.
Binance-specific Netflow also confirms massive outflows, a sign whales and large traders are accumulating and withdrawing funds from trading venues.
Historically, this combination — a technical breakout (Renko) and deep negative on-chain netflow (dataset: CryptoQuant) — has preceded major bull runs.
Summary
Based on both my Renko model and current on-chain flows:
The breakout above 108,000 resistance marks the start of a likely new uptrend for BTC (now 119,000).
On-chain data via CryptoQuant strongly supports the bullish scenario.
Invalidation
If BTC returns below $108,000 and consolidates there, this bullish outlook is invalidated and a reassessment is required.
symmetrical triangle in progressBitcoin has been consolidating at this level for several weeks, easing some of the pressure in order to push above 120K. As of today, we have a clear formation—a large symmetrical triangle—which confirms the continuation of the upward trend and rules out any possibility of returning to lower levels.

BTC/USDT HIDDEN PATTERN! SM, FIB AND MORE COMFIRMED!Price Resilience Amid Geopolitical Stress
Bitcoin demonstrated remarkable strength during the Israel-Iran conflict, briefly dipping to ~$98K but swiftly rebounding above $105K. This aligns with historical patterns where BTC initially sells off on geopolitical shocks but recovers aggressively within weeks, outperforming gold and equities by 15-60% post-crisis. There is a $96K-$94K "footprint" that coincided with institutional accumulation, evidenced by $1.37B in spot ETF inflows during the conflict week, led by BlackRock's IBIT ($240M single-day inflow) according to official information. This institutional backstop and many others might single-handedly prevented a deeper correction for now, remember that smart money psychology is to create cause out of thin air and buy during selling and indecisive times.
Critical Levels to Watch
Immediate Support: $108k area is vital. A sustained hold here maintains short-term bullish momentum. The 50-day SMA near $102.8K (tested during June 13 conflict sell-off) remains a macro support floor.
Resistance & Targets: The $112K ATH is the near-term ceiling. Breaking this requires stronger spot demand—currently, net exchange inflows are negative, indicating weak retail participation or traders that are backing off for now.There's a $120K target (0.618 Fib) aligned with Standard Chartered’s $150K year-end model if ETF inflows persist.
Risk Zones: A close below $108.3K risks a slide to $105K. Failure here opens path to $96K and a further break of this 92k to 96k zone could lead directly to 70k area or even lower if economical and social activities are not favorable in the near to medium future.Dominance above 55% (currently 65%) delays alt season, but a break below 60% could ignite alts in a positive way.
Macro Catalysts & Market Sentiment
Policy Tailwinds: Trump’s "One Big Beautiful Bill" (proposing $5T debt ceiling hike and U.S. strategic BTC reserves) could weaken the USD, boosting BTC’s "digital gold" narrative. DXY’s -9% YTD drop already correlates with BTC’s 54% post-election rally.
Fed Influence: Pressure to cut rates (amid cooling employment data) may accelerate institutional rotation into BTC. ETF inflows hit $2.75B in late June, signaling renewed institutional FOMO.
Geopolitical Cooling: Iran-Israel ceasefire talks reduced immediate panic, but residual volatility risk remains. Traders note BTC often rallies 20-40% within 60 days of conflict events.
Structural Challenges
Liquidity Fragility: Whale moves (for example: 10K BTC sell orders) now impact prices more due to ETF-driven liquidity concentration. Recent $98K flash crash exemplified this.
Regulatory Overhang: MiCA compliance costs in the EU and U.S. security-reclassification proposals could pressure smaller tokens, though BTC’s status appears secure 28.
Seasonal Slump: July historically sees 6.1% of annual crypto volume—low volatility may delay breakouts until August 4.
Strategic Outlook
A July breakout above $112K could ignite the next leg to $120K, but a retest of $107K-$105K is likely first. Altcoins remain subdued until BTC dominance breaks <55%—select projects with institutional backing (for example, ETF candidates) or real-world utility for asymmetric opportunities.
Conclusion: BTC’s resilience amid chaos confirms its institutional maturity. Trade the $108.3K-$112K range aggressively, with a break above ATH targeting $120K by September. Always hedge tail risks (escalations, regulatory shocks) in this volatility-rich asset class. While this great surge in institutional inflow is good for BTC it also indicates a reduction or slower pace of other crypto currencies.
This is my analysis for BTC, let me know what you think and I hope you like it!

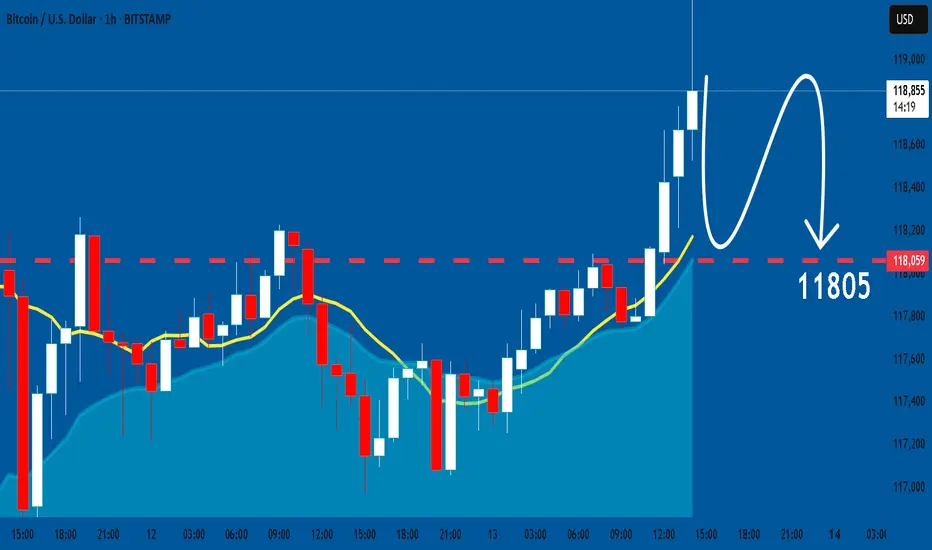
Bitcoin hits second target MacroBitcoin just hits second target, Volume is getting smaller, could indicate that buyers are weakening. We should keep an eye, maybe a corection is soon to be seen.
BTC Massive SetupConsolidation for months between 91k and 106k
- Classic Wyckoff setup as an accumulation/distribution
- Price targets of: 121.878 (122k is the popular target) to the upside with 75,827 on the down
- Saylor today put out news to be raising another $2 billion to buy BTC. Either he is going to be able to hold the floor or get washed out
- Trade can be taken with confirmation of breakout on either side pretty easily as momentum will be so strong that being on the wrong side will most likely be an immediate stop out

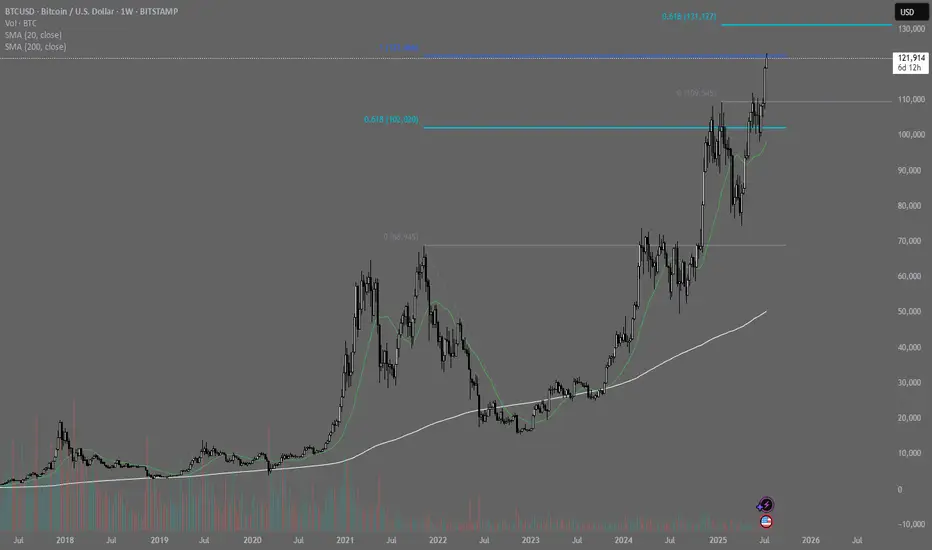
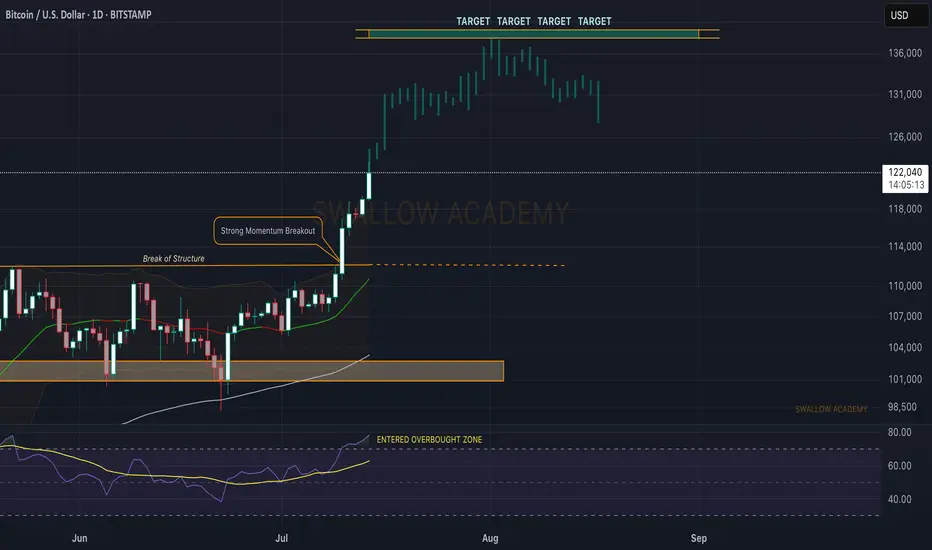
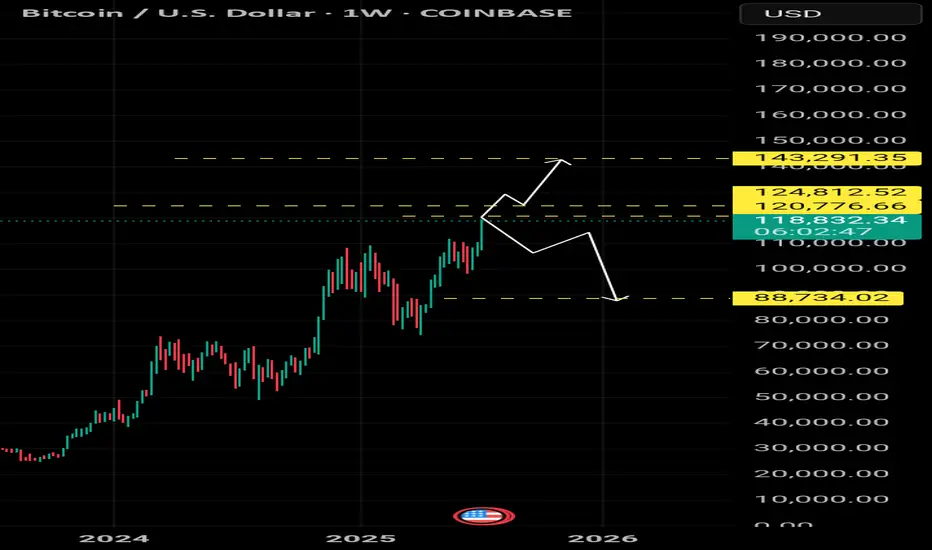
Bitcoin (BTC): Targeting $140K | Our ATH for This Bullish Cycle$120K was broken too easily, and we are now setting our new ATH to $140K, which will be our last target and local top before entering into a bearish market.
Now, as we recently had a strong break of structure that was not retested properly (meaning buyers have not secured this area), combined with the RSI being in the overbought zone, we might see some pullback happening anytime from here so keep an eye out for it.
About RSI, our yellow line is still in the neutral area, and we see the demand and buyside volume growing, so we are going to look for that line to also enter into overbought zones before looking for potential selloffs.
Swallow Academy
Bitcoin Update – Textbook Patterns Playing OutIn last week’s Bitcoin idea, I highlighted a key technical setup: price retested the neckline of a massive inverted Head & Shoulders pattern and launched a strong move upward. Let’s dive into what’s unfolding on the daily chart.
We’re seeing classic Wyckoff consolidation behavior—appearing right before the breakout and again after the neckline retest. Multiple smaller Head & Shoulders patterns have also formed and hit their targets cleanly.
The Volunacci pattern came alive after a precise bounce from the Golden Zone, adding more fuel to the bullish narrative.
Next major level in focus: $120K. Will Bitcoin reach it? Let the market decide.

TARGET FOR BTC BUYERS OR LONGERSHELLO.
this is my targets for my btc buy in spot and my longs
hope you will find this helpfull
in the ATH we can only trade based on the fibo extentions
tell me if u need me to clear it more
thank you.

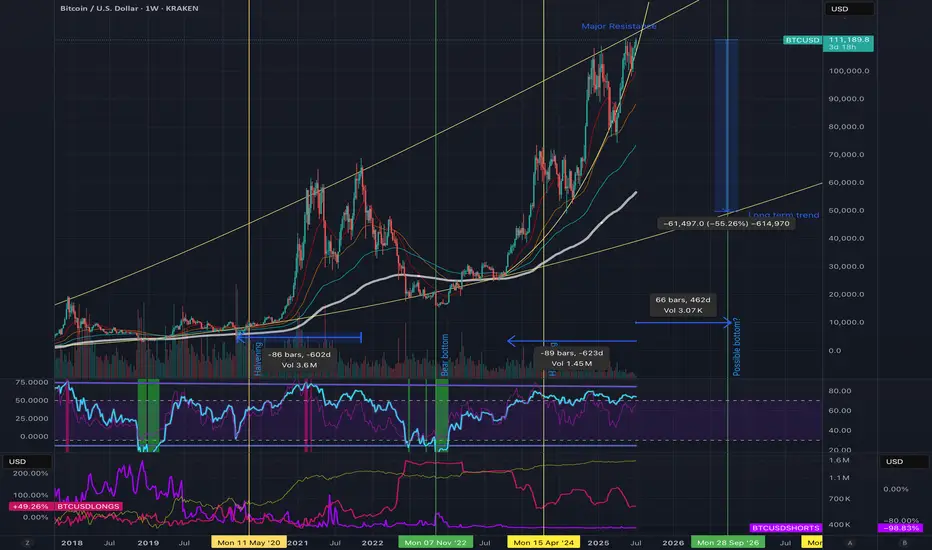
End in sight, Bull run near complete, don't be fooled. Bitcoin has experienced an incredible surge, rising from $15,000 to over $111,000 in this bull cycle so far. I expect the market peak to be around $114,000 to $115,000, with historical trends indicating strong resistance at these levels. As a long-term Bitcoin bull who has navigated through multiple cycles, I see several indicators suggesting we might be nearing a market top.
Firstly, this bull run has lasted 623 days, with only 462 days remaining until the predicted next cycle bottom. This could lead to a significant correction in the short term, potentially dropping prices by at least 50% down to below $40,000. Additionally, trading volume is declining; although exchange volume is decreasing, the number of trades per day is also dwindling. This means there’s less buying and selling pressure in the market. If this trend shifts to more selling pressure amidst such low volume, we could see a rapid decline. This scenario seems to align with what market whales may be anticipating.
MicroStrategy (MSTR) is certainly supporting the market, along with new institutional investors. However, we have yet to fully assess the impact of tariffs and other economic factors, which could result in fewer people willing to invest, especially in high-risk markets.
The Net Unrealized Profit/Loss (NUPL) has been high, remaining above 66 since March 2024, which also suggests that a correction is due, as many holders are currently in profit. Although institutional investment has been steadily increasing, we are now observing a plateau in the Accumulation/Ddistribution chart. The number of BTC long positions is decreasing, while shorts remain very low, indicating a lack of confidence that Bitcoin will rise significantly higher. This low interest in both longs and shorts suggests that market pressure could shift soon.
ETF inflows have remained stable, but profit-taking is likely to occur as investors seek to increase their positions in the bear market. While we all love Bitcoin and want the rally to continue, it's crucial to remember that a bear market will eventually happen, along with the next halving—it's just a matter of timing.
Looking at the charts, if anything signifies a market top more than “Laser Eyes,” it could very well be Trump coin. We might see another upward push, but history has shown that if everyone expects a massive rally in September or the fourth quarter, the opposite usually occurs; we end up buying the rumor and selling the news.
Safe trading, everyone! I remain a staunch Bitcoin bull, but I recognize that all good things must eventually come to an end and the next cycle will be so exciting, so make sure youe have the reserves to invest in the bear!
Btcusd techinical analysis.This Bitcoin (BTC/USD) 30-minute chart shows several key technical indicators and annotations, pointing to a bullish outlook. Here's a breakdown of the chart elements:
Key Elements:
1. Price Level:
Current price: $121,315.1
Change: +$2,178.0 (+1.83%)
2. Break of Structure (BOS):
Marked in yellow — indicates a shift in market structure from bearish to bullish.
It suggests a bullish trend continuation after this key resistance was broken.
3. FVG (Fair Value Gap):
The yellow "FVG" arrow points to an imbalance or gap between candle wicks that the market might return to for liquidity.
Often used as a potential entry point or pullback target.
4. Trendline:
The pink upward trendline shows current bullish momentum.
Price is currently testing or has broken above this trendline.
5. Bullish Flag/Channel:
Blue diagonal channel indicates a bullish flag or continuation pattern.
Price broke out upward from this flag — typically a bullish sign.
6. Fibonacci or Ratio Markers:
Numbers like 0.9612351706716865 and 0.305800778819... may

Ascending Inverse H&S on the BTC weekly chartThe longer it takes to break above this neckline the higher the breakout target will be. I have arbitrarily placed the measured move line at July 18th 2025. If the breakout were to happen on that day the measured move target is around 208k, which could take quite awhile to reach or if we entered a truly hyperparabolic blow off top we could reach such a target way quicker than when the dotted measured move line reaches it. *not financial advice*

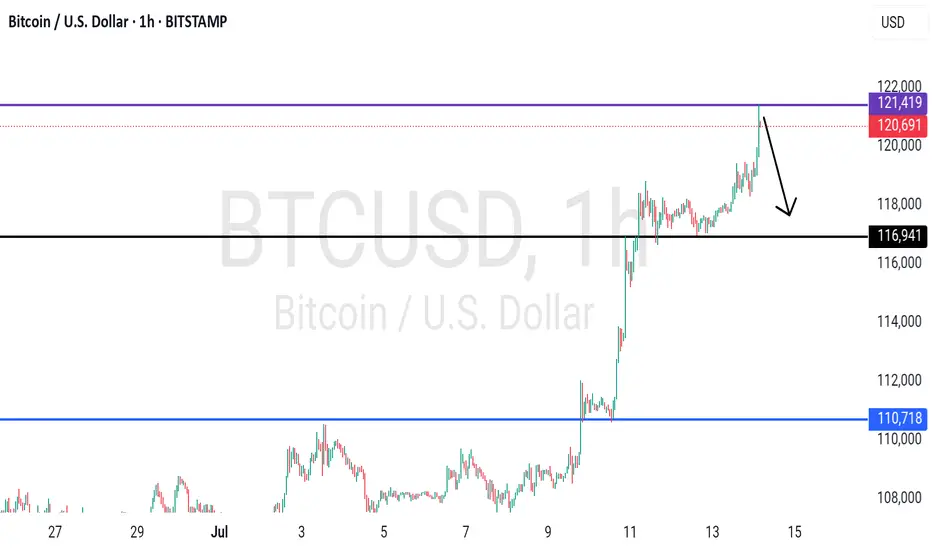
BTCUSDT - high placed? What's next??#BTCUSDT.. .A very reasonable high are placed so far.
That is around 120-121k
I'd market hold it in that case drop expected.
Good luck
Trade wisely
BTCUSDWeekend price pump will fade expecting price to fall back to $110k region before we see a major price move to $130k
BTC bullish scenario - short term bearishMapping out BTC sideways consolidation that could wreak havoc on ALTS.
Looking at the daily chart, this consolidation is still bullish as BTC price action is still likely respecting this ascending channel.
However, each move down on BTC could mean a significant dump on alt coins.
IMO, based on how the chart looks, BTC price still needs to come and test the bottom and coincidentally there is a huge FVG left when BTC rose impulsively. In all likelihood, I am expecting at the very least for a quick wick down to fill the gap before BTC can then start some bullish price action.

Bitcoin’s Incoming Bear Market!🚀 Bitcoin’s Bullish Phase: The Final Push Before the Fall?
Bitcoin is currently in the parabolic uptrend phase of its halving cycle, with price action closely following historical patterns. Since the last halving on April 15, 2024, Bitcoin has mined approximately 42,480 blocks, pushing the market closer to the 70,000-block threshold where the trend historically reverses into a deep bear market.
Based on historical patterns, Bitcoin’s next major bull market peak is expected around 150,000 USD, approximately 70,000 blocks post-halving (projected for August 2025). However, investors must prepare for what follows—a severe bear market fuelled by miner capitulation.
🔥The 70,000-Block Bearish Reversal: Why It Happens Every Cycle
1. The Mining Difficulty Trap & Rising Costs
Bitcoin’s mining difficulty adjusts every 2,016 blocks (~2 weeks) to maintain the 10-minute block interval.
As BTC price surges in the bull market, more miners join the network, driving competition and difficulty higher.
This raises mining costs and squeezes profit margins, making it harder for smaller miners to stay afloat.
✅ Bull Market (~0-70,000 Blocks Post-Halving)
High BTC prices offset increased difficulty, allowing miners to hold rather than sell.
Low sell pressure from miners keeps Bitcoin in an uptrend.
❌ Bear Market (~70,000 Blocks Post-Halving)
After BTC peaks, prices decline but difficulty remains high.
Mining costs remain constant, while block rewards drop.
Weaker miners can’t afford to mine at a loss and are forced to sell their BTC holdings to cover operational expenses.
2. The Snowball Effect: How Miner Capitulation Triggers a Crash
Once inefficient miners begin selling, a chain reaction unfolds:
1️⃣ Bitcoin price starts declining after the cycle peak (~12-18 months post-halving).
2️⃣ Miners struggle to remain profitable due to high difficulty and lower block rewards.
3️⃣ Miners begin offloading BTC to cover expenses, increasing supply in the market.
4️⃣ More BTC supply leads to further price drops, triggering panic selling.
5️⃣ Additional miners shut down operations, selling off reserves, further flooding the market.
6️⃣ Capitulation accelerates, causing a cascading effect similar to leveraged liquidations seen in past bear markets.
🔄 This cycle repeats until enough miners exit, difficulty adjusts downward, and BTC stabilizes.
3. Historical Proof: How Miner Capitulation Has Marked Every Bear Market
Each Bitcoin bear market aligns with major miner capitulation events. Here’s how past cycles have played out:
📌 2012 Halving: Bull top in late 2013, miner capitulation in 2014, BTC fell -80%.
📌 2016 Halving: Bull top in late 2017, miner capitulation in 2018, BTC fell -84%.
📌 2020 Halving: Bull top in late 2021, miner capitulation in 2022, BTC fell -78%.
📌 2024 Halving: Expected bull top in late 2025, miner capitulation likely in 2026?, BTC decline TBD but estimated to be around -60%.
🔹 In all cases, BTC topped ~70,000 blocks after the halving, followed by a deep drawdown driven by miner capitulation.
🔹 The selling pressure from miners perfectly aligns with the start of major market crashes.
4. The Accumulation Phase: What Follows the Crash?
After miners capitulate and difficulty adjusts downward, Bitcoin enters a sideways accumulation phase (~140,000-210,000 blocks post-halving).
Weaker miners have already exited, reducing sell pressure.
Surviving miners adjust to lower rewards and stop mass selling BTC.
Smart money (whales & institutions) begin accumulating at undervalued prices.
The MVRV ratio drops below 1, signalling a market bottom.
Bitcoin stabilizes, setting the stage for the next bull cycle.
This predictable recovery cycle lays the groundwork for Bitcoin’s next exponential rally into the next halving period.
The Bitcoin Bear Market Prediction for 2025-2026
✅ Bitcoin is currently on track to peak near ~$150,000 around 70,000 blocks post-halving (August 2025).
✅ Following this, BTC is expected to enter its bear market, with prices potentially falling to ~$60,000 (by December 2026).
✅ The primary catalyst for this crash will be miner capitulation, just as it has been in every prior cycle.
Final Thoughts
If history repeats, the Bitcoin market is set to follow a sharp parabolic rise to ~$150,000 before undergoing a 70,000-block miner-driven selloff into a multi-month bear market. Investors should be aware of this pattern and plan accordingly.
Sources & Data Validation
The insights presented in this article are based on historical Bitcoin price cycles, on-chain analytics, and mining difficulty trends from various sources, including:
Blockchain Data (Glassnode, CoinMetrics)
Historical BTC Halving Data (Bitcoin Whitepaper, Blockchain Explorers)
Market Analysis Reports (Messari, Arcane Research)
Macroeconomic Influences (Federal Reserve Reports, Global Liquidity Cycles)
Disclaimer: Not an Investment Recommendation
This article is for informational purposes only and should not be considered financial or investment advice. Bitcoin and cryptocurrency markets are highly volatile, and past performance is not indicative of future results. Conduct your own research and consult with a financial professional before making any investment decisions.


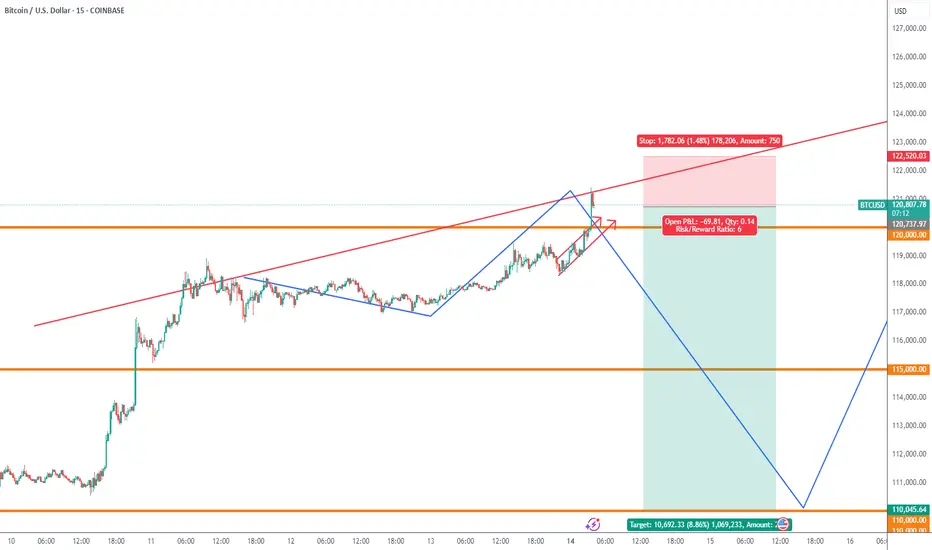
Btc levels 🔍 Dear TradingView community,
Here’s my outlook for Bitcoin in the upcoming weeks.
📊 The current levels are critical — they will determine whether the price continues toward higher targets or starts a deeper correction.
Stay sharp and manage your risk accordingly!
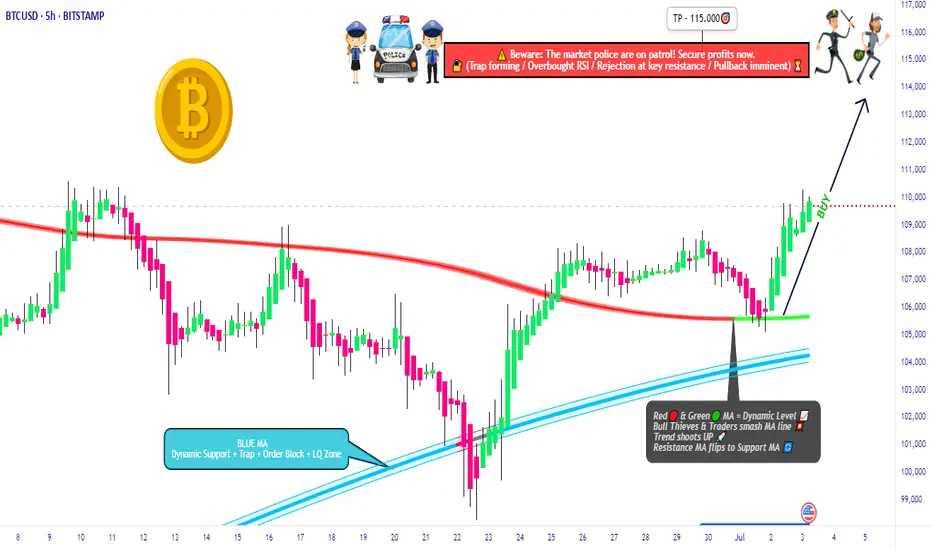
BTC/USD Heist Mode: Buy Low, Escape Rich🔓 BTC/USD Crypto Vault Breach: Thief Strategy for Long Entry Robbery (Swing/Day Setup) 🔓
🌟Hi! Hola! Ola! Bonjour! Hallo! Marhaba!🌟
Dear Money Makers & Robbers, 🤑💰💸✈️
🚨 Welcome to our next Thief Trading-style breakout mission — this time targeting the mighty BTC/USD vault. Using a fusion of technical precision and macro-level insight, we're charting a long entry blueprint for a profitable heist.
🔑 Entry Plan
"The vault is open!" 💥
Buy at current price or set Buy Limit near swing lows (15–30min timeframe pullback entries). We're timing the entry with stealth—precision over panic.
🛑 Stop Loss Setup
SL set near recent swing low (4H TF reference: ~104.000).
Adjust based on position sizing, risk appetite & multi-order tactics.
🎯 Take Profit Target
Targeting 115.000—or exit earlier if price action stalls. Get in, get out. Efficiency is the code.
👀 Scalpers' Notice
Only work the Long side. If your bag’s heavy, strike instantly. If light, ride with swing robbers. Use trailing SLs to protect your bag.
📈 Why We’re Bullish
Market momentum favors the bulls:
Overbought zones acting as lures
Bearish traps ready to flip
Key confluences from sentiment, COT, on-chain & macro analysis
➡️ Full supporting breakdown available 👉👉🔗🔗.
📢 Risk Note – Stay Sharp
Major news events = increased volatility ⚠️
Avoid entries during news. Trail stops to protect running profit. Rob smart.
💖 Boost the Crew
If this blueprint aligns with your mission, hit that Boost button. It fuels the team, and together, we profit like pros. One heist at a time. 💪🎉
🧠 Stay ready—next plan drops soon. Until then, rob safe, rob smart. 🐱👤
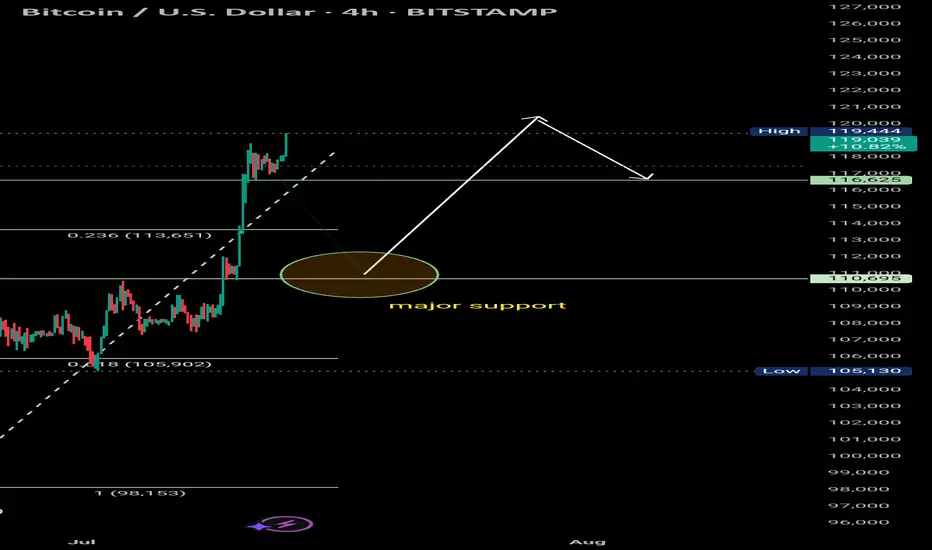
Bitcoin has made a new high at $119, 444.
High: $119,444 – New swing high reached, showing +25.71% gain from the recent low.
Bullish Continuation/If the support holds, buyers are expected to step in and push price further above the recent high toward the next resistance range of $124K+.
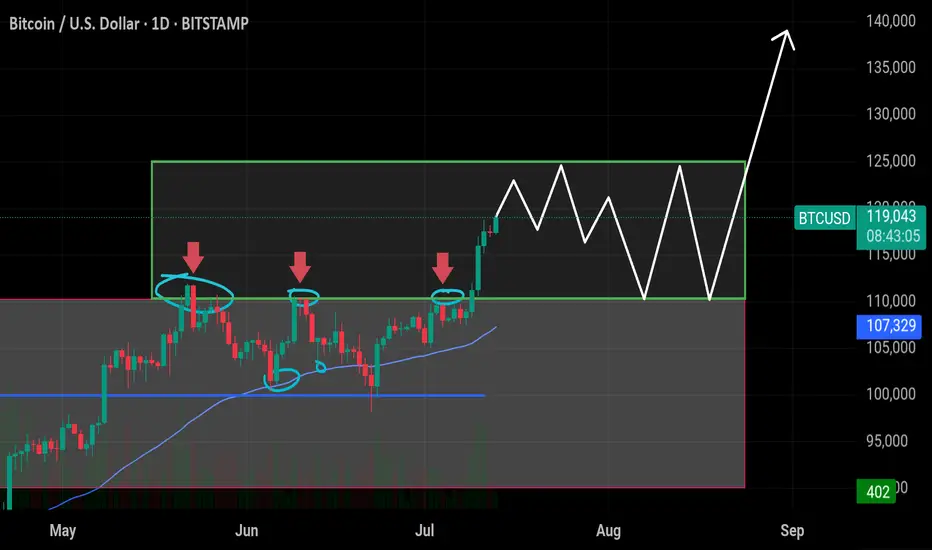
$BTC Ready to Explode – Targeting $125K+ Soon! Bitcoin has finaCRYPTOCAP:BTC Ready to Explode – Targeting $125K+ Soon!
Bitcoin has finally broken out of the previous resistance range (~$110K–$111K), where it was rejected multiple times in June. Now it's consolidating in a tight box, setting up for a big move.
🔸 Support $110k–$113k
This area was previous resistance and is now acting as strong support. Holding above this confirms bullish strength.
🔸 Upside Target: $125k
If BTC holds within the current range and breaks above, the next leg could push price toward $125K. A clean breakout could even extend toward $140K.
🔸 Short-Term Take Profits:
✅ TP1: $120,000
✅ TP2: $122,000
✅ TP3: $125,000
🔸 Risk Level at $110,000:
Break below this level would invalidate the bullish setup and increase downside risk.
BTCUSD: Bearish Continuation
The charts are full of distraction, disturbance and are a graveyard of fear and greed which shall not cloud our judgement on the current state of affairs in the BTCUSD pair price action which suggests a high likelihood of a coming move down.
Disclosure: I am part of Trade Nation's Influencer program and receive a monthly fee for using their TradingView charts in my analysis.
❤️ Please, support our work with like & comment! ❤️