BTCBTC is still bullish, it needs correction and next reaction is above 120K.
Disclosure: We are part of Trade Nation's Influencer program and receive a monthly fee for using their TradingView charts in our analysis.
BTCUSD.PM trade ideas

[UPD] Trend analysis: BTC / ETH / SOL / XRP and other Just recorded a new video overview of the crypto market and the current trend developments in major coins: CRYPTOCAP:BTC , CRYPTOCAP:ETH , CRYPTOCAP:SOL , CRYPTOCAP:XRP , CRYPTOCAP:LINK , GETTEX:HYPE , BSE:SUPER , $FLOKI.
Among the new assets on my radar I shared my view on the trend structure of $RENDER.
In my personal investment planning, I continue to treat any potential corrections into key support zones as opportunities to add or open new positions.
Thank you for your attention and I wish you successful trading decisions!
If you’d like to hear my take on any other coin you’re tracking — feel free to ask in the comments (just don’t forget to boost the idea first 😉).

Weekly Close Watch: Bitcoin’s Key Level Could Shift the ChartsGood morning, Guys
There's only 1 day and 13 hours left until the weekly Bitcoin candle closes.
It's crucial that this candle closes above the 112,331 level with strong volume. Anyone experienced in economics and technical analysis knows just how significant this is.
If we get that close above the level, I’ll share a powerful analysis with a clear target.
I want to sincerely thank everyone who’s been supporting my analyses with likes—your support is
my biggest source of motivation when it comes to sharing content.
Much love to you all—we’re more than just a community, we’re a family. 💛

BTC's increasing fomo force will push the price up furtherCRYPTO:BTCUSD just broke the important resistance zone and trendline around 110000. This price increase to create a new ATH will create a large amount of FOMO in the market pushing BTCUSD to increase more than half. 116,000 FIbonacci extension points are considered the immediate Target for the uptrend.
Waiting for retests to the support zone for the trend-following BUY strategy.
Support: 110000-107500
Resistance: 116000
Buy zone: 110000 ( support + trendline)
Buy Trigger: break above 112000
Leave your comments on the idea. I am happy to read your views.

Bitcoin pushes higher, but its not the only game in townBitcoin is up around 26% this year. A strong gain. But it’s not alone. The higher Bitcoin rises, the less the gains become in percentage terms. It's now in a different league, so a $1,000 or $10,000 move its necessarily what it used to be.
Meanwhile, Gold, silver and copper have also pushed higher in 2025. The Nasdaq 100 is up too. All signs point to a weakening US dollar.
When risk assets and commodities rally together, it's a signal. Investors are shifting. Not out of fear, but to diversify away from the dollar. This is a theme that’s building strength.
Gold is up nearly over 25% YTD. Silver even more. Copper, the industrial bellwether, has joined the rally. These aren’t just trades. They’re strategic moves. A hedge against dollar debasement, inflation, and long-term fiscal risks in the US.
The Nasdaq’s rise tells a similar story. Tech stocks benefit when yields fall and the dollar softens. Big tech also has global revenue exposure. A weaker dollar inflates their earnings in foreign currencies.
What ties all this together? Loss of confidence in the dollar as the sole reserve hedge. Too much debt, too much printing. Central banks know it. They’ve been buying gold for years. Now, retail and institutional investors are catching on.
Bitcoin, the digital alternative to gold, gets the headlines. But it’s part of a broader move. The USD remains the world’s most important currency. That’s not changing tomorrow. But its dominance is being questioned in ways we haven’t seen in decades.
This isn’t just a crypto rally. It’s a dollar diversification play. And it’s gaining momentum.
The forecasts provided herein are intended for informational purposes only and should not be construed as guarantees of future performance. This is an example only to enhance a consumer's understanding of the strategy being described above and is not to be taken as Blueberry Markets providing personal advice.

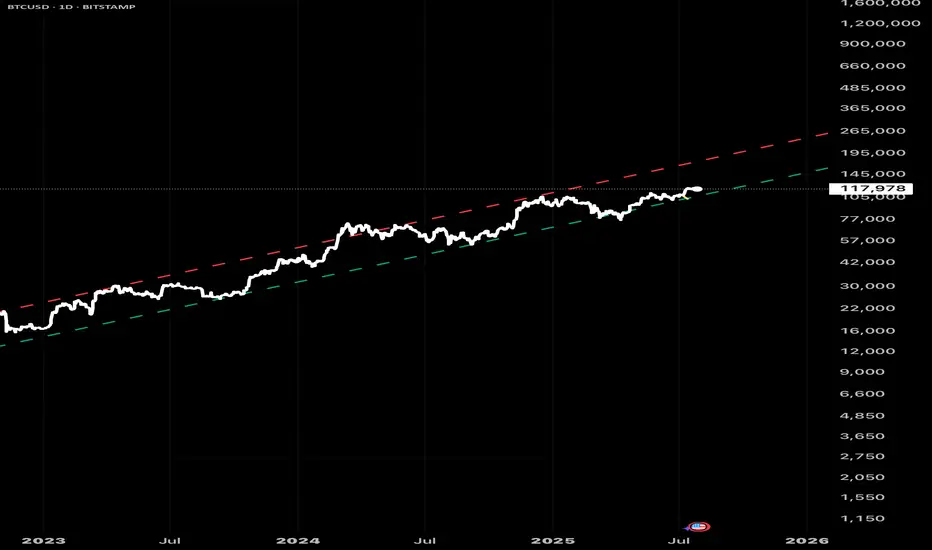
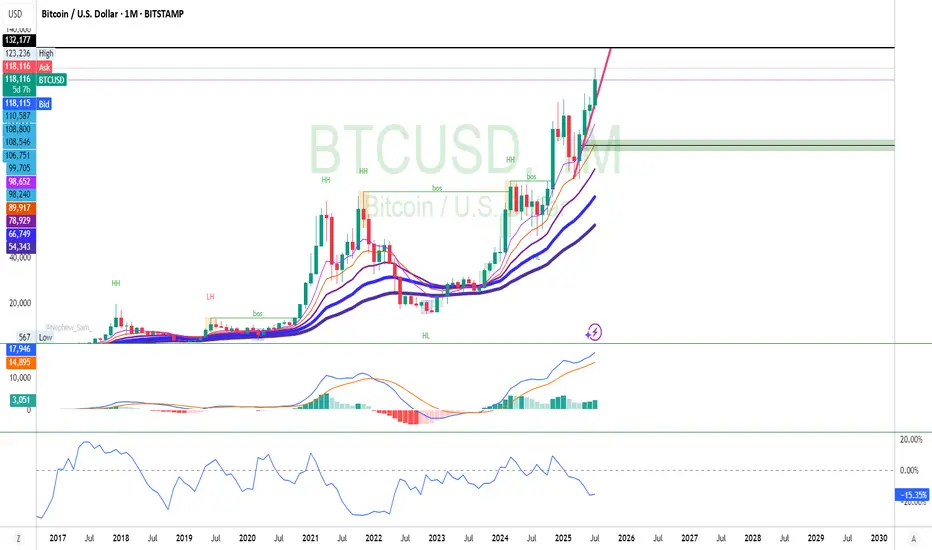
Bitcoin prediction (no fluff)I made this trend many months ago.
Thought I would share it with anyone considering BTC as a hedge against fiat inflation.
No candle sticks movement predictions.
No wedges.
No Fibonacci sequence.
The real mover of BTC is basically Stock-to-Flow corrected (downward) by BTC movement which doesn’t occur on exchanges (which is challenging to quantify).
But vague data suggests that OTC inventory is dwindling by the week.
Therefore, once OTC transactions go to zero, BTC will break upward through the top of this channel and approach the S2F.
WHO WILL WIN BITCOIN'S RANGE BATTLE? In this weeks analysis, Bitcoin has been stack in a tight range for almost two weeks now. Trading range between $115k and $120k. Trend is still holding up for Bullish continuation but indicators strongly cautions loud Sirens. A decisive daily close above $120,200 could be the winning whistle for Bullish Continuation, while I see selling pressure to continue to the Support Block of about 113k. Also the selling Volumes are huge but prices are always quickly absorbed suggesting an accumulation is happening more than a distribution. So my thesis for Bitcoin is sideways range bound until there is a clear market winner. I will be paying much attention to the bearish alarm and a breakdown will be confirmed when daily price decisively close below $115k confirming the divergences on the chart. Trading between the range is high risk.

BTC SELL?A nice short opportunity for sell on Btc/Usd.
Intraday trade.
If it get continuation BTC could drop to lower levels.
Aiming for at least 3R
Let’s see how it plays out.

BTC # Bitcoin (BTC/USD) 30-minute chartThis Bitcoin (BTC/USD) 30-minute chart shows a symmetrical triangle pattern forming, with price action compressing between a descending resistance (red trendline) and an ascending support (gray trendline). The price is currently near the apex of the triangle at $118,149, suggesting a potential breakout or breakdown soon. Key support and resistance levels are marked at $115,200 and $120,200 (blue lines). A breakout above the red line could indicate bullish momentum, while a drop below the gray support may signal bearish continuation. Traders should watch for a decisive move outside the triangle for confirmation.
thanking you

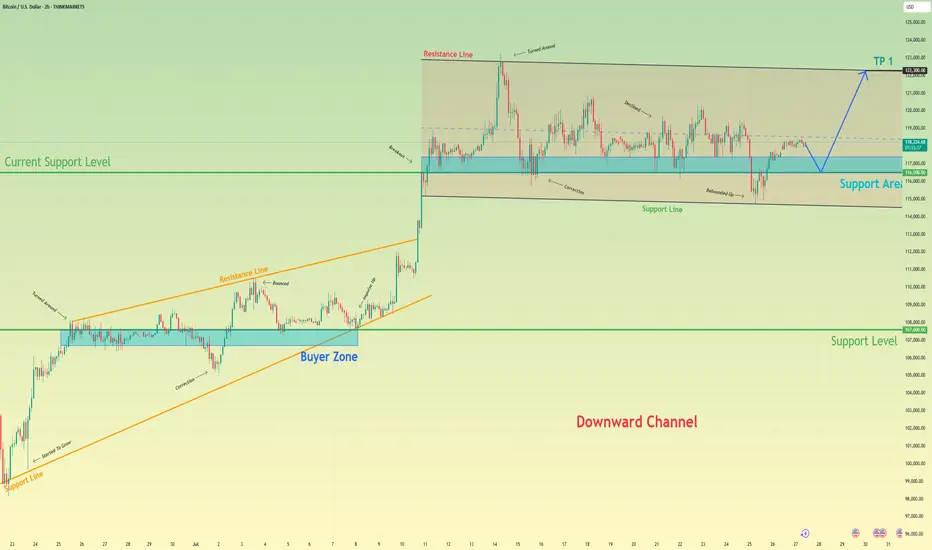
Bitcoin will rebound up from support area to resistance lineHello traders, I want share with you my opinion about Bitcoin. After a strong upward trend that originated from the buyer zone and evolved through an upward wedge, bitcoin executed a decisive breakout, shifting the market into a new, higher-value market phase. This powerful move has since led to an extended period of wide consolidation within a well-defined horizontal channel, a classic sign of the market pausing to absorb the prior impulse and build cause for its next major leg. Currently, the asset's price action is rotating within this structure, defined by a key support area around 116500 and an upper resistance line. Having been rejected from the top, the price is now completing another downward correction and is approaching the channel's foundational support for a crucial test. The primary working hypothesis is a long scenario, predicated on the proven resilience of this support level. A confirmed upward rebound from this 116500 zone would signal that the accumulation within the channel is continuing and likely to resolve upwards. Therefore, the tp is logically and strategically placed at 122300, as this level not only coincides perfectly with the channel's upper resistance line but also represents the completion of the internal rotation, setting the stage for a potential continuation of the larger uptrend. Please share this idea with your friends and click Boost 🚀
Disclaimer: As part of ThinkMarkets’ Influencer Program, I am sponsored to share and publish their charts in my analysis.
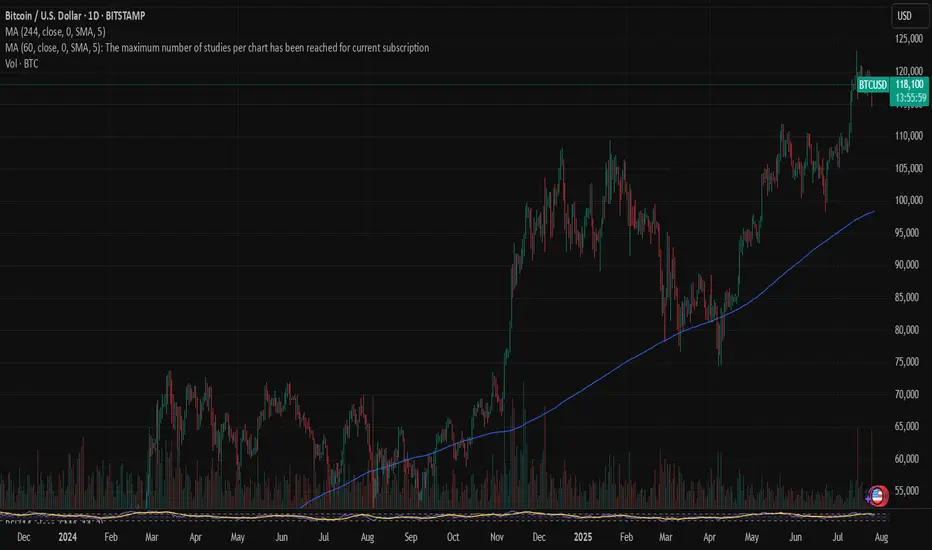
Bitcoin Daily shows us that a HUGE Hurdle has been crossed
The question I will answer in this post is "What is the significance of that Blue line that BTC PA is now sitting on"
On the Daily chart, we can see it has been tested as support and Held.
Previously, it was resistance..
So what ? This has happened many times before.
Lets zoom out and look at the weekly.
So, we see that the Blue line was also the rejection zone in 2021.
Infact, if you look, it has rejected BTC PA 5 times since March 2021 and we have finaly managed to get over it and seem to be comfortable using ot as support now.
This leaves the door open to move higher once PA is ready
But there is WAY MORE to this
Lets look at the monthly chart
So now we see that that same Blue Arc has also been rejecting BTC PA since 2011.
That is nearly the entire life span of Bitcoin and it is certainly the entire life span of its current Bullish momentum since we entered the current channel we are in..
So, in many way, this could be seen as a new beginning, a New cycle.
We do need to remain cautious for now though. As we can see, we did get over this line in 2013 but fell back below......and of course, the possibility for this to happen again exists BUT we now have massive Corporate investment. This could stop that fall.
PA needed to get over this line or fall.
Should this fail to hold for now, we will return to lower lines of support, around 70K- 80K but I would anticipate a massive buying spree should that happen.
The next few months in Bitcoin are absolutely CRUCIAL.
We need to remain above this Arc.
And as I have shown months ago, this Arc is not just a line drawn freehand.
It is actually calculated and is part of a Fibonacci Arc.
The Monthly chart also shows us we are near the ATH Zone on a time span shown under PA on this chart.
We may not see the steep rise we have previously...but the Major Victory is remaining ABOVE this Blue Arc
Fingers Crossed

BTCUSD: Wave Count Hints at DownsideBTC is looking increasingly bearish as the price has risen to a resistance zone formed by multiple factors: trendlines, the POC (Point of Control), and moving averages.
The wave count also supports this bearish outlook / the bearish case.

Bitcoin: Spiked liquidations The optimism that held the market sentiment after the adoption of the Genius Act on July 17th, slowly faded during the previous week. As it was expected, traders were closing their positions in order to book profits, spiking the liquidations of positions. The price of BTC reached the lowest weekly level at $114,8K at Friday's trading session, however, it was only during the short period of time. The BTC swiftly recovered, turning back toward levels above the $118K. The highest weekly level reached was $120K.
The RSI is still holding high, around the level of 60, but went out from the overbought market side. This increases potential for a further move toward the oversold market side, however, it might take more than a week in order for the market to actually turn their course toward the downside. The MA50 is still diverging from MA200, indicating that the potential cross is still not in the store.
BTC continues to hold higher grounds, which indicates that investors are still eager to hold and buy this coin, especially on a dip, like it happened at Friday's trading session. Indications over potential short reversal of BTC are emerging on charts, however, the timing of it is unclear at this moment. In the week ahead there are several quite important US macro data scheduled for a release (NFP, PCE, Unemployment, JOLTs) as well as the FOMC meeting, which all might bring some higher volatility back on markets. BTC might also react, as a part of mainstream markets. At this moment on charts, there is indication that BTC might shortly test lower grounds, probably around the $116K level. If this level sustains the selling pressure, then BTC will revert back, most probably toward the $120K for one more time. Still, there are small odds that the $116K might be breached toward the lower grounds, in which sense, $112K will be level to watch. However, odds for this level are quite low at this moment.
BTCUSD Daily Setup If you look back at my previous analysis of Bitcoin, you will notice that on the daily time frame, the price entered the specified range and then continued its upward trend, and we expect this upward trend to continue to the range of 138,000 to 140,000.
#XAUUSD #BTCUSD #ICT #OrderBlock #FundedTrader #TradingStrategy

Time to Wait and Watch
**"The $133K zone remains Bitcoin’s key resistance level.**
If Bitcoin fails to break this resistance for any reason and forms a **reversal candle** in this area,
I expect a **correction phase** to begin, with the market entering **panic sell mode.**
**First support** lies at **$110K.**
Further support levels are **$100K, $92K, and $88K** respectively.
If the price drops to the **$74K zone**, it’s time to **sell everything you’ve got** (yes, even your kidneys!) and **buy Bitcoin.**
However, if **$133K is broken to the upside**, we’re heading for **$140K, $150K, and $170K**… and **then** the real **panic selling** begins."

Bitcoin Who is buying and never taking profits?
The cycle are only cycles if the experience repetition.
Can we experience the full previous wave is the question.

Btcusd techinical analysis.Btcusd techinical analysis next move posibale at h2 time frame not finchinal advice.

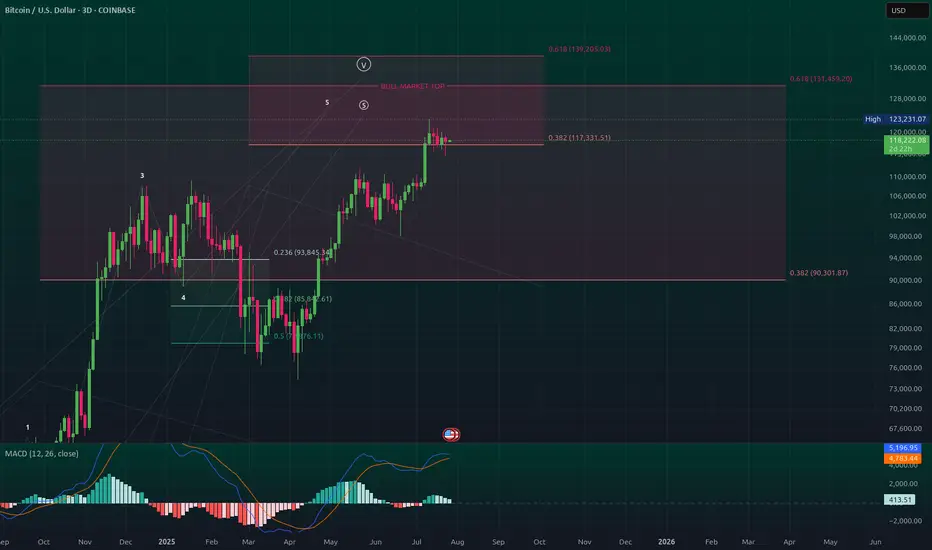
Bitcoin – “topping-zone” update, grounded in the play-book 1️⃣ Big-picture wave count
We are deep inside cycle wave ⑤; sub-wave ③ delivered the textbook power surge, and price has now produced the final “pin” beyond the wedge roof – a move that often marks the last heartbeat of a fifth wave before the engine cools
.
The spike paused almost exactly at a 1-for-1 projection of wave ①, which is one of the three classic objectives for a non-extended wave ⑤ (0.618 ×, 1.0 × or 1.618 × wave ①)
.
Translation: price has reached the textbook exhaustion zone that the slide deck flags as “start thinking about profit-taking”.
2️⃣ What the internals are whispering
The manuals remind us that momentum should start to lag into a wave ⑤ – that’s exactly when bearish divergence appears and warns that the impulse is running out of stamina .
We now have that divergence across the three-day pane, lining up perfectly with the theory. In the past, that signal has kick-started either:
a shallow wave-four-type pullback (23.6 – 38.2 % of the entire leg) if the up-trend is still healthy, or
a full ABC retrace back to the 38 – 50 % pocket when the whole five-wave sequence is complete.
3️⃣ Fibonacci map – unchanged edges, new mid-points
Layer Why it matters (per slides)
117 k – 118 k 0.382 extension cluster and sub-wave ③ peak – first ceiling.
123 k wick 1.0 × wave ① – often the maximum for a regular wave ⑤
.
126 k – 131 k 1.618 overlay of the sub-waves – only reached if wave ⑤ “blows off”.
109 k 23.6 % retrace of the whole advance – first landing pad for a normal pullback
.
103 k – 99 k 38–50 % retrace – where a completed impulse usually rests before the next macro move.
4️⃣ Likely path from here (probabilities courtesy of the slide guidance)
Scenario Odds What you’d expect? How the slides back it up?
Truncated top – the wick was the high ~60 % Price rolls over swiftly; three-leg drop towards 109 k unfolds within weeks. Divergence in a ⑤ is a tired market; truncated fifths are common when wave ③ was extended
.
Mini blow-off to 126–131 k ~30 % Market reclaims the wedge roof quickly, squeezes short sellers, then stalls at 1.618 cluster. Slides label 1.618 × wave ① as the “stretch target” for an extending ⑤
.
Magazine-cover 139 k print <10 % Needs vertical follow-through and no weekly divergence – neither is present. Only seen when sentiment is euphoric and momentum refuses to fade (not the case now).
5️⃣ How to turn this into trades (slide-rule style)
Trail profits, don’t chase: the slide on “profit-taking in wave ⑤” recommends feeding the position back to the market once equality or 0.618 targets print, rather than waiting for a collapse
.
Watch the 23.6–38.2 % retrace band: that zone is the historic sweet spot for a healthy reset after a parabolic run; if price bounces there with improving momentum, the up-trend can restart
.
If— and only if—price vaults the wedge roof again, leave a runner for 126–131 k, but tighten stops using the 78.6 % trailing method highlighted in the slides.
In plain English
Bitcoin has done everything a late fifth wave is supposed to do: overshoot a channel, tag a textbook fib target, and lose its breath while momentum lags. That doesn’t guarantee an immediate plunge, but history – and the curriculum we’ve been working through – say a meaningful pullback is now the path of least resistance. Prepare for a cooling phase toward the low-100 k region; if we sprint instead, treat it as a bonus round, not the baseline.
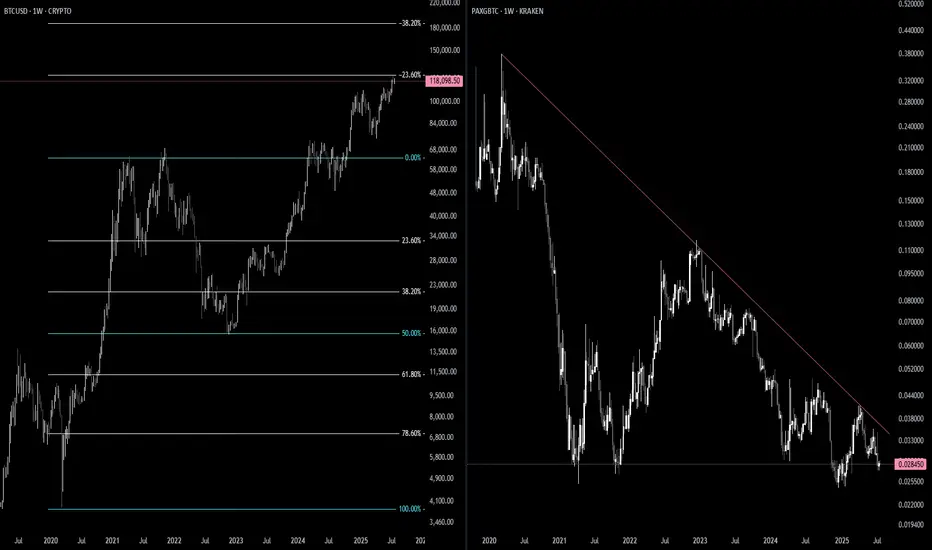
BTC / GOLD 2.0Here is another more zoomed out view of the inverse relationship of BTC to the PAXGold / BTC ratio. This is beautiful and perfect. One can see how they are practically mirrored opposite images of each other. Higher. SOON.

Bitcoin going up because of Cup and Handle!Bitcoin will continue to go up to finish it's measured move from the cup and handle chart pattern playing out. Looks like the text book image of a cup and handle. Lol. Perfection!
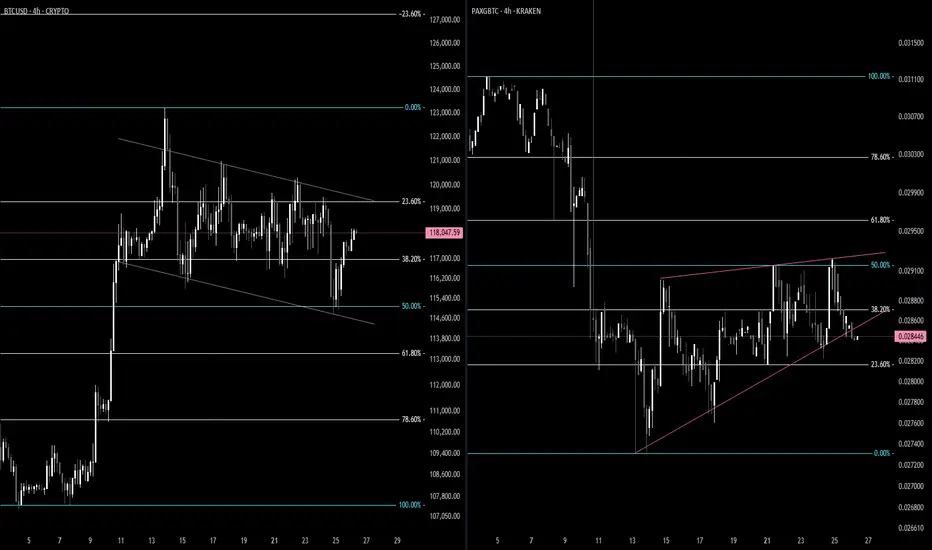
BTC / GOLDIt appears as though the 4H BTC chart has formed a bull flag vs Gold/BTC chart having formed a bear flag. This is VERY encouraging to see. Short term price target is 134-140. Strap in, BTC is a bout to do BTC things again.
"Something’s cooking with BTC…"btc i think it's going up... not just 'cause the technicals look good, but 'cause big funds are already expecting crazy prices. blackrock, fidelity and others have mentioned btc at 150k or even 250k in a few years. and if they’re saying that, it’s not just talk... it’s 'cause they’ve got info most of us don’t.
plus, there’s less btc after the halving, and ETFs are scooping it up like crazy… you already know what that could mean.
