Bitcoin - Will Bitcoin reach its previous ATH?!Bitcoin is above the EMA50 and EMA200 on the four-hour timeframe and is in its ascending channel. Bitcoin’s current upward momentum has the potential to reach its previous ATH. If it corrects, we can look for Bitcoin buying positions from the specified support area, which is also at the intersection of the bottom of the ascending channel.
If this support is lost, the decline will continue to around $113,000, where we can again buy Bitcoin with a better risk-reward ratio.
It should be noted that there is a possibility of heavy fluctuations and shadows due to the movement of whales in the market, and capital management in the cryptocurrency market will be more important. If the downward trend continues, we can buy within the demand area.
Last week, the U.S. House of Representatives passed the CLARITY Act (Crypto-Asset National Regulatory Transparency for Investors and Consumers Act) with 294 votes in favor and 134 against, including support from 78 Democrats. The bill represents the first comprehensive legislative effort to regulate the cryptocurrency industry and is considered a major regulatory win for digital asset proponents.
Key features of the legislation include:
• Clearly defining the regulatory roles of agencies like the SEC and CFTC
• Establishing a new category for registered digital assets
• Facilitating broader integration of cryptocurrencies into traditional financial systems
Status in the Senate: Despite bipartisan approval in the House, the bill’s future in the Senate remains uncertain. Senators are still in the early stages of drafting their own version, and significant revisions are expected. Some Senate Democrats insist that the bill must explicitly address President Trump’s and his family’s cryptocurrency holdings.
The CLARITY Act is part of a broader Republican-led legislative initiative dubbed “Crypto Week,” which includes two additional major digital asset bills aimed at modernizing blockchain regulation and the broader digital finance ecosystem.
Meanwhile, Donald Trump is preparing to issue an executive order that would open up U.S. retirement markets to cryptocurrencies, gold, and private equity. This order would allow 401(k) fund managers to incorporate alternative assets into retirement portfolios.
The move follows the rollback of Biden-era restrictions and the recent passage of three crypto-related bills in the House. While major investment firms have welcomed the proposal, critics warn that alternative assets may expose retail investors to greater financial risks.
Also last week, Bitcoin reached a new all-time high, pushing its market capitalization to $2.43 trillion. It has now surpassed Amazon, Google, and even silver, becoming the fifth-largest asset globally by market value.
Looking ahead, one of the key events on the economic calendar is Federal Reserve Chair Jerome Powell’s upcoming speech at an official central bank-hosted conference on Tuesday. This event comes just before the release of the preliminary S&P Global Purchasing Managers’ Indexes (PMIs) on Thursday. Given Trump’s escalating verbal attacks on Powell, a central question is whether this political pressure has influenced the Fed Chair’s stance.
Trump has repeatedly urged Powell to lower interest rates. This week, reports emerged suggesting that the President had discussed with some Republicans the possibility of removing Powell from his position. However, Trump was quick to downplay the reports, stating that the likelihood of Powell being dismissed was “very low.”
In this context, if Powell uses his speech to reassert the Fed’s independence and calls for patience to assess the impact of tariffs more thoroughly, the U.S. dollar may continue its recent upward trend. Still, it’s too early to confirm a definitive bullish reversal for the dollar. While the global reserve currency has responded positively to headlines fueling tariff concerns, markets could mirror April’s behavior—when fears of recession led investors to sell the dollar instead of buying it—should those concerns intensify again.
BTCUSD.PM trade ideas

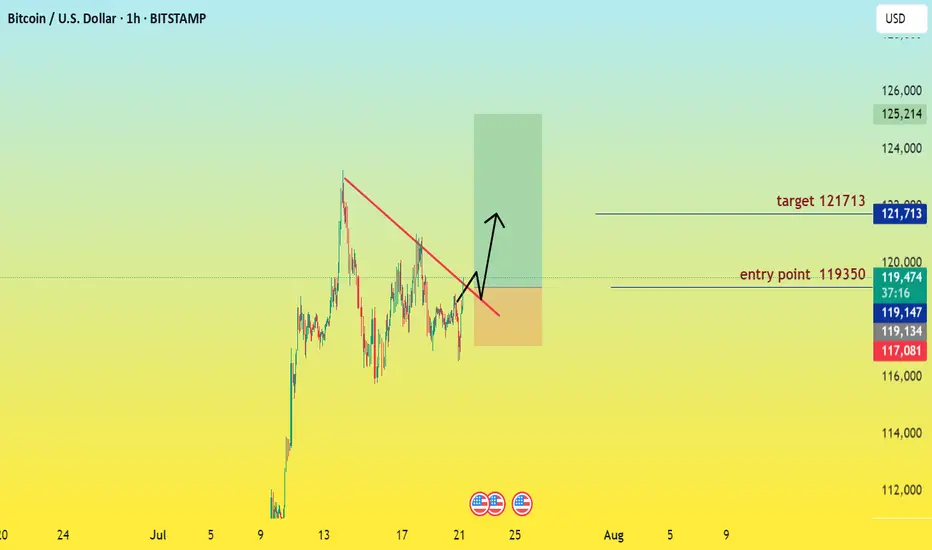
BWith Bitcoin currently trading at $119,425 and our buy signals extending confidently to $121,700, the landscape for BTC presents a compelling bullish narrative. The confluence of sustained institutional demand, evident in robust ETF inflows, and the ever-present scarcity driven by the recent halving, creates a powerful upward momentum. Furthermore, the maturing crypto infrastructure and a more predictable global macroeconomic outlook contribute to a fertile ground for Bitcoin's continued ascent. We are observing supportive technical indicators, including rising trend channels and the potential for bullish candlestick formations like Hammer patterns or Bullish Engulfing patterns, reinforcing our positive outlook. However, in a market as dynamic as cryptocurrency, even the strongest signals require a disciplined approach to risk. To capitalize on this potential upside while safeguarding your capital, consider the following integrated risk management strategies.
Strategic Stop-Loss Placement – Your Safety Net:
Identify Key Support Levels: Based on our technical analysis, identify logical support levels where you expect buying interest to emerge. Your stop-loss should be placed just below these critical support zones. For example, if a strong support level is identified at $117,000, you might set your stop-loss at $116,900.
Consider Volatility: Bitcoin is highly volatile. Avoid setting stop-losses too tight, as normal market fluctuations could trigger them prematurely. Conversely, don't set them so wide that potential losses become unmanageable.
Take-Profit Orders – Securing Your Gains:
Set Realistic Price Targets: Based on your buy signals up to $121,700, consider setting take-profit orders at strategic intervals leading up to or around that level.
Partial Profit Taking: Instead of selling your entire position at one price, consider taking partial profits as BTC moves in your favor. For example, you might sell 30% at $120,500, another 30% at $121,500, and leave the remaining 40% to ride further if the momentum continues. This locks in gains and reduces risk.
Risk-Reward Ratio: Always ensure your potential profit outweighs your potential loss. A common target is a 1:2 or 1:3 risk-reward ratio, meaning for every $1 you risk, you aim to make $2 or $3.
Stay Informed: Keep abreast of market news, regulatory developments, and technological advancements in the crypto space. However, filter out the noise and focus on credible sources.
BTC – Symmetrical Triangle Tightens the Market CoilCRYPTOCAP:BTC is navigating a symmetrical triangle on the 4-hour timeframe 📊. This pattern typically signals a build-up of pressure before a decisive move.
As price action compresses toward the apex, the market is setting the stage for either a breakout surge or a breakdown slip ⚡️.
Patience is key here—traders are watching closely to catch the next wave of momentum.
Eyes on the chart 👀

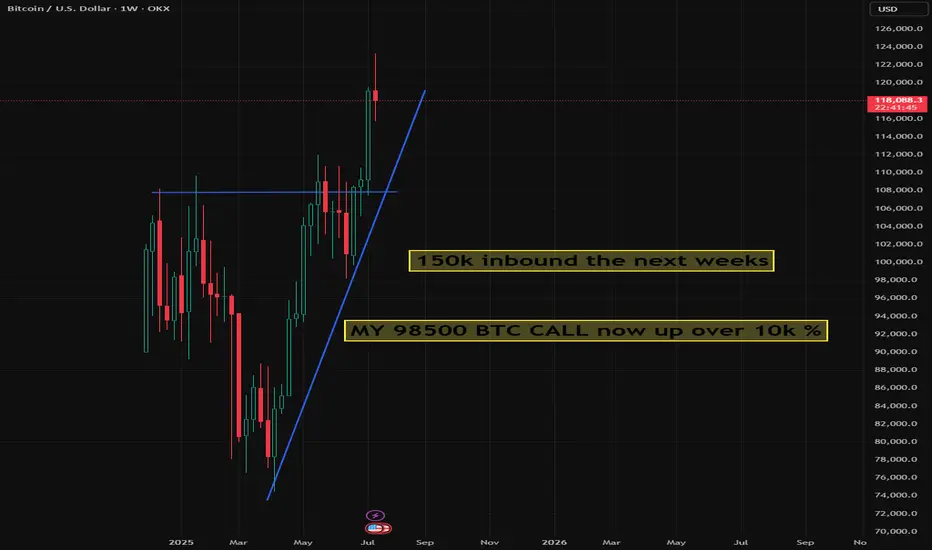
FIBO EXTENTION TARGET 1.618We have a big breakdown here and the next target based on the Fibonacci extention is 160,000.

Btcusd techinical analysis.Btcusd techinical analysis next move posibale at h1 time frame.not finchinal advice.

BTC? Longterm view
Hi
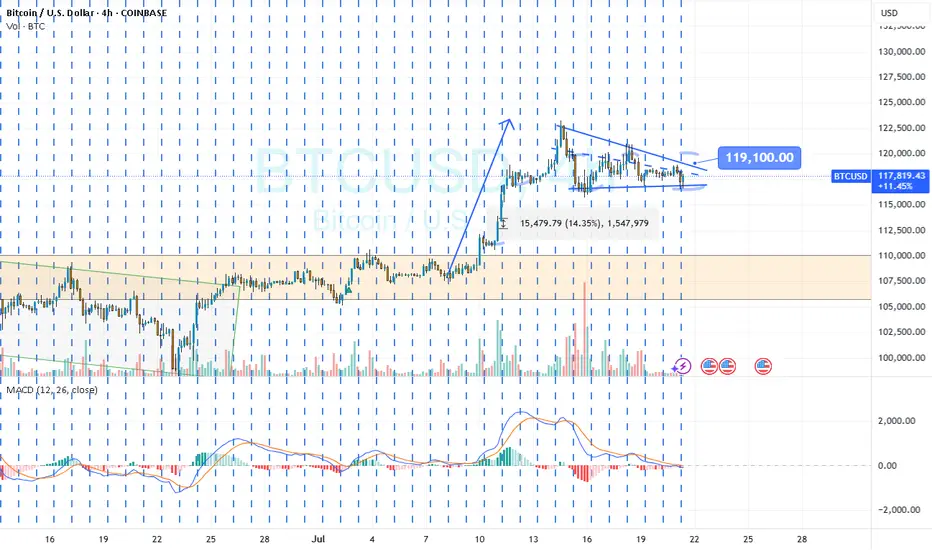
Although 1st half on July we saw nearly 15% of move.
NOW: a pennant/flag is forming.
It's like a sleeping tiger.. accumulation is going on
I would not be in a bearish mood.
Hope it shed some light.
Action:
Option I: May entry small because the pennant isn't broken. Once it breaks consider adding position.
Option II: Wait for a clear break
I hope you'll always be in profit.
Not a guru
BTCUSDWe are favoring more of the sell sides to give us a better risk to reward while the buy side we will be risking a little on it.

$BTC Is moving alongBTC‑USD | 2‑Week Chart – Quick Read
Structure & Trendlines
* Price continues to respect the 2019‑2025 rising green channel and has flipped the 2017‑2021 orange trendline from resistance to support.
* A fresh break‑of‑structure above the 2021 ATH confirms continuation. Invalidation sits near the channel base / 65‑70 k demand zone.
Fib Road‑Map
* 1.618 extension (\~90 k) was reclaimed and back‑tested.
* Next confluence levels are the 2.618 (\~180 k) and 4.236 (\~240 k) extensions, matching thin volume nodes on the VPVR.
Momentum
* Multi‑time‑frame RSIs have broken their downtrends and pushed firmly bullish, echoing the 2020 breakout posture.
* The 2‑week MACD histogram has flipped positive with a higher‑low signal—momentum rebuilding.
Volume Profile
* Highest historical volume sits 15‑35 k; above 120 k liquidity thins sharply until ~160 k.
Near‑term downside risk
* The last episode of aggressive Fed rate cuts (March 2020) triggered a sharp washout before the subsequent melt‑up.
* Cuts keep getting deferred because unemployment remains low and jobs data solid; if a sudden pivot arrives on weakening data, a risk‑off flush toward the mid‑channel zone (≈ 80‑90 k) is possible before higher targets re‑engage.
Macro uptrend intact; pullbacks to the channel centre are buy‑the‑dip territory while momentum and structure favour an eventual 161.8 → 261.8 push, but stay nimble for policy‑driven volatility.

bitcoin sell setup.price dropped below previous low and remain down there for a long time, this shows sellers strength and willingness to push down. we expect a sharp move from here

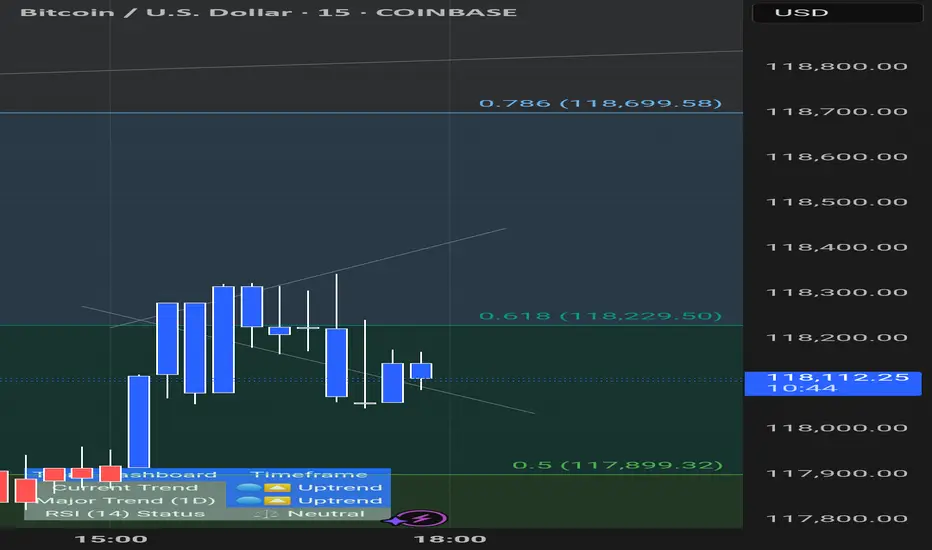
BTCUSD Daily Setup In the daily timeframe, Bitcoin is in an upward trend. We expect it to correct to the fvg of 115,330 to 112,140. If the daily candle does not close below this fvg, we expect Bitcoin to grow and rise to the range of 138,000 and 140,000. Then we will have a large correction and decline from the range.
#XAUUSD #ICT #OrderBlock #FundedTrader #TradingStrategy

Jul 20 | Crypto-market reviewNew Crypto-Sunday market review video, where I share my current analysis on the trend structures of BTC, ETH, SOL, XRP, HYPE and other alt- and mem-coins of interest to my, highlighting key support and resistance zones to watch in the coming sessions.
Charts featured in the video
BTC
ETH
XRP
(!) SOL
(!) HYPE
(!) TRUMP
BRETT
(!) FET
RENDER (Weekly)
(!) DOG
(!) MOG
Thank you for your attention and I wish you happy Sunday and great trading week!
If you’d like to hear my take on any other coin you’re tracking — feel free to ask in the comments (just don’t forget to boost the idea first 😉)

BTCUSD: Bullish Continuation
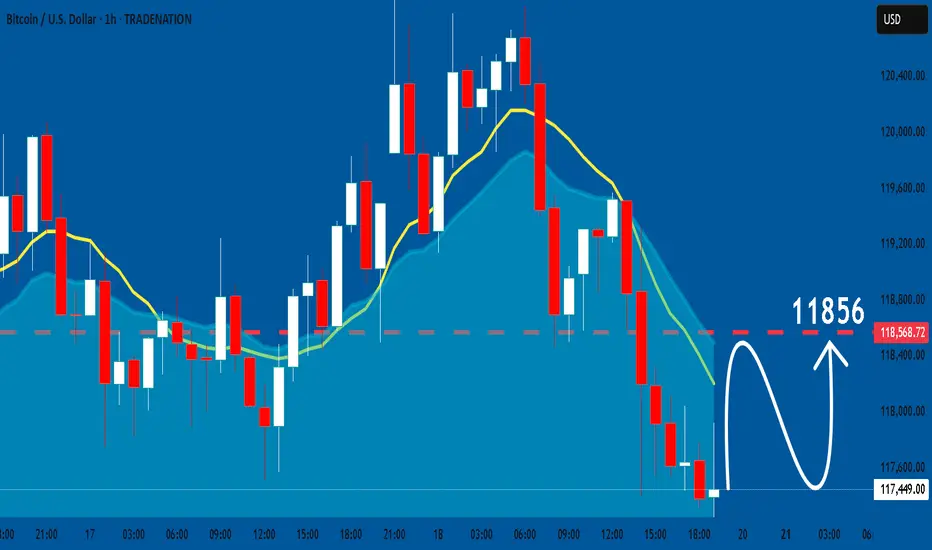
Looking at the chart of BTCUSD right now we are seeing some interesting price action on the lower timeframes. Thus a local move up seems to be quite likely.
Disclosure: I am part of Trade Nation's Influencer program and receive a monthly fee for using their TradingView charts in my analysis.
❤️ Please, support our work with like & comment! ❤️
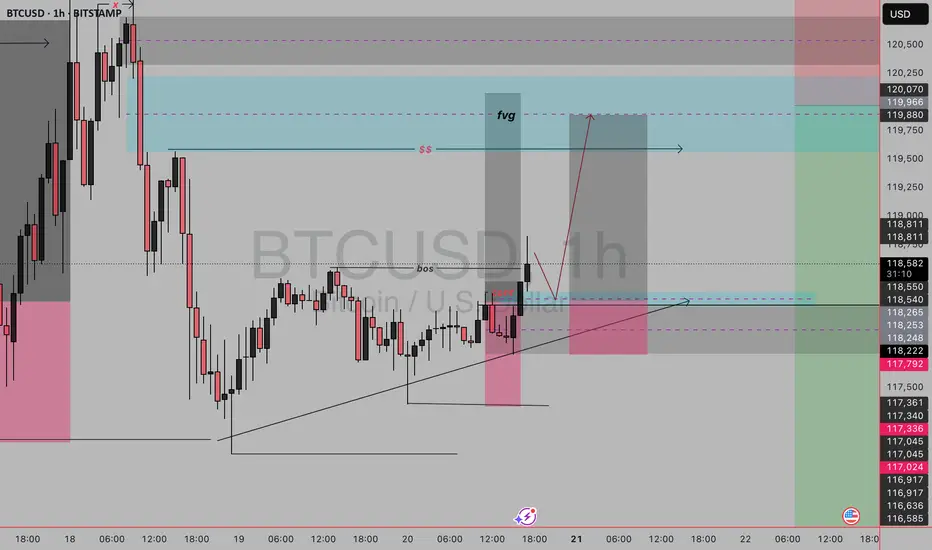
btc usd buy setupThis BTC/USD 1H setup is a Smart Money Concept (SMC) long trade, built on liquidity, market structure shift, and mitigation. Let’s break it down:
Setup Breakdown
1. Market Structure
Previous bearish leg created a deep selloff.
Price swept a low, broke above a structure (BoS = Break of Structure) → indicating possible reversal intent.
2. Liquidity Sweep
See the “x” mark near the top and the large wick that tapped above the previous high?
That was a buy-side liquidity grab.
Price then reversed aggressively, hinting it was a stop hunt, not genuine buying.
3. Break of Structure (BoS)
Confirmed bullish intent.
The BoS you marked shows that the last lower high was broken, turning structure bullish.
4. Entry
Price returned into a demand zone (pink box) after the BoS.
The area aligns with:
Demand zone (bullish OB)
Fair Value Gap (FVG) just above it.
The ascending triangle pattern in the recent candles added confluence of bullish pressure before breakout.
5. FVG & Target Zone
You're targeting the FVG + Supply Zone marked in light blue around 119,900–120,400.
It's aligned with:
Liquidity cluster
Previous supply structure
That’s a logical area where price might slow down or reverse.
Trade Plan
Entry: After price retests demand and shows bullish signs.
Stop Loss: Below the demand zone and recent swing low (~116,585).
Take Profit: Top of the FVG/supply zone (~120,400–121,250).
Risk-Reward: Solid R:R ~1:3 or higher.
BTC - Breakout, Fakeout… or Loading Zone?BTC is back inside the $116K–$117K demand zone — same level that launched the last breakout.
But this time? Consolidation. Stoch RSI stuck mid-range. Unclear momentum.
The Hull Suite Strategy nailed the previous breakout with clean stacked buys — but it’s showing hesitation now.
This is where strategy testing really matters. Not every system handles chop the same.
📊 We test these setups across multiple variations — especially in zones like this where most signals lose edge.
Support flip or breakdown brewing? Watching closely.
—
#BTCUSD #Bitcoin #HullSuite #StrategyTesting #BacktestBetter #QuantTradingPro #CryptoAnalysis #TradingView

Braxons Group: How Cryptocurrency Became Part of Everyday SpendiOver the past five years, cryptocurrency has gradually moved beyond the narrow confines of a speculative asset toward what it was meant to be from the start — a fully functional means of payment. In July 2025, a study by Bitget Wallet confirmed a significant shift in consumer behavior: millions of users worldwide now use digital assets to pay for goods, games, and travel.
Braxons Group analysts see this not just as a trend, but as a clear sign that crypto is entering a mass-adoption maturity phase.
Crypto in Shopping: From Enthusiasts to Households
According to the study, 35% of users now use cryptocurrency for everyday purchases — not only for digital goods, but also for paying for food, services, and essential products.
Braxons Group notes a sharp rise in crypto payment integration with POS terminals and online marketplaces, especially in Southeast Asia, where digital wallets often replace bank cards. The growth is driven by low fees, lack of bank control, and instant settlements — particularly via USDT and BUSD.
Gaming: The Key Engagement Driver
36% of users regularly use cryptocurrency for in-game purchases and Web3 applications. This comes as no surprise: NFT items, premium memberships, and tokenized game assets are now core components of most gaming economies.
Braxons Group highlights that Gen Z and millennials form the backbone of this new crypto audience. Their willingness to spend tokens on in-game content demonstrates high adaptability and low entry barriers.
This is an important investment signal: companies operating at the intersection of crypto and gaming will likely become dominant growth drivers over the next 3–5 years.
✈ Travel: Crypto Crosses Borders
Around 35% of respondents use cryptocurrency for booking tickets, hotels, and travel services. For Braxons Group, this validates the hypothesis that crypto is the ideal tool for global users — eliminating currency restrictions, reducing banking fees, and enabling direct bookings without intermediaries.
Among older demographics (Gen X), trust in crypto for high-value transactions is increasing. This marks a shift in the market: a sector once dominated by speculation is now becoming practically useful for everyday needs.
Regional Differences
The Bitget study revealed notable geographic patterns:
Southeast Asia — leader in everyday crypto payments (up to 41%)
Africa — active use for education payments
Latin America — strong e-commerce adoption (up to 38%)
Middle East — growing interest in high-ticket purchases (cars, tech, luxury goods)
For Braxons Group, this means the decentralized payments market is becoming multi-layered and globally fragmented, requiring region-specific solutions.
Braxons Group’s Conclusion
Our team concludes that cryptocurrency is evolving from an investment class into a transactional tool. It no longer makes sense to view digital assets solely as a store of value or speculative vehicle.
What was once an experiment is now daily reality:
Gamers buy NFTs and passes with tokens.
Households purchase groceries with stablecoins.
Travelers book accommodation with ETH.
The next step? Integrating cryptocurrency into banking and government systems. For businesses, this means embedding crypto infrastructure is now a must-have for digital competitiveness.

It will be bullish but a retest must happenBTC/USD Technical Forecast: A Structurally Mandated Retracement Before the Next Major Expansion
The current market structure on the BITSTAMP:BTCUSD 4-hour timeframe strongly suggests a high-probability corrective phase is imminent prior to a continuation of the macro bullish trend. Our analysis identifies a confluence of factors, primarily a pronounced momentum divergence and significant market inefficiency, that necessitate a retracement to key support zones before a new leg higher can be sustained. The overarching strategy is to anticipate this pullback as a high-value accumulation opportunity .
Confluence of Bearish Catalysts for the Short-Term Correction:
Class A Bearish Divergence: A clear Class A bearish divergence is present between price action and the Stochastic oscillator. While the price has forged higher highs, the oscillator has printed consecutively lower highs. This momentum decay is a classic leading indicator of trend exhaustion and signals an impending shift in order flow from bullish to bearish in the immediate term.
Market Structure & Liquidity Voids (Fair Value Gaps): The preceding impulsive leg-up, while aggressive, was inefficient. It left a significant Fair Value Gap (FVG) , or a liquidity void, in its wake. According to the Power of Three (PO3) framework (Accumulation, Manipulation, Distribution), the market is now in a consolidation/distribution phase post-expansion. To engineer the liquidity required for the next major mark-up (distribution), a " manipulation " leg downwards is structurally required. This move will serve to mitigate the FVG and sweep sell-side liquidity resting below the recent lows.
Projected Price Path & Key Levels of Interest:
The Trigger - "Bearish Gate": A definitive break and close below the level marked as the " Bearish Gate " will serve as the primary confirmation for the commencement of this corrective scenario.
Corrective Targets: The retracement is expected to navigate towards the Points of Interest (POIs) nested within the FVG, as marked on the chart (Target 1, Target 2, Target 3).
Primary POI (Target 3): The ultimate objective for this retracement lies within the $110,000 - $111,000 confluence zone . This area represents a powerful technical, a key Fibonacci extension, and the macro ascending trendline.
The Bullish Continuation Scenario:
Upon successful mitigation of the FVG and a confirmed bullish reaction from our primary POI, we anticipate the resumption of the primary bullish order flow. This corrective phase will have effectively cleared out weak hands and built the necessary liquidity for a sustained move. The price is then projected to trend upwards within the blue ascending channel, with the ultimate target being the buy-side liquidity resting at the major resistance block located in the $124,000 - $125,000 region.
Conclusion:
The current setup presents a classic counter-trend opportunity within a macro bullish framework. The confluence of momentum divergence and structural necessity for FVG mitigation provides a high-conviction thesis for a short-term sell-off.

Capital Doesnt Lie - The Energy ProblemPart 1: THE ENERGY PROBLEM
Everything we do produces energy, even prayer. If you have ever felt tired after praying for someone, that's because you spent energy and made an effort; let's call that energy 'capital' . Capital begins with effort, whether you see it or not.
The problem is: how do we use it or store it?
Imagine that energy as an invisible ball growing in front of your head. Every time you work and think, you're growing that invisible energy ball of capital. So, how do you get it in your hands? You can plant a cucumber, craft a chair, or clean your house. It's your order, attention, time- all energy made visible in the house, stored in the cucumber or the chair.
Genesis 3:19
'By the sweat of your face you shall eat bread…'
Verse Comment: It doesn't say 'by luck' or 'by inheritance.' It says by sweat. That's energy. That's effort. That's the value produced.
Proverbs 14:23
'All hard work brings a profit, but mere talk leads only to poverty.'
Verse Comment: Effort always creates something. Even spiritual labor, such as intercession, leadership, and parenting, is a form of value creation.
But here's the issue. That cucumber plant? It goes bad. That chair? It breaks. That clean house? Dirty again in 24 hours."
Everything we do has a cost; it's not free. Energy fades unless you can find a way to store it longer than the life of the thing you created.
So if everything fades, the big question becomes: How do you store the surplus of your energy, (the part you don't need today) so it doesn't fade by tomorrow?"
That's the foundation of all capital. Of all value. And of all wealth. And it starts with understanding where your energy is going, and what it's pouring into.

BITCOIN LOG UPDATESThis meaningful indicators on logarithmic, Since 2022- now I still used this on BITCOIN.
it works, some of my followers doubt this but its fine, we might see 170k per bitcoin by end of this year? This predictions base on the logarithmic , this indicator shows how the supply works with only 21M bitcoins, unlike other commodities. Bitcoin is the most followed commodities on this indicator I rarely used.
Youve come here so far to know bitcoin, here is my chart for this year. It will keep Bitcoin hard to buy until it reached a million per coin, then the public regret it.
Keep the word DCA. Goodluck.
Holding it is the key.

$BTC dominance still progresses !bitcoin rsi and macd still is very dominant. aswell as the reversal that just happened in the past few hours.
i look to see 120k BTC by tuesday afternoon. at 1pm est time. considering all chart indications that i use. stay tuned and follow for more.
Order Block reached looking for a breakout to our Target of 132KWe saw a bottom when we hit just below 116 and 117 has been showing good support. Bulls are building up for a push up to a new high again. I have targets of 128-132K and the energy in the Fibs show we are likely going to break 160k this summer in the next few weeks or months.
A small pull back for Btc A small pull back for Btc , in the weekly it will look like a fake out but it’s a wait and see

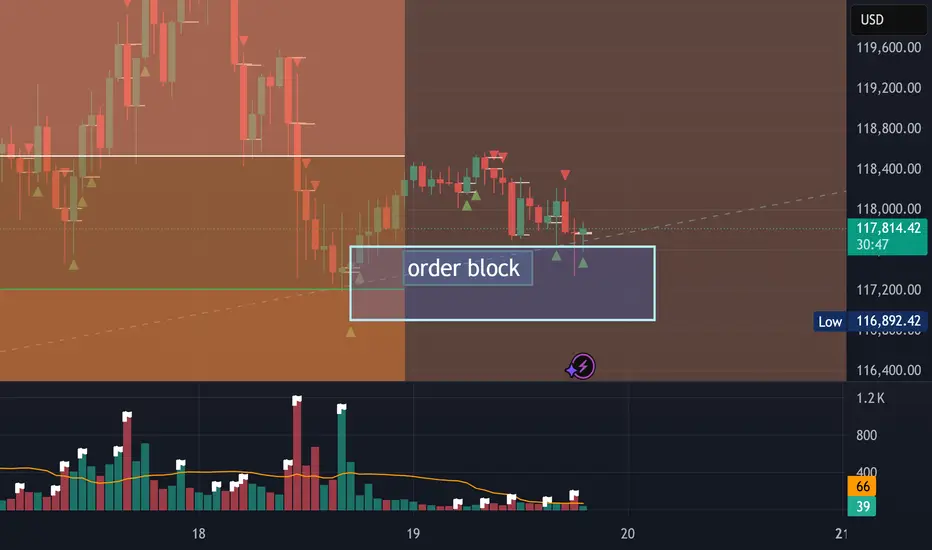
CRYPTO-BTCUSD-SHORT TERM- SELL-SCALP PREDICTIONThe market made an impulsive move to the downside Friday 7/18/25 starting at 2am, leaving a FVG on the hourly, Price has retraced back to the hourly FVG around 118,511, expecting the market to temporarily sell off before move back to the upside. First TP is 116,914.
