Bitcoin at the Crest of Structure - The Silence of Momentum.⊢
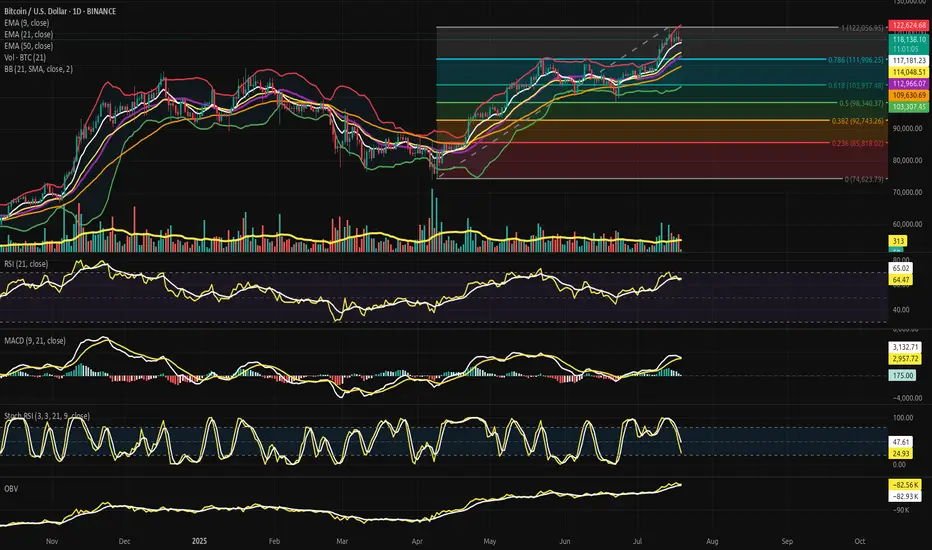
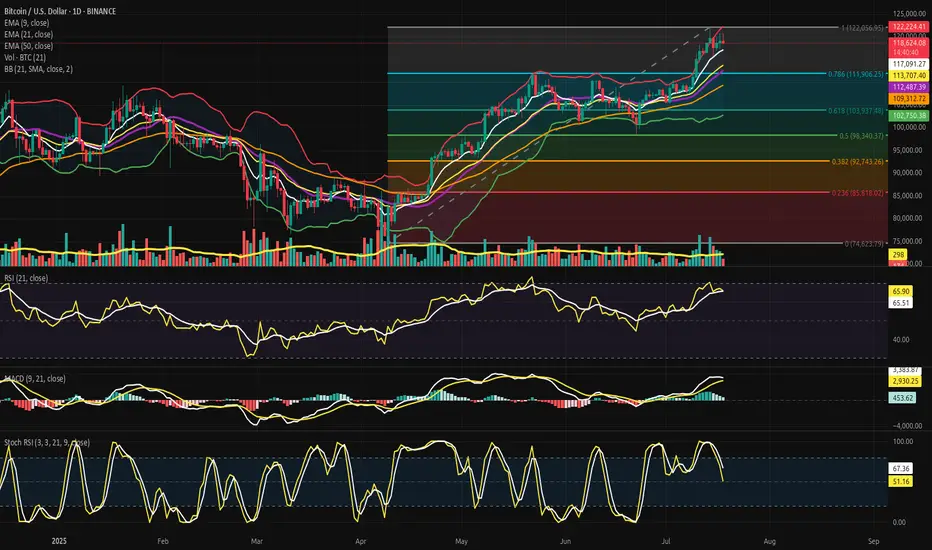
BTC/USD – BINANCE – (CHART: 1D) – (July 19, 2025).
◇ Analysis Price: $118,325.31
⊣
⨀ I. Temporal Axis - Strategic Interval - (1D):
▦ EMA9 - (Exponential Moving Average - 9 Close):
∴ Price is currently positioned above EMA9 at $117,218.67, confirming immediate bullish alignment;
∴ EMA9 is upward sloping and tightly hugging price candles, serving as the dominant intraday dynamic support;
∴ Every recent dip has been absorbed above or at EMA9, with no candle body close below it in the last 7 sessions.
✴️ Conclusion: Logic sealed - EMA9 holds command over short-term price structure; tactical momentum remains alive.
⊢
▦ EMA21 - (Exponential Moving Average - 21 Close):
∴ EMA21 currently rests at $114,658.53, forming the median layer of structural trend guidance;
∴ Price action remains significantly elevated above this level, showing that bulls retain medium-range control;
∴ EMA21 has not been tested since late June, reflecting a strong upside deviation from equilibrium.
✴️ Conclusion: Logic sealed - EMA21 serves as untested trend backbone; control remains firmly in favor of buyers.
⊢
▦ EMA50 - (Exponential Moving Average - 50 Close):
∴ EMA50 is currently located at $109,638.03, tracking long-range structural health;
∴ The moving average is gradually steepening, suggesting long-term strength and momentum acceleration;
∴ No violations or shadows have tested EMA50 since early May - reinforcing its strength as deep support.
✴️ Conclusion: Logic sealed - EMA50 anchors the structural uptrend; market remains far from long-term threat zone.
⊢
▦ Fibonacci Retracement – (1 = $122,056.95 / 0 = $74,623.79):
∴ The full Fibonacci range spans from the April low at $74,623.79 (0.0) to the July high at $122,056.95 (1.0) - anchoring the complete structure of the current macro move;
∴ Price is now positioned at $118,325.31, precisely above the 0.786 retracement level at $111,906.25, and beneath the 1.0 top - this zone represents the “golden upper quadrant,” a region where euphoria meets exhaustion;
∴ The 0.618 level ($103,937.45) remains untouched since early June, acting as the gravitational pull of equilibrium - its preservation confirms that no structural breakdown has occurred;
✦ Additional Level Mapping:
• 0.500 - $98,340.37: The neutral midpoint, remains far below - unchallenged;
• 0.382 - $92,743.26: The "warning belt" for medium-term trend decay;
• 0.236 - $85,818.02: A deep corrective zone, untouched and far from current price.
∴ Multiple zones of confluence exist between EMA21, BB midline, and 0.786, forming a strategic consolidation platform in the current price region;
∴ Failure to reclaim above 1.0 extension suggests bulls may be entering exhaustion while still structurally intact.
✴️ Conclusion: Logic sealed - price is trapped in the Fibonacci Gate (0.786 – 1.0); breakout requires decisive volume or reversion to golden support.
⊢
▦ Bollinger Bands - (SMA21 / 2 Standard Deviations):
∴ The current Bollinger structure shows band expansion, not contraction - upper band is at $122,653.00, lower band at $103,296.96, midline (SMA21) at $112,974.98;
∴ Price is moving above the midline, but no longer hugging the upper band - signaling that explosive momentum has waned while structure remains bullish;
∴ Last major push toward the upper band resulted in rejection near $122k, followed by sideways compression - implying the bands are preparing to resolve a volatility coil;
✦ Interpretative Observations:
• The midline (SMA21) is converging with the EMA21 and 0.786 Fib, forming a triple convergence layer - a key strategic battlefield;
• The distance between bands is approximately $19,356, indicating elevated volatility, but not chaos - directional tension remains unresolved;
• Band curvature suggests no imminent squeeze, but a potential for re-expansion if price reclaims upper territory.
∴ This structure shows a calm above chaos - volatility is present, but muted by the upper Fibonacci gate and internal exhaustion.
✴️ Conclusion: Logic sealed - volatility bands are wide and reactive, signaling buildup pressure; the next directional breach will likely define the next 30-day trend.
⊢
▦ Volume + EMA21 - (Volume Activity and Trend Average):
∴ The latest daily volume candle stands at 312 (unit scale), notably below the Volume EMA21, which trends around 418 - indicating waning participation post-breakout;
∴ The most recent breakout above $120k was accompanied by a singular spike in volume, followed by five consecutive days of volume decay - a typical exhaustion profile without follow-through;
∴ There has been no bullish volume expansion to defend price levels above $118k, suggesting that the upward move is unsupported by fresh demand;
✦ Tactical Observations:
• Volume is currently below the average trend line, which implies a lack of conviction on both sides - a vacuum state;
• The EMA21 of volume acts as a barometer of trend health - its breach to the downside indicates structural weakening beneath a seemingly bullish price;
• The low volume + high price condition signals silent divergence, often a precursor to compression, reversal, or manipulation.
∴ Price is elevated but unsupported, indicating the presence of “surface strength, internal fragility.”
✴️ Conclusion: Logic sealed - declining volume below trend average confirms demand fatigue; continuation is suspect without new influx.
⊢
▦ RSI (21) + EMA9 - (Relative Strength Index with Signal Smoothing):
∴ The RSI (21) reads at 64.72, having pulled back from a recent high near 74, suggesting a transition from euphoric thrust to reflective consolidation;
∴ The RSI line has dipped below its EMA9 signal, forming a soft negative crossover, typically interpreted as a waning of short-term momentum;
∴ Despite the loss of angle, RSI remains comfortably above the 50-line, which acts as the threshold between bullish continuation and structural deterioration;
✦ Interpretative Layers:
• The EMA9 of RSI functions here as a short-term momentum oscillator overlay - its breach confirms weakening, not reversal;
• RSI holding above 60 implies the presence of continued buy-side pressure - though fading;
• The divergence between price (near high range) and RSI (descending) establishes the groundwork for potential hidden weakness.
∴ RSI shows the archetype of a post-breakout exhaustion slope, yet refuses to break structurally - a signal of suspended momentum, not decay.
✴️ Conclusion: Logic sealed - momentum is cooling but not reversing; bulls remain structurally in control while energy dissipates.
⊢
▦ Stochastic RSI (3,3,21,9) - (Momentum Cycle Oscillator):
∴ The current values are: %K = 26.27, %D = 48.05 - showing a completed bearish crossover, with %K trailing beneath %D;
∴ The oscillator has already dipped into oversold (<20) and is now rebounding, yet fails to regain dominance over the signal line - this marks a failed bullish recovery pattern;
∴ Recent structure shows multiple failed attempts to reclaim high-band cycles, indicating that short-term traders are exiting, while major holders observe;
✦ Tactical Interpretations:
• The system has transitioned from bullish impulsive to corrective reflective - momentum is coiling instead of thrusting;
• The flattening of %D around the midline reflects indecision in micro-timeframe velocity;
• The double-rejection of %K near 80 last week forms a tactical top signal under stochastic doctrine.
∴ This oscillator, sensitive to short-term flows, declares the loss of tactical initiative by the bulls.
✴️ Conclusion: Logic sealed - short-term momentum cycle is decaying; the structure now favors consolidation or soft pullback.
⊢
▦ MACD (9,21) - (Moving Average Convergence Divergence):
∴ Current MACD line: (+2,961.80), Signal line: (+3,153.14) - indicating an active bearish crossover, as the MACD line has dropped below the signal;
∴ Histogram bars are negative and expanding, a key sign that downward momentum is growing, even as price remains elevated;
∴ This crossover has occurred at a relatively high amplitude, meaning the pullback potential is non-trivial - it is not a shallow fluctuation, but a structural transition;
✦ Structural Implications:
• The bearish crossover happened after divergence with price action - while Bitcoin reached new highs, MACD momentum did not, forming a classical bearish divergence;
• Momentum began decaying several sessions before price peaked - the indicator warned of exhaustion before price responded;
• The slope of the MACD line has steepened downward - a sign of gathering corrective force.
∴ This marks the first true warning from the momentum engine beneath the price - a shift from thrust to counter-pressure.
✴️ Conclusion: Logic sealed - MACD confirms structural momentum exhaustion; corrective forces are now in motion, though price has yet to reflect full impact.
⊢
▦ OBV + EMA9 - (On-Balance Volume with Trend Smoothing):
∴ Current OBV stands at (–82.93K), now below its EMA9, which reads (–82.57K) - indicating a loss of volume-weighted trend force from the buyers;
∴ While price remains elevated, OBV has been descending gradually, forming a clear bearish divergence between volume flow and price action;
∴ Over the last 7 daily sessions, OBV has failed to form any new high - even as BTC printed a new price peak - revealing that volume is silently exiting the market;
✦ Interpretative Reading:
• OBV below EMA9 confirms that cumulative volume pressure is negative - this undermines surface-level price strength;
• Divergence with price often precedes major pivot zones - the “hidden drain” effect;
• The OBV curve is now sloping downward with consistency, indicating that larger hands may be distributing while price remains deceptive.
∴ This structure carries the seal of silent distribution, a hallmark of late-cycle phases in bullish trends.
✴️ Conclusion: Logic sealed - OBV confirms internal outflow; market strength is no longer aligned with volume reality.
⊢
🜎 Strategic Insight – Technical Oracle:
∴ The 1D structural framework remains formally bullish, as price holds firmly above all exponential anchors (EMA9, 21, 50) and resides within the golden quadrant of the Fibonacci matrix;
∴ However, a triad of momentum signals - MACD, Stochastic RSI, and OBV - are all flashing early warnings of underlying exhaustion;
∴ The market breathes the air of height, yet the blood of energy runs thin;
∴ Volume no longer fuels ascent - momentum coils, not climbs;
∴ The surface remains calm, but the substructure contracts in silence;
∴ This is a phase of strategic suspension;
∴ Not yet a reversal - but no longer thrusting forward;
∴ A condition of uptrend fatigue, awaiting external force or internal reset.
✴️ Conclusion: The Oracle speaks - the trend is structurally preserved, but internally untrustworthy. The next move, when it comes, will be definitive.
⊢
▦ Structurally: Bullish.
∴ Price remains well above EMA50, EMA21, and EMA9;
∴ No bearish cross has occurred;
∴ Structure is elevated within upper Fibonacci zones - not broken.
⊢
▦ Momentum-wise: Bearish Divergence.
∴ MACD has crossed bearishly;
∴ OBV is declining despite price holding high;
∴ RSI and Stoch RSI confirm exhaustion.
⊢
✴️ Final Codex Interpretation:
∴ Structurally Bullish - Tactically Suspended;
∴ The frame holds, but the fuel has faded;
∴ Bulls possess the hilltop - but lack fire to advance;
∴ A breach or retreat shall define the next archetype.
⊢
⧉
· Cryptorvm Dominvs · MAGISTER ARCANVM · Vox Primordialis ·
⚜️ ⌬ - Wisdom begins in silence. Precision unfolds in strategy - ⌬ ⚜️
⧉
⊢
BTCUSD.PM trade ideas
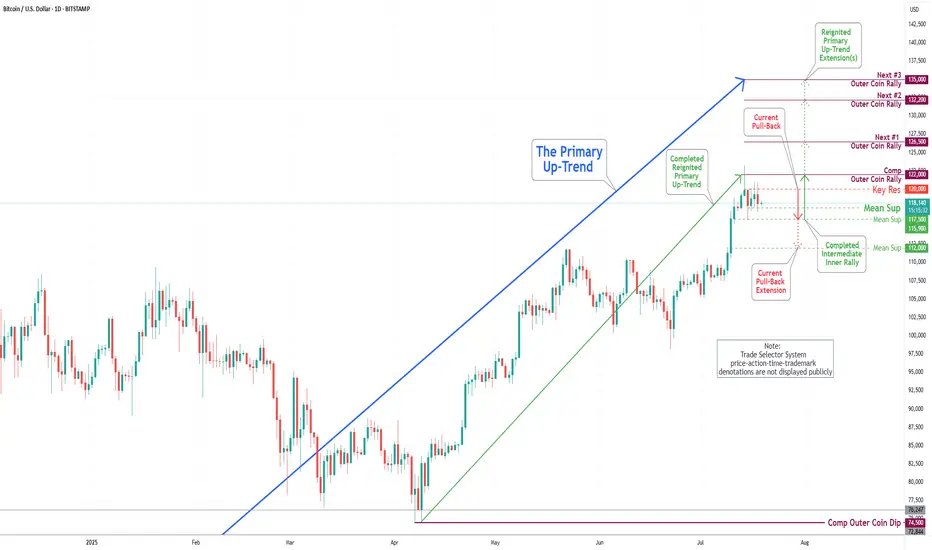
Bitcoin(BTC/USD) Daily Chart Analysis For Week of July 18, 2025Technical Analysis and Outlook:
In last week's trading session, we achieved a new historical high by completing our Outer Coin Rally at 122000. Following this milestone, the coin retraced, as expected, to the newly established Mean Support at 115900 and is currently trading at the Intermediate Mean Support at 117500. Presently, the coin is set to retest the Mean Support at 115900, with the potential for a further pullback to the Mean Support at 112000. This anticipated decline will necessitate a retest for the completed Outer Coin Rally at 122000. The designated targets for the renewed Primary Up-Trend are 126500, 132200, and 135000.
Bitcoin 2013 Fractal chart UPDATE = Nailed the PA target
Been posting this chart for the last few years and drew that Circle that PA hit, back in Feb..Way befppre PA arrived there.
I also drew that dashed Arrow line at the same time ad, as we can see frm the Daily chart beow, PA is bang on that line.
Why is it importnat that you know this ?
Because those Circles and Dashed lines are transposed from teh 2017 - 2021 fractal !
We do seem to have moved from one Fractal to another.
This has yet to be fully confirmed and the July Candle Close will certainly help identify this if we get a large green candle.
So, for now, we wait.
I will post more details about this later but fir now, if we follow this line, we can expect a cycle ATH of around 270K - 322K in Q4 2025
And then the BIG question is "What is next ?" because, as I have pointed out n another posts, we are also leaving a long term cycle (2009 - 2025 ) line of resistance....that we just broke free of...but need to remain above.
Judy is CRUCIAL

bitcoin is still bullishon the monthly and weekly time frame the bitusd price is going to make new highs than its previous

BTC 1H – Make or Break at SupportBitcoin has retraced into a previous demand zone after rejecting from local resistance. The 1H Stoch RSI is fully oversold, hinting at a potential bounce — but a clean break below $116K could send us down to the next base around $111K. Eyes on reaction here.

Quick SHORT (TIGHT STOP) After the bullish run up, looking for this to retrace and then consolidate until further notice

Bitcoin ($BTC): The Current Run Targets In Sight - 7/18/2025CRYPTOCAP:BTC has cleared all chart levels (listed), riding a textbook BCU (abc) wave to new highs! Momentum’s conservative, and abc targets are in sight: $127,845–$133,000. Let’s see how this unfolds at these levels!

Bitcoin Forecast 🔁 I use a unique time-based cycle method built around the universal law of 3-6-9:
3 = Impulse wave
6 = Correction
9 = Cycle end
we are at the higher time frame cycle 9
each cycle of the 3, 6 ,9
contain a smaller one 3 ,6 , 9
This isn’t just about charts — the number 9 governs all natural cycles:
Pregnancy, learning, lunar cycles, economic growth, etc.
---
🗓️ These are the key monthly turning points I track every year:
> Jan 8 – Feb 7 – Mar 6 – Apr 5 – May 5 – Jun 4 – Jul 2 – Aug 1 – Aug 31 – Oct 30 – Nov 29 – Dec 6
📍 This month, July 2nd was a critical time pivot. From there, Bitcoin entered a new time cycle.
📌 Time Is More Powerful Than Price
Most traders focus on price action, waves, or indicators…
But the reality? Time is the real market driver.
⏳ Entry signals based on time outperform those based on price.
Why? Because price is a reaction — time is the cause.

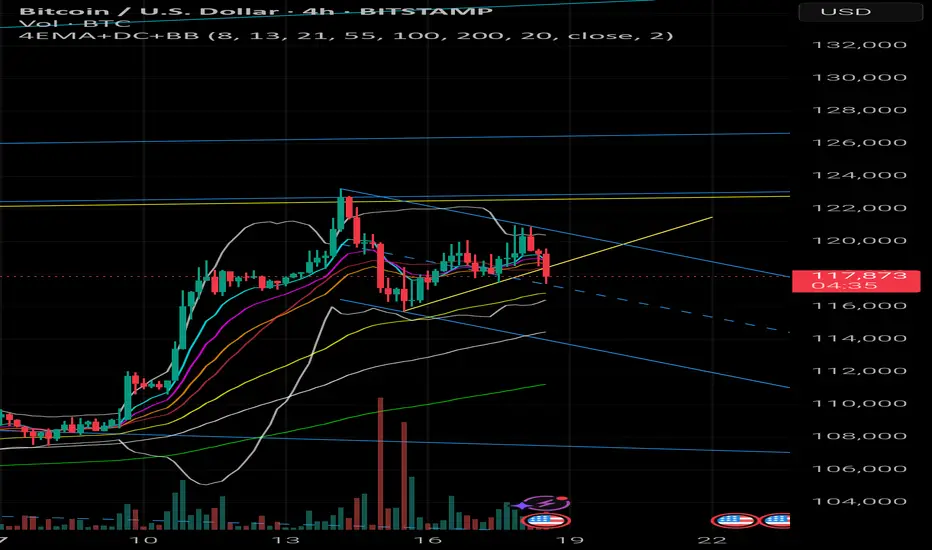
BTCUSD 4h – Chart updated with possible reaction zones📉 Channel adjusted to real price action.
Watching:
🔹 Top of the channel
🔹 EMA100
🔹 Flat base near 115.7
Just structure – no signal.
#BTC #CryptoTA #MarketLevels #DYOR
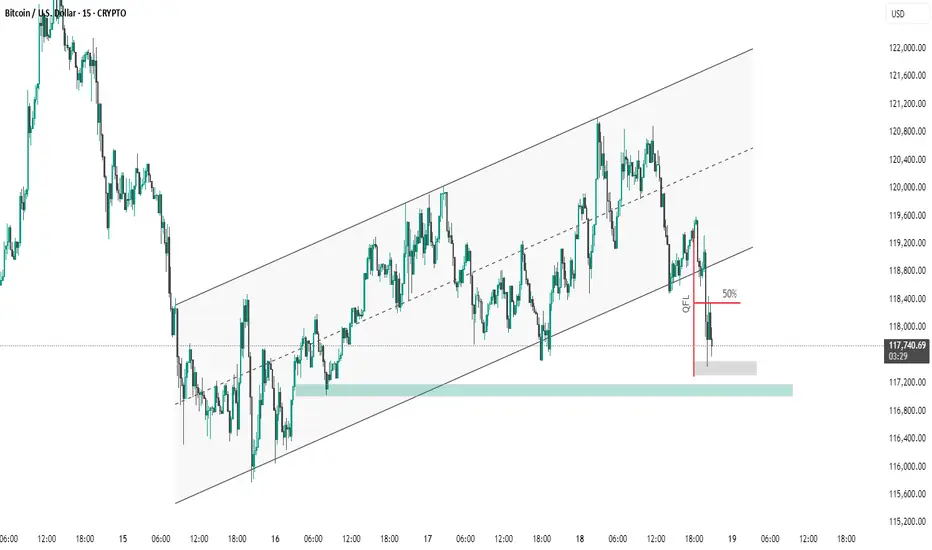
BTC #Short Note on BTC/USD (15-Min Chart):Short Note on BTC/USD (15-Min Chart):
Bitcoin recently broke down from an ascending channel, signaling a shift in momentum. After forming a QFL base, price failed to hold above the 50% retracement level and is now testing a key demand zone around $117,200. A bounce from this level is possible, but a breakdown below may open the path toward $116,000–$115,000. Short-term bias remains bearish unless the 50% level is reclaimed.
thanking you
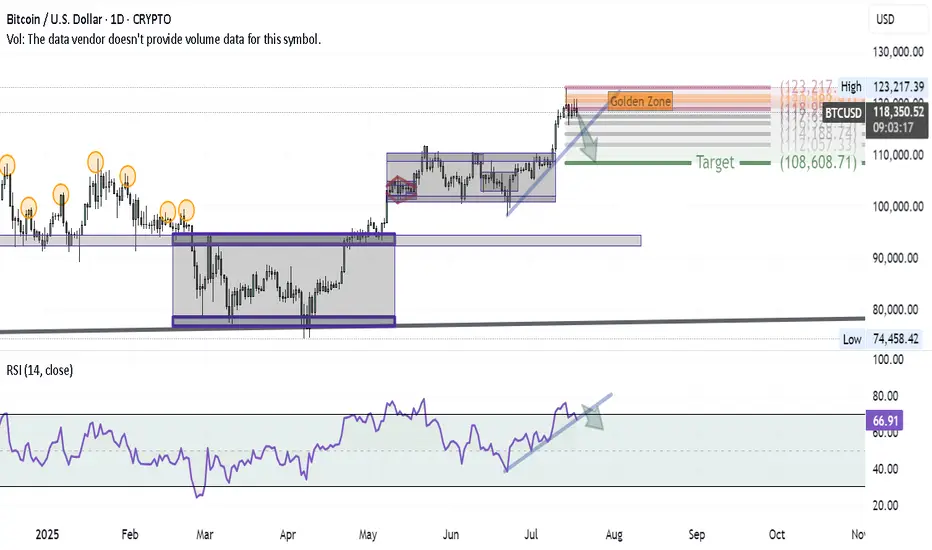
Bitcoin Correction Unfolding — First Wave in MotionAfter successfully hitting the BITCOIN target and anticipating a major correction in my previous ideas, here’s how the first wave of that correction is shaping up on the daily chart:
1- At the recent high, a Shooting Star candle formed — a classic reversal signal.
2- Using Volunacci analysis, the price retraced exactly to the Golden Zone, validating the first leg of the pullback.
3- The next step? A breakdown of the blue trendline would likely send us toward the Volunacci target at $108,600.
4- For confirmation, we're watching the RSI trendline — if it breaks down as well, it would strongly support the bearish continuation.
The setup is clean and developing as expected — it's all about following price and letting the chart guide the story.
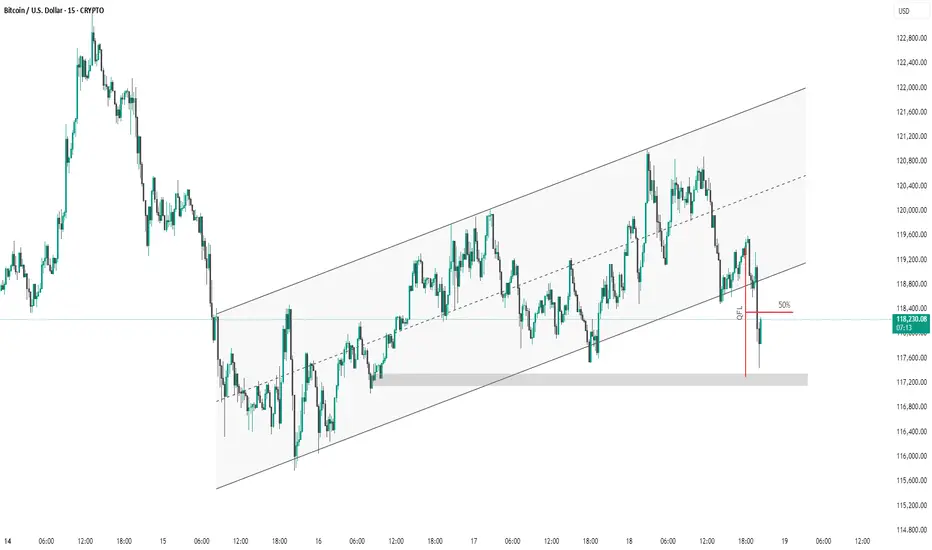
BTC #15-minute BTC/USD chart This 15-minute BTC/USD chart shows price action within an ascending channel. Recently, Bitcoin broke below the channel's midline and dipped to a key demand zone (highlighted in grey), triggering a liquidity grab (marked as "GFL"). Price has since retraced to the 50% level of the drop, which may act as resistance. A failure to reclaim the channel could indicate further downside.

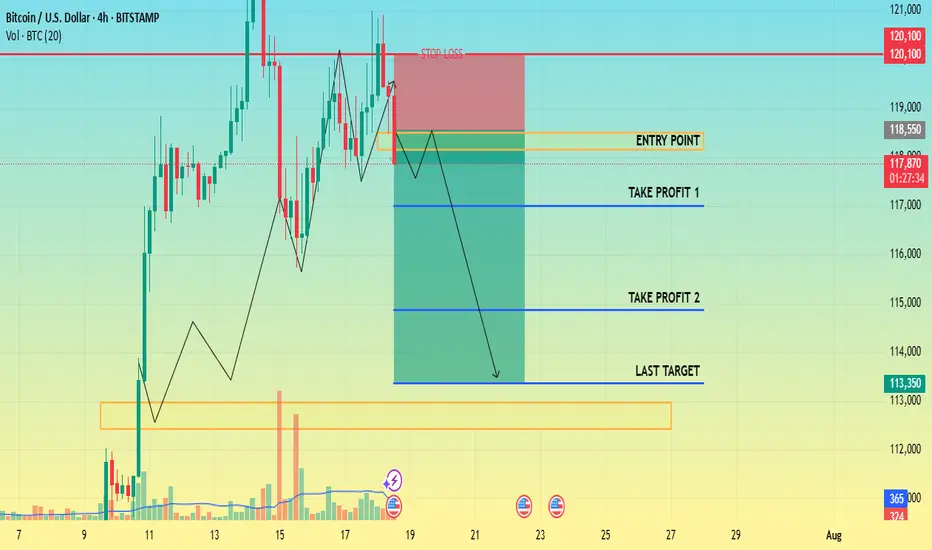
CHECK BTCUSD SIGNAL READ CAPTAINShort (sell)
Entry Point: Around 118500 118150
Stop Loss: Around 120100
🎯 Target Levels
Take Profit 1:
117000
Take Profit 2:
114850
Last Target:
113350
BitcoinBullish momentum short term based as the initial direction is bearish movement. With cot report indicationg long term bearish momentum.

Is Genius act , really genius ?!In my view GENIUS act is really harmful for crypto. It will force stablecoin issuers to buy a huge amount of U.S. treasuries/debt to stay in the U.S.
For the largest stable coin tether, we have two scenarios here:
1. Tether complies:
If the largest stablecoin, Tether, complies, the entire crypto market will become tightly bound to the U.S. economy. So, if the U.S. economy takes a dive, crypto will follow—hard. We already see correlation, but this will supercharge it.
On top of that, a crypto selloff could trigger one of these stablecoins to go bankrupt, forcing them to dump their U.S. treasuries, which would send shockwaves through the U.S. economy itself.
2. Tether refuses:
If Tether rejects this requirement, the U.S. might ban it. That could trigger a massive market crash. Worse, Tether might start to depeg from the dollar, like Luna did — and we all remember how that ended: absolute bloodbath.
Also it's fun to know how Chatgpt as an unbiased viewer thinks about genius act and it's relation with alt coins pump :
1. “Regulation = legitimacy” hopium
People see the GENIUS Act and think:
"OMG crypto is finally legal in the U.S. Let’s YOLO into everything that’s not a stablecoin!"
So even though the law targets stablecoins, it gives the illusion that altcoins are now “safe” to buy. Spoiler: they’re not.
2. USDC & Tether under pressure → people rotate into altcoins
Smart money’s thinking:
"If stablecoins get frozen or boring, let's ride the volatility wave elsewhere."
➡️ So they ditch stablecoins or high-cap BTC/ETH and ape into altcoins for bigger upside (or gambling addiction, whichever).
3. Low-cap alts pump on hype & narrative
Always happens. Whenever a big regulatory event hits:
ETH L2s pump (Polygon, Arbitrum)
Privacy coins get spicy (Monero, Zcash)
Meme coins go nuts (because why not)
Layer-1s and DEX tokens get love (Solana, Avalanche, Uniswap)
Everyone's front-running some imaginary future utility.
4. Retail sees green candles and FOMOs in
You know how it goes:
Twitter says “GENIUS Act = bullish for crypto”
TikTokers scream “ALT SEASON BABY 🚀”
People ape into garbage with 12 commas in the name
So prices go up. Until they don’t.
⚠️ WARNING: This pump is not based on fundamentals
It’s pure:
Misinterpretation
Speculation
Short-term rotation
a sprinkle of dumbass energy
It can reverse fast if market digests the actual legal implications.
Altcoins are pumping because people mistakenly think regulation = approval = pump season. Also because crypto traders have the attention span of a goldfish on Adderall.


BTC #15-minute Bitcoin (BTC/USD) chart This 15-minute Bitcoin (BTC/USD) chart shows price action within an ascending channel. Recently, the price broke below the midline and touched the lower channel boundary, bouncing back slightly afterward. A marked "QFL" (Quick Flip Level) zone with a 50% retracement is highlighted, suggesting a potential area of interest for buyers or a price reaction point. The shaded region indicates strong demand/support around the $117,200–$118,000 range. A breakdown below this support could signal further bearish momentum.
thanking you

Bitcoin at the Edge of the Fibonacci Gate - Silent Strain.⊣
⟁ BTC/USD - BINANCE - (CHART: 1D) - (Jul 18, 2025).
◇ Analysis Price: $118,866.60.
⊣
⨀ I. Temporal Axis - Strategic Interval - (1D):
▦ EMA9 - (Exponential Moving Average - 9 Close):
∴ EMA9 is currently positioned at $119,077.81, closely tracking the current price, acting as dynamic micro-support;
∴ The slope of EMA9 remains upward, with price consistently closing above it in the past sessions;
∴ Compression candles are forming above this line, suggesting it is being defended as a tactical floor.
✴️ Conclusion: EMA9 is structurally supportive, signaling short-term bullish control beneath compression.
⊣
▦ EMA21 - (Exponential Moving Average - 21 Close):
∴ EMA21 is placed at $118,537.29 and holds a clear upward slope;
∴ Recent pullbacks have tested the region near EMA21 but failed to close beneath it;
∴ EMA21 is establishing itself as the primary mid-range buffer zone within this bullish phase.
✴️ Conclusion: EMA21 confirms intermediate momentum preservation and mid-term trend integrity.
⊢
▦ EMA50 - (Exponential Moving Average - 50 Close):
∴ EMA50 is located at $116,804.80 and remains untouched during the current rally phase;
∴ The distance between EMA21 and EMA50 is widening, confirming structural momentum;
∴ This line now functions as the lower tier of the bullish envelope - a defensive anchor.
✴️ Conclusion: EMA50 reflects resilient bullish understructure and rising support basin.
▦ Fibonacci Retracement - (ATH = $122,056.95 / Low = $74,623.79):
∴ Price is currently positioned just under the 0.786 level, a classic tension zone before ATH retests;
∴ The 0.618 level has already been claimed and held as support, showing strength through key retracements;
∴ The market is coiling between 0.786 and 1.000 in preparation for decisive expansion or rejection.
✴️ Conclusion: BTC sits within the golden gate - structurally pressurized near final resistance thresholds.
⊢
▦ Bollinger Bands:
∴ Bands are visibly contracting, forming a volatility funnel around the current price zone;
∴ The price is maintaining proximity to the upper band without closing beyond it;
∴ The base band remains far beneath ($116k zone), indicating untriggered potential.
✴️ Conclusion: Volatility is compressing structurally; directional resolution is imminent.
⊢
▦ Volume + EMA21:
∴ Volume bars have declined steadily during this upper-range consolidation;
∴ EMA21 on volume confirms weakening participation relative to early July moves;
∴ Absence of breakout-volume suggests either stealth accumulation or passive stalling.
✴️ Conclusion: Volume behavior is non-confirmatory - the structure floats without conviction.
⊢
▦ RSI - (21) + EMA9:
∴ RSI(21) currently prints 60.45, above its own EMA9 at 59.41, suggesting net upward pressure;
∴ The RSI slope remains neutral-to-positive without entering overbought;
∴ The absence of bearish divergence confirms internal momentum coherence.
✴️ Conclusion: RSI structure is clean, moderate, and aligned with sustainable trend energy.
⊢
▦ Stochastic RSI - (3,3,21,9):
∴ K = 78.78 | D = 71.55 - both above 70, nearing the overbought ceiling;
∴ The fast line (K) shows minor inflection but no confirmed cross;
∴ Momentum is elevated, but historical context shows price can remain extended.
✴️ Conclusion: Momentum is entering saturation zone - caution on short-term exhaustion.
⊢
▦ MACD - (9,21):
∴ MACD line (540.52) remains above the signal line (414.93) in sustained bullish crossover;
∴ The histogram has begun flattening, indicating reduced acceleration;
∴ There is no bearish cross yet, but momentum build is slowing.
✴️ Conclusion: MACD supports bullish continuation, but thrust intensity is decaying.
⊢
▦ OBV + EMA9:
∴ OBV reads 71.13M and is currently flat, with no new highs in accumulation;
∴ EMA9 on OBV closely hugs the raw OBV line, confirming stagnation;
∴ Prior upward surges in OBV are not being extended, showing tactical pause in conviction.
✴️ Conclusion: Liquidity expansion has halted; OBV structure is tactically neutral.
⊢
🜎 Strategic Insight - Technical Oracle:
∴ The BTC/USD structure is entering a compressed apex between structural momentum (EMA stack, RSI, MACD) and tactical exhaustion signals (Stochastic RSI, Bollinger Band constriction, flattening OBV);
∴ Price is stabilizing just beneath the ATH gate ($122,056), indicating a threshold scenario - where breakout and rejection probabilities are approaching parity;
∴ Volume decline reflects the absence of forced participation, and suggests that the next move will be event-triggered or liquidity-engineered. The current environment favors volatility re-expansion, not trend reversal;
✴️ This is a threshold phase: structurally bullish, tactically suspended, awaiting ignition.
⊢
∫ II. On-Chain Intelligence – (Source: CryptoQuant):
▦ Exchange Netflow Total + EMA9:
∴ Current Netflow: -938 Bitcoins - sustained negative flow over time indicates coins leaving exchanges;
∴ Persistent outflows reflect holding sentiment and reduced immediate sell pressure;
∴ Price action shows historical upside alignment when netflows remain negative across clusters.
✴️ Conclusion: Exchange behavior signals macro holding bias, not liquidation cycles.
⊢
▦ Binary CDD + EMA9:
∴ Binary CDD has spiked into high activity zones in the past week, showing awakened dormant coins;
∴ This metric historically precedes localized tops when synchronized with weak flows;
∴ However, no consistent clusters are forming - signals remain scattered.
✴️ Conclusion: Binary CDD reflects isolated movements, not systemic awakening or distribution.
⊢
▦ Exchange Whale Ratio + EMA9:
∴ Current ratio hovers at ~0.62 - elevated but not extreme;
∴ Sustained whale activity near 0.60+ can precede volatility events;
∴ Trendline is rising since May, showing gradual uptick in dominance from top senders.
✴️ Conclusion: Whale activity is tactically elevated, implying latent strategic intent.
⊢
▦ Supply-Adjusted Dormancy + EMA9:
∴ Dormancy values are near historical lows, indicating old coins are staying inactive;
∴ EMA9 confirms a downward trend in dormant supply movement;
∴ Long-term holders are not distributing at this level.
✴️ Conclusion: Structural dormancy supports holder conviction - no exit signals from old supply.
⊢
▦ Realized Cap + EMA9:
∴ Realized Cap is now exceeding $1T, rising consistently without parabolic spikes;
∴ EMA(9) and line are in lockstep - a healthy ascent;
∴ No acceleration = no blow-off = sustainable revaluation.
✴️ Conclusion: Value accumulation remains organic, not euphoric.
⊢
▦ MVRV Ratio + EMA9:
∴ MVRV sits at 2.36 - below historical overvaluation levels (>3.0);
∴ EMA(9) confirms gradual slope upward, consistent with price;
∴ Ratio is not overheated - risk/reward remains structurally favorable.
✴️ Conclusion: MVRV indicates non-euphoric regime - mid-phase of value appreciation.
⊢
▦ BTC vs GOLD vs S&P500 - (BGemetrix Comparative Graph):
∴ BTC continues to outperform both GOLD and SPX in long-term slope, even after corrections;
∴ Current phase shows GOLD flattening and SPX slightly lagging BTC in verticality;
∴ This divergence hints at BTC leading in speculative rotation while traditional assets stabilize.
✴️ Conclusion: BTC holds macro-dominance position, operating as the apex volatility proxy in current intermarket structure.
⊢
🜎 Strategic Insight - On-Chain Oracle:
∴ Despite short-term compression, the on-chain structure reveals no distribution threats;
∴ Holder conviction, realized valuation, and MVRV slope all suggest controlled structural appreciation, not mania;
∴ Whales are tactically present, but dormancy and exchange flows confirm no mass exit;
∴ This is an internally coherent, tactically patient regime.
✴️ Bitcoin is preparing, not peaking.
⊢
𓂀 Stoic-Structural Interpretation:
▦ Structurally Bullish - Tactically Suspended:
∴ All key EMA's (9/21/50) are stacked and rising; price remains elevated yet non-parabolic;
∴ Fibonacci apex is active, with price compressing beneath the ATH zone ($122,056), not retreating;
∴ On-chain intelligence confirms long-term conviction, with no distribution from whales or dormants.
✴️ Conclusion: The system retains structural strength; pressure is latent, not expired. The architecture is bullish, not euphoric.
⊢
▦ Tactical Range Caution:
∴ Stochastic RSI and MACD show early-stage exhaustion;
∴ Volume has declined into apex, favoring liquidity traps or volatility bursts;
∴ Whale Ratio elevation implies pre-positioning behavior, not public confirmation.
✴️ Conclusion: Tactical maneuvering is dominant. Breakout potential exists but is not trustable until confirmed by volume and displacement.
⊢
⧉
Cryptorvm Dominvs · ⚜️ MAGISTER ARCANVM ⚜️ · Vox Primordialis
⌬ - Wisdom begins in silence. Precision unfolds in strategy - ⌬
⧉
⊢
BTCUSD 7/18/202590min BOS to the downside has just occurred on the 3rd day of Price trading inside of the 7/14 Bearish Engulfing. Now we may encounter another Bearish leg which in fact is just still the Daily Bearish Retracement.
_SnipeGoat_
_TheeCandleReadingGURU_
#PriceAction #MarketStructure #TechnicalAnalysis #Bearish #Bullish #Bitcoin #Crypto #BTCUSD #Forex #NakedChartReader #ZEROindicators #PreciseLevels #ProperTiming #PerfectDirection #ScalpingTrader #IntradayTrader #DayTrader #SwingTrader #PositionalTrader #HighLevelTrader #MambaMentality #GodMode #UltraInstinct #TheeBibleStrategy

BTCUSDA Mini buy for btcusd targeting a R:R OF 1:2, although the overall trend is a sideways market favoring the downside over the upside. this buy opportunity is worth taking based on shift in market structure and we have a double bottom and order block retest. we will need a major retracement before we have our continuation sell.

BTC wave structure analysis on 4 hour and daily timeframe- Daily time frame, after price gave stop hunting signal, price increased again.
- On the 4-hour time frame, the price broke through the strong peak and gave a bullish reversal signal.
- So there is a high possibility that BTC will continue to rise and break the previous top.

