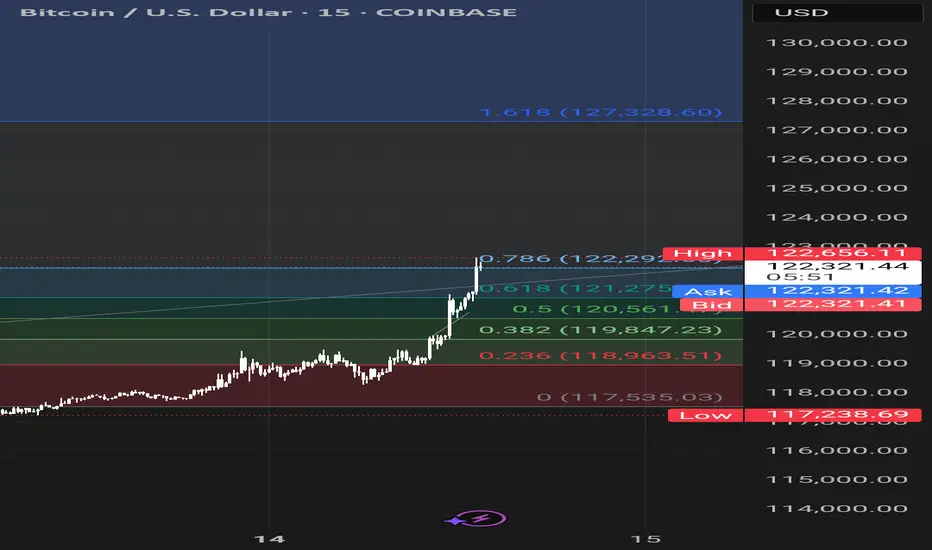
BTC CME Bearish GAPA gap to be filled in the Bitcoin CME Future at 114,000
Break of 120500 will open the door for 118,000 then 114,000 next.
I reckon buyers will pop-in near 114,000
BTCUSD.PM trade ideas

Bitcoin's Blue SkyBitcoin just closed another weekly candle near its highs – and this one confirmed what the last few were hinting at: the bulls are fully in charge. Price exploded through the \$112,000 resistance level, turned it into support, and barely looked back. The move wasn’t subtle either – it was loud, confident, and backed by a strong candle with virtually no upper wick. That tells you all you need to know: there’s no hesitation here, just buyers pushing price higher. If this were a poker game, Bitcoin just went all-in on momentum, and no one at the table seems brave enough to call its bluff.
Even more impressive is how clean the breakout structure looks. After consolidating under \$112K for weeks, BTC finally made its move, leaving behind a textbook support/resistance flip. As long as that zone holds, the path of least resistance is clearly up. There’s no major historical resistance overhead, which means we’re officially in price discovery – that magical place where technicals matter less and raw sentiment takes the wheel. The music is playing, and Bitcoin’s dancing like no one’s watching.
Volume has been quietly rising, even if it’s not screaming just yet. That’s a sign of real interest – not a frenzy, but sustained institutional nibbling and long-term conviction. The 50-week moving average is lagging far behind (hovering somewhere in the \$80K range), which tells you how strong this trend really is. That line’s not catching up anytime soon – it’s gasping for air while price is sprinting ahead.
Could we get a pullback? Sure. That’s always on the table. But unless BTC fumbles back below \$112K, the bulls aren’t just in control – they’re rewriting the rules. Next major psychological zones are \$125K, \$130K, and \$135K, and with each passing week, they’re looking less like distant targets and more like stepping stones. Buckle up.

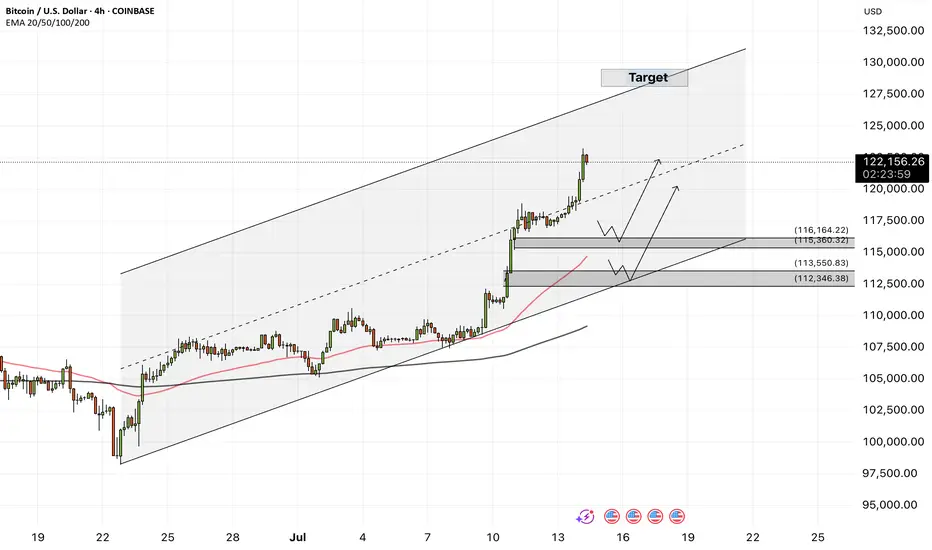
Bitcoin - Bitcoin, Unrivaled in the Market!Bitcoin is above the EMA50 and EMA200 on the four-hour timeframe and is in its ascending channel. Bitcoin’s current upward momentum has the potential to reach the target of $130,000. If it corrects, Bitcoin buying opportunities can be sought from the specified demand zones.
It should be noted that there is a possibility of heavy fluctuations and shadows due to the movement of whales in the market and compliance with capital management in the cryptocurrency market will be more important. If the downward trend continues, we can buy within the demand area.
In recent days, Bitcoin has managed to set a new historical high by crossing the $118,000 level; a jump that followed the strong accumulation of institutional capital, the upward trend of spot ETFs and the remarkable consolidation of such indices. This growth is not only the result of technical conditions or short-term market excitement, but is a clear reflection of the structural maturity of the Bitcoin ecosystem in the second half of 2025. A careful and comprehensive examination of the fundamental parameters shows that Bitcoin is moving differently than in the past: slower, but with much stronger support. On the other hand, more than $205 million in Bitcoin short selling positions have been liquidated following the jump in the price of Bitcoin and its crossing the $122,000 level.
First, the flow of investment from Bitcoin spot ETFs has broken records over the past week. In one day, more than $1.18 billion entered these funds, and the total annual inflow of these financial instruments has reached more than $51 billion. This is while ETFs such as IBIT (managed by BlackRock) and FBTC (managed by Fidelity) are attracting hundreds of Bitcoins daily, without causing any negative divergence in price indices. This phenomenon clearly shows that the participation of institutional investors through regulated channels is not only stable, but also accelerating. Along with this flow of capital, the parameters of the chain also paint a picture of a market with a balance of supply and demand. The MVRV ratio, an indicator for measuring market profitability, fluctuates between 2.2 and 2.34, meaning that the market is in a reasonably profitable state, but is still some way from the warning zone of profit saturation. Meanwhile, long-term holders (LTHs) are also continuing to accumulate. Long-term wallet holdings have reached a record high of 14.7 million BTC, representing nearly 70% of the total supply. In the last quarter alone, more than 13,000 BTC have been added to this group’s reserves.
On the other hand, the SOPR indicator, which measures realized profit ratio, shows that profit-taking is taking place at a gentle slope in the market, away from heavy selling pressure. This logical trend of profit-taking is a testament to mature investor behavior. Bitcoin flows to exchanges are also at very low levels; Bitcoin held on exchanges now account for just 1.25% of the total supply—the lowest level in over a decade. This significant reduction in potential selling pressure has kept Bitcoin’s price stable in the face of short-term volatility.
Behaviorally, the market is also showing signs of maturation. The number of daily active addresses has remained stable, but unlike during the buying frenzy, we are no longer seeing retail traders rushing into exchanges or mass wallet outflows. In other words, on-chain activity has stabilized, similar to the behavior of traditional mature markets—markets driven by data and structure, not emotion. From a macro perspective, the outlook for Bitcoin in the medium term is also positive. Many analysts and institutions, including Global X ETFs, see Bitcoin’s growth to $200,000 within the next 12 months as achievable. Technical analysis from some sources has also outlined the $140,000 range as the next price target in the next 100 days, provided that the VIX volatility index remains low and macroeconomic data maintains its current trajectory. However, a more conservative scenario sees a price consolidation in the $95,000-$100,000 range if geopolitical pressures increase or ETF inflows weaken.
Overall, Bitcoin is moving ahead in the summer of 2025 not only on the back of crypto market excitement, but also on the back of strong fundamentals and structured institutional capital inflows. Accumulation by long-term holders, a steady decline in supply on exchanges, a reasonable profit-taking balance, and a formal investment structure via ETFs have all combined to bring the market to a stable state and ready for further increases. If this trend holds, levels of $125,000-$140,000 in the short term, and a range of $180,000-$200,000 by the end of the year, are not far off!
On the other hand, BlackRock’s Bitcoin ETF (IBIT) managed to record the fastest growth in history among all ETFs, surpassing $80 billion in assets in just 374 days! For comparison, it should be noted that the S&P500 Index ETF needed about 5 times this time! BlackRock now holds about 706,000 Bitcoins (equivalent to 56% of the total ETF share).
BTC PRICE PROJECTION ANALYSIS. HOW MUCH FURTHER UPSIDE???In this video, I'm just excited to see the cup and handle analysis done on October 19th, 2024 reach it's target. It's amazing!
I decided to do some predictive analysis using Elliott wave concept and Fibonacci extensions to see how far Bitcoin will go.
I am convinced that on the timeframe analyzed, this is onto a wave 5 and so pullbacks are going to be a great opportunity to grab some while a lot people will think this is madness.
My cup and handle analysis and targets getting hit has taught me a great lesson to always look at the bigger picture while taking advantage of the micro view.
Cheer to all the longs and Bitcoin believers. With only 1.11 Million Bitcoin available for grabs and Institutional confidence behind the asset, I am confident the projected price targets are highly likely and in sight soon.

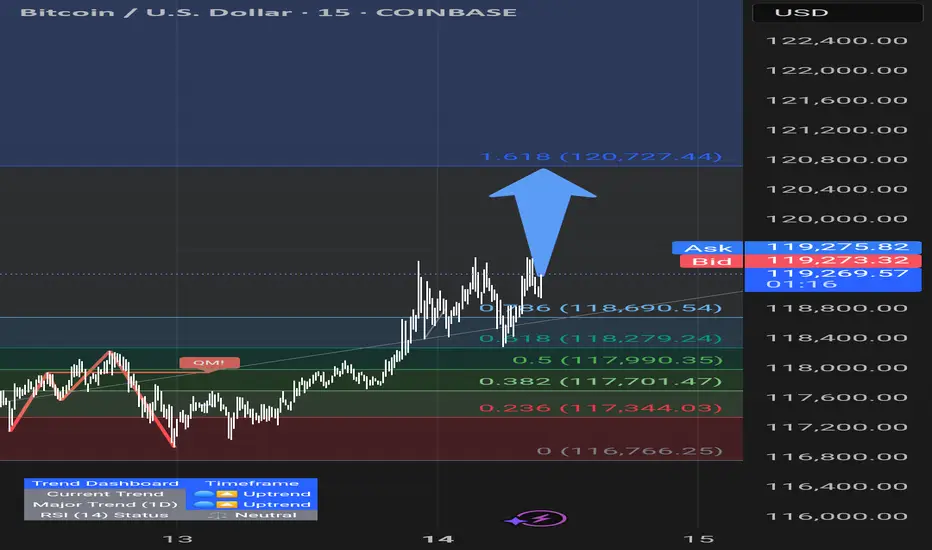
127KMorning folks,
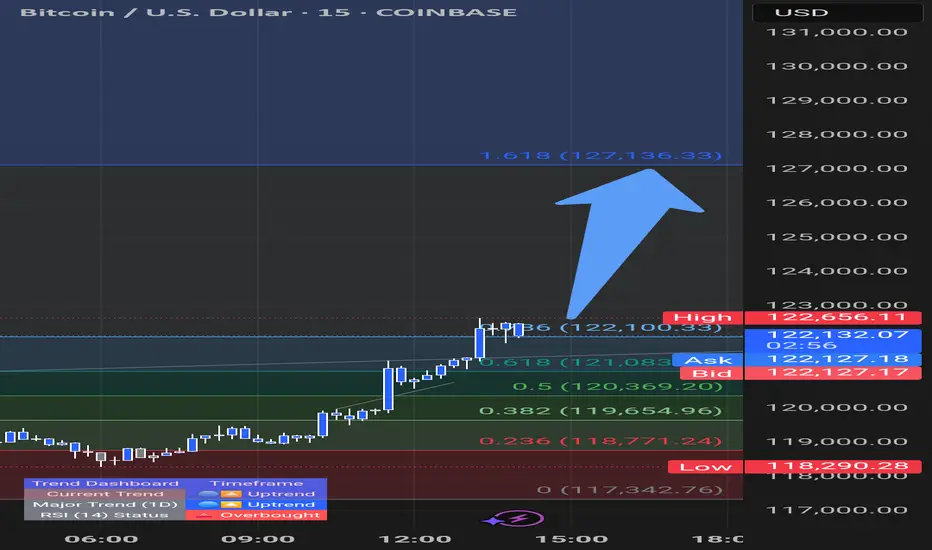
So, BTC shows even better performance that we thought, although it obviously something stands behind, this is not market-natural motion. Anyway, we consider 127K level as all-time nearest target that stands on monthly chart.
If any pullback starts (BTC now is at daily overbought and near Yearly Resistance Pivot), we keep an eye on 117.2K and 113.5K levels to decide on long entry

BTUUSD ASIAN HIGH/LOW LIQUIDITY PURGESweeps often happen early in the London session
Price reverses back inside the range or moves strongly in opposite direction.

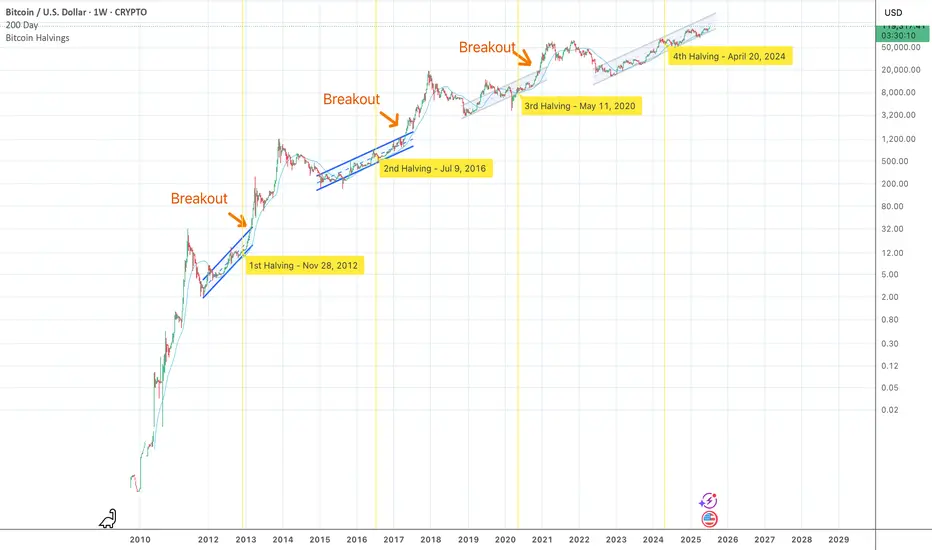
BTC: Next price Halving 📊Analysis by AhmadArz: #BTCUSD
By calculating the price growth in the 4-year halving time frame, we came to the conclusion that with the growth of the Bitcoin market cap, its growth will be halved and we can expect $120,000 from Bitcoin, and it is expected to grow up to 270,000 dollars in halvings.
🔗"Uncover new opportunities in the world of cryptocurrencies with AhmadArz.
💡Join us on TradingView and expand your investment knowledge with our five years of experience in financial markets."
🚀Please boost and💬 comment to share your thoughts with us!

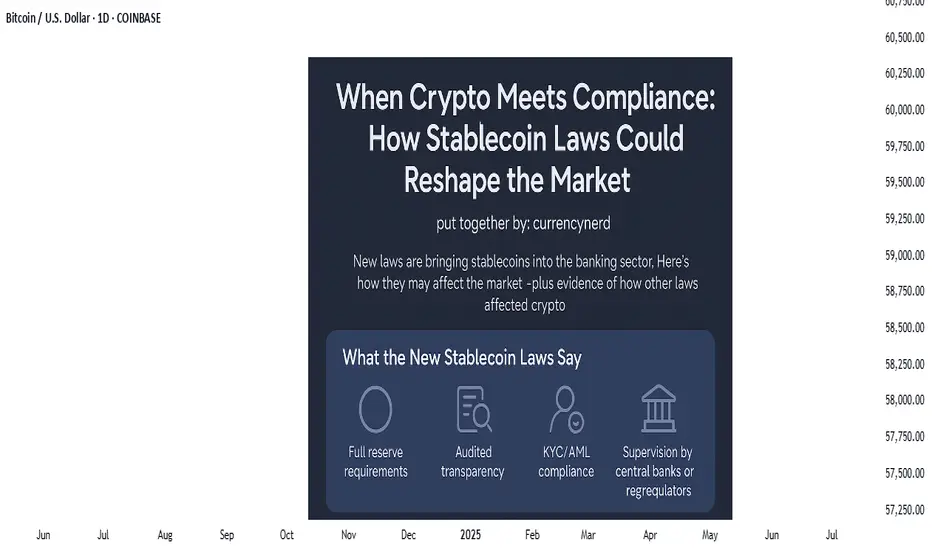
watch the laws, not just the charts.stablecoins were once the rebels of finance—anchored to fiat yet untethered from traditional banking laws, but the tides are turning. Across major economies, lawmakers are drawing up legal frameworks that place stablecoins inside the banking sector rather than outside of it. This shift could be the most pivotal regulatory development since Bitcoin was born.
But what does this really mean for traders, investors, and markets?
In this @TradingView blog we’ll unpack the new laws on stablecoins entering the banking realm, and what their ripple effect might look like, using past regulatory shifts as a lens to foresee market behavior.
🧾 Section 1: What the New Stablecoin Laws Say
Many regions—especially the EU, UK, Japan, and the US—are moving toward a model where stablecoin issuers must register as banks or hold full banking licenses, or at minimum, comply with banking-like oversight.
Key pillars of these laws include:
Full reserve requirements (1:1 backing in liquid assets)
Audited transparency on reserves and redemptions
KYC/AML compliance for users and issuers
Supervision by central banks or financial regulators
In the US, the House Financial Services Committee recently advanced a bill that would make the Fed the ultimate overseer of dollar-backed stablecoins.
In the EU, MiCA (Markets in Crypto-Assets) requires issuers of e-money tokens to be regulated financial institutions.
Japan now allows banks and trust companies to issue stablecoins under strict regulations.
💥 Section 2: Why This Is a Big Deal
Bringing stablecoins into the banking system could change how liquidity flows, how DeFi operates, and how capital moves across borders.
Potential market impacts:
Increased trust = more institutional money entering stablecoins and crypto markets.
DeFi restrictions = protocols may face scrutiny if they allow unverified stablecoin usage.
Flight from algorithmic or offshore stables to regulated, bank-issued stablecoins (e.g., USDC, PYUSD).
On-chain surveillance increases, potentially limiting pseudonymous finance.
Think of it as crypto’s "Too Big To Ignore" moment—where stablecoins become infrastructure, not outlaws.
📉 Section 3: Past Laws That Shaped Crypto Markets
Let’s examine how previous regulations have affected crypto markets—offering clues about what to expect.
🧱 1. China’s Crypto Ban (2017–2021)
Kicked off a massive market crash in 2018.
Pushed mining and trading activity overseas, especially to the US and Southeast Asia.
Resulted in more global decentralization, ironically strengthening Bitcoin’s resilience.
🪙 2. SEC Lawsuits Against XRP & ICO Projects
Ripple’s XRP lawsuit caused delistings and volatility.
Set a precedent for how tokens are treated under securities law.
Resulted in more structured token launches (via SAFEs, Reg D, etc.).
🧮 3. MiCA Regulation in Europe (2023 Onward)
Provided regulatory clarity, prompting institutions to engage more with regulated entities.
Boosted legitimacy of Euro-backed stablecoins like EURS and Circle’s Euro Coin.
Sparked a race among exchanges to gain EU registration (e.g., Binance France, Coinbase Ireland).
Each of these regulatory waves caused temporary volatility, followed by long-term growth—as clarity invited capital.
📊 Section 4: The Possible Scenarios for the Market
Here’s how things might play out as stablecoin laws become mainstream:
Golden Path-Regulated stablecoins coexist with DeFi; innovation meets compliance - Bullish for crypto adoption and capital inflows.
Walled Garden-Only bank-issued stablecoins are allowed; DeFi stifled -Neutral or bearish short-term, bullish long-term.
Backlash-Overregulation pushes stables offshore or into non-compliant zones - Bearish, liquidity fragmentation returns.
🔍 Nerdy Conclusion:
Stablecoins are no longer just tools for traders—they’re becoming the backbone of digital finance. Their formal entrance into banking law marks a turning point that traders must understand.
While regulation has historically caused short-term fear, it often leads to long-term maturity in crypto markets. The stablecoin laws now in motion could unlock the next chapter of institutional adoption, cross-border finance, and perhaps, the integration of crypto into the real-world economy at scale.
💡 Nerdy Thought:
When a technology becomes systemically important, it stops being ignored—it gets integrated. Stablecoins have reached that level.
put together by : @currencynerd as Pako Phutietsile
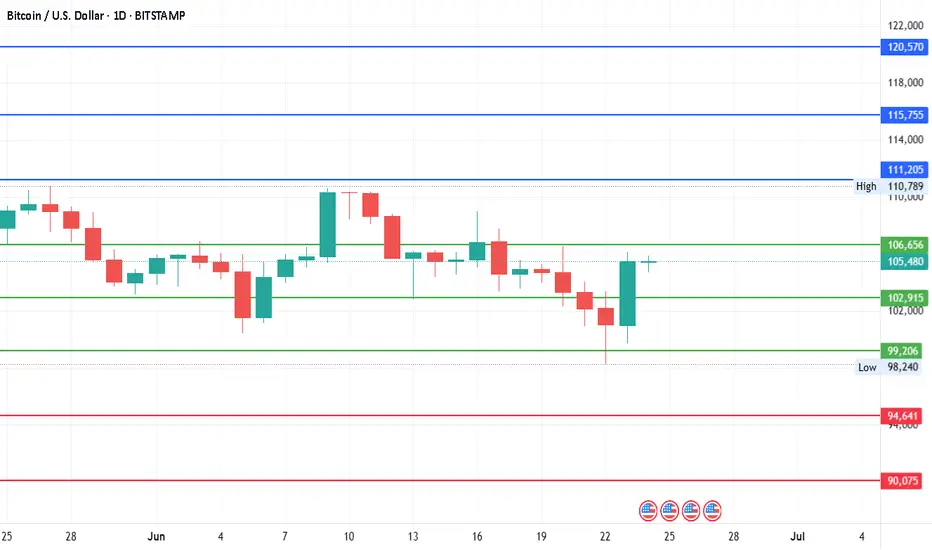
#Bitcoin - Pivot is $102915 | Target $125385 or $80445 ?Date: 24-06-2025
#Bitcoin
Current Price: 105375
Pivot Point: 102915.00 Support: 99206.48 Resistance: 106655.63
#Bitcoin Upside Targets:
Target 1: 111205.31
Target 2: 115755.00
Target 3: 120570.00
Target 4: 125385.00
#Bitcoin Downside Targets:
Target 1: 94640.74
Target 2: 90075
Target 3: 85260
Target 4: 80445.00
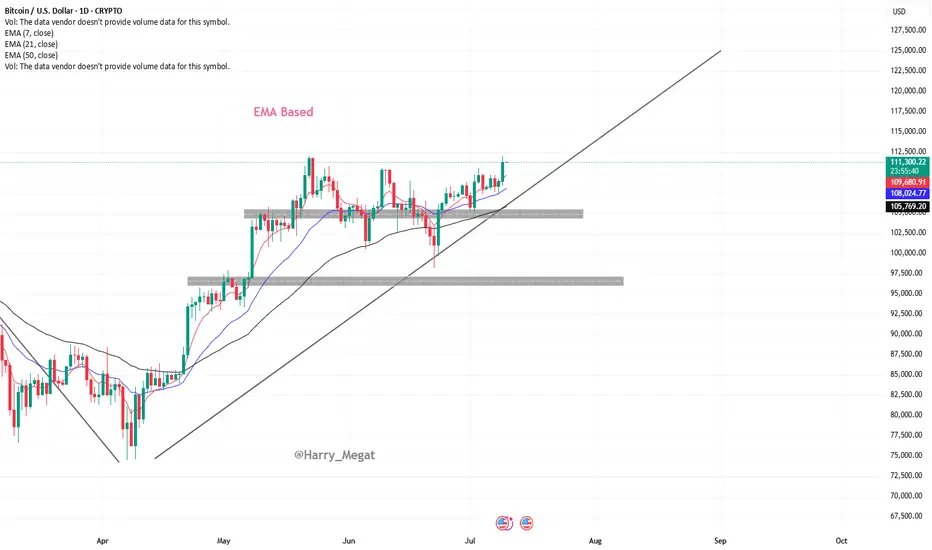
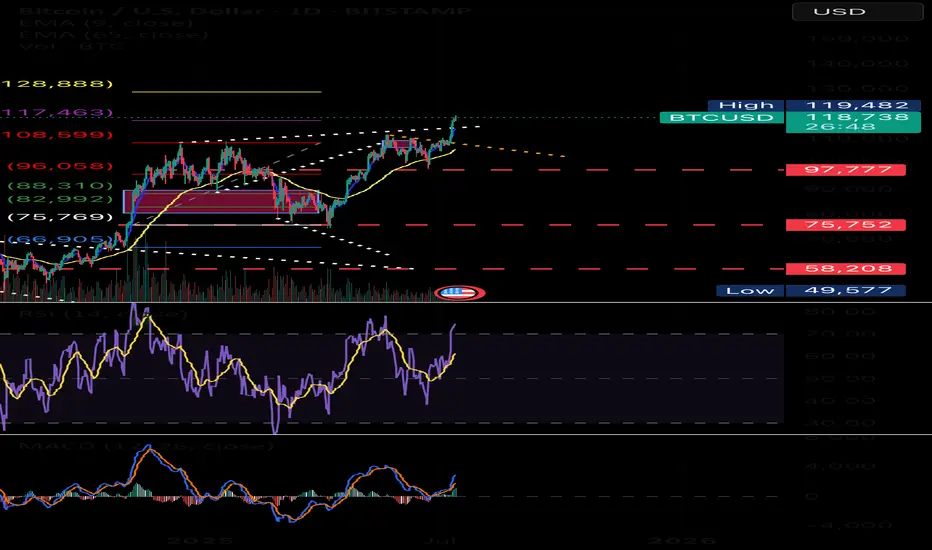
BTCUSD Chart Analysis (Daily Timeframe)Chart Analysis – BTC/USD (Daily Timeframe)
Trend Overview:
* The chart shows **Bitcoin (BTC/USD)** on the **daily timeframe**.
* Price is in a **clear uptrend**, making **higher highs and higher lows**.
* The recent breakout above **\$111,000** suggests a **bullish continuation**.
Moving Average Analysis (EMA 7, 21, 50):
* **EMA 7 > EMA 21 > EMA 50** — this alignment confirms **strong bullish momentum**.
* Price is **well above all EMAs**, especially the 50 EMA (\~\$105,546), showing trend strength and possible institutional support.
* EMAs are **sloping upward**, which further confirms the upward momentum.
Recent Breakout:
* BTC broke out of a **short-term consolidation zone** between \~\$108,000–\$111,000.
* Today’s candle shows a **strong bullish close**, indicating fresh buying interest.
* If this breakout holds, price could extend toward the **next psychological level of \$115,000–\$117,500**.
Support Zones to Watch:
* **Minor support:** \~\$109,000 (EMA 7 + breakout retest area)
* **Stronger support:** \~\$105,500 (EMA 50 and previous swing low)
A break below **\$105,500** could signal a trend shift or deeper pullback.
Summary:
Bitcoin is showing **strong bullish structure** on the daily chart with EMAs aligned upward and a recent breakout above \$111,000. If momentum holds, next upside targets are around **\$115,000–\$117,500**. The bullish trend remains intact unless price breaks and closes below **\$105,500**.
Bitcoin May Continue Rising After Breakout📊 Market Overview:
• Bitcoin recently broke above $118,000, reaching a weekly high of $118,740, fueled by expectations of a Fed rate cut in September and strong ETF inflows into the market
• Katie Stockton from Fairlead Strategies highlights a bullish cup-and-handle pattern, supporting a potential 14% upside toward $134,500
📉 Technical Analysis:
• Key Resistance: $120,000 – $128,500 (based on Fibonacci projection).
• Nearest Support: ~$108,300 – previous resistance turned support, along with ~$107,000 near the 50-day EMA.
• EMA 09: Price is trading above the 9-day EMA, indicating a short-term bullish trend.
• Patterns & Volume:
o A cup-and-handle breakout suggests continued upside potential.
o Rising volume on breakouts reflects strong buying interest.
o MACD is bullish, and RSI is not yet overbought — allowing further room to rise.
📌 Outlook:
Bitcoin may continue to rise in the short term if it holds above the 9-day EMA and avoids a sharp drop below the $108k–110k support zone. A break below this area could trigger a deeper correction toward $100k.

Update on BTC Fan Chart.TradingView wouldn't let me update my last idea, but this fan chart still amazes me.
The breakout has played out very well. The vertical line indicates US Congress budget bill date.
BTCUSDA short term Long biased although we favor the down side rather than the upside but we are trying to make some entry before we see major price retracement

Inverted BTC tells the full storyahhh here we are again bulls with the same playbook late in the cycle. we will see 40k before 200k
$BTC 🚨 Bitcoin bullishness might be more than hype…
It could be a signal that investors are protecting assets inside liquidity pools, anticipating an interest rate cut soon. 💰
top in november and bottom early 2027?top in november and bottom early 2027?
I market out the exact top on the weekly
and exactly 364 days after that that was the exact weekly candle bottom in the bearmarket
and after 1064 days after the bottom that was the approximate top
would bring us to a top in november and bearmarket bottom early 27

BITCOIN 2025 - THE LAST HOPECRYPTOCAP:BTC currently finds itself at the intersection of geopolitical tensions and broader macroeconomic uncertainty. Although traditionally viewed as a hedge against systemic risk, it is presently exhibiting characteristics more aligned with high-risk assets. The FED's forthcoming policy decisions will likely play a pivotal role in determining whether Bitcoin stabilizes or experiences further downward pressure.
The chart represents the most optimistic scenario for Bitcoin to date

Bitcoin Still in Up-Trend Channel, Bubble Still AheadAs of July 2025 Bitcoin trades near $120 000 and every weekly close since the November 2022 low has stayed inside the same rising log-channel. The channel’s upper rail is ≈ $170 000 today and should reach ≈ $230 000 by December. A decisive breakout requires a weekly close above that rail. In previous cycles the breakout came almost exactly at the prior all-time high, but this time the 2021 ATH of $69 000 was reclaimed while price was still inside the channel. The trigger is therefore less obvious; yet if price finally closes beyond the rail, a new exponential leg is expected to begin.
Two structural shifts explain the delay. First, the channel’s slope keeps flattening: early cycles rose about 0.6 % per day on a log scale, now it is roughly 0.15 %. Second, each order-of-magnitude move demands vastly more capital, so the supply squeeze after the April 2024 halving is taking longer to translate into price.
At past tops growth multiples fell from 36× (2013) to 16× (2017) to 3.5× (2021). Extending that trend points to roughly 1.5–2× from the future breakout price. If the breakout happens near $170 000–230 000 the projected new ATH lands around $250 000–360 000, a range that lines up with the red-orange band on the updated Bitcoin Rainbow Chart.
Historically peaks follow a breakout by 9–13 months and the halving by 16–20 months, placing the most probable time window in Q4 2025. Until the weekly candle settles above the channel roof Bitcoin remains in accumulation mode and the classic blow-off phase is still ahead.
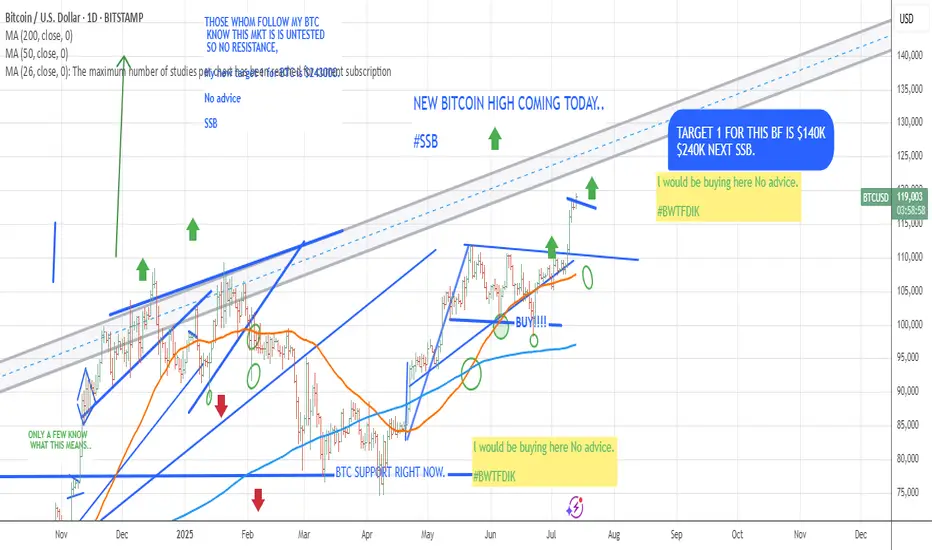
#BTC #BITCOIN $240K BITCOIN COMING PROBABLY WITHIN 3 MONTHS.
CHART speaks for itself for any following TA
BWTFDIK
SSB
uptrendThe upward trend is expected to advance to the specified resistance level. Then, there is a possibility of a trend change and the correction will begin.
