#202529 - priceactiontds - weekly update - daxGood Day and I hope you are well.
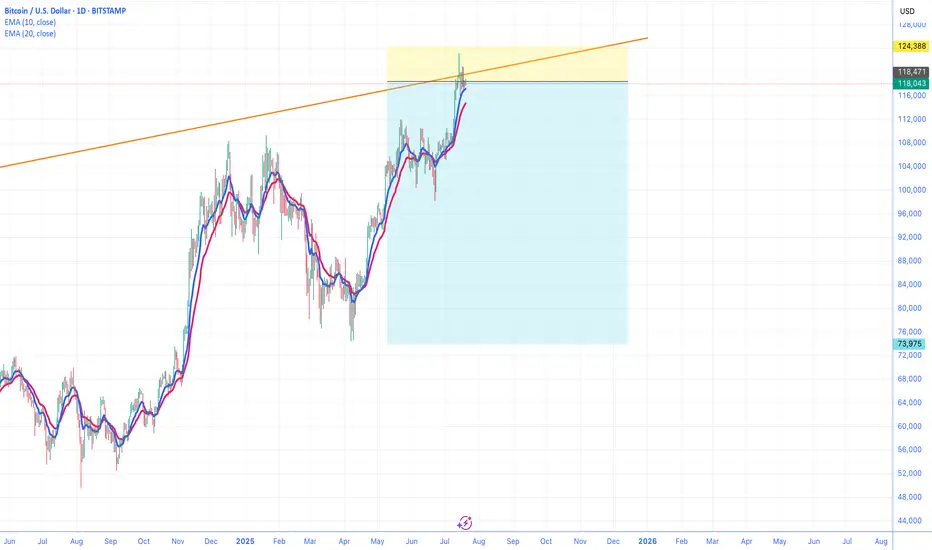
comment: Prior weeks close was 24332 and this was it was 24386. Bulls need to continue with higher lows and bears need to break below 24000 for lower prices. Not more magic to.
current market cycle: bull wedge
key levels for next week: 24000 - 25000
bull case: Bulls are still in control until we print lower lows again. We have 2 potential bull trend lines close to the daily ema and that’s around 24200 and will be my line in the sand for bulls next week. Below, chances of 24000 go up big time. If we stay above 24300, there is no reason we can not test back up to 24500 and above that we will likely try 24700+ again.
Invalidation is below 24000
bear case: Bears need a lower low below 24000. That’s really all there is to it. As of now the selling on Friday was decent but it’s not enough to expect follow-through selling. Below 24000 I think we can test the 50% retracement at 23900 but I’d be surprised if we go lower. Only an event could trigger that. Lower targets would be as marked on the chart.
Invalidation is above 24749
short term: Neutral. I want follow-through selling but will likely won’t get it. It’s still a bull wedge until we have a daily close below 24000.
medium-long term from 2025-06-29: Bull surprise last week but my targets for the second half of 2025 remain the same. I still expect at least 21000 to get hit again this year. As of now, bulls are favored until we drop below 23000.
BTCUSD.PM trade ideas
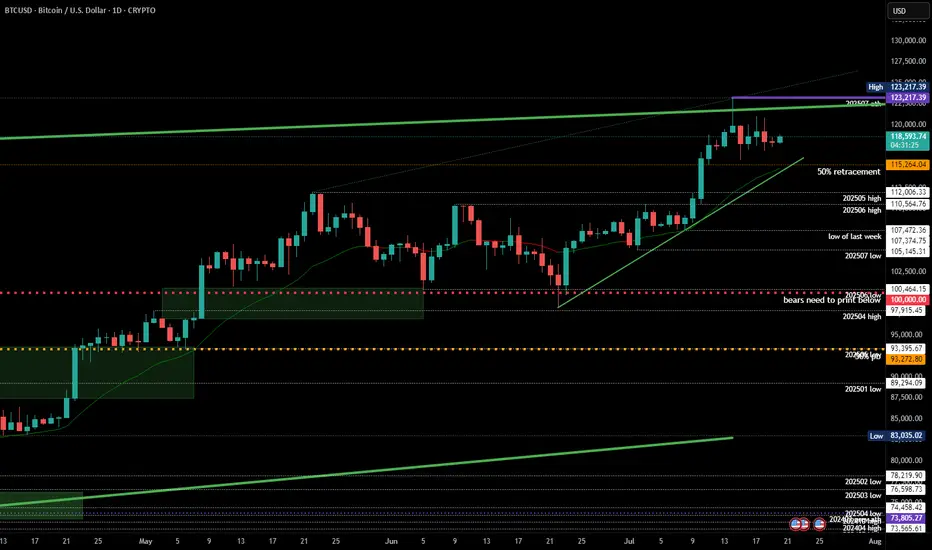
BTCUSD looking for corrective drop towards $111K!1). "Indecisive" weekly Doji retail candle! 2). Price rejection off higher times! 3). Risk indicator is heading south! 4). Trump said "BUY!" 5). There appears to be a cluster of "BUY" orders around $114$K as typically, price drops to trigger those orders!

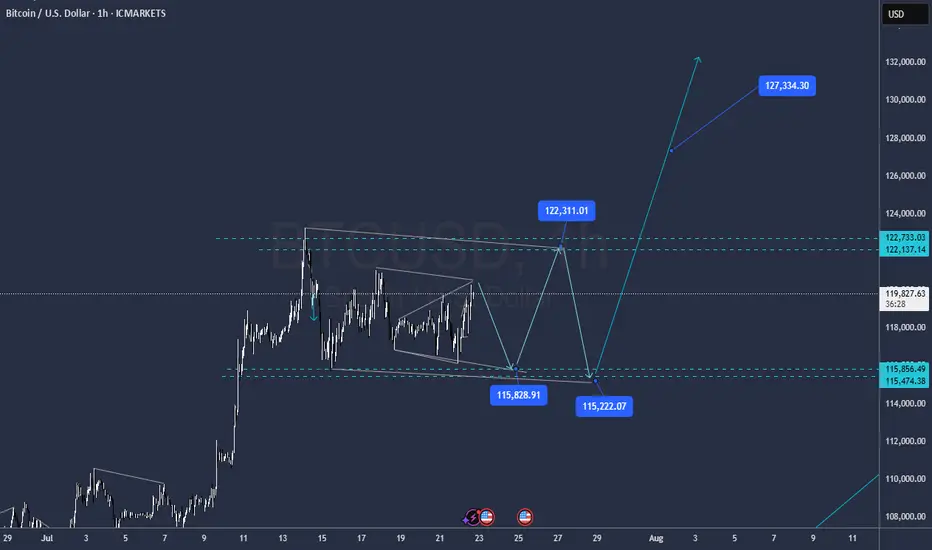
BTCUSD +$500 in the next few candles/sessionsBitcoin (BTCUSD) is showing strong bullish momentum, and current price action indicates a potential move upward by the next $500 in the short term.

A quick update on BYCThe correction turned a littl complex but I still seing the same structure
Levels in the chart
GG
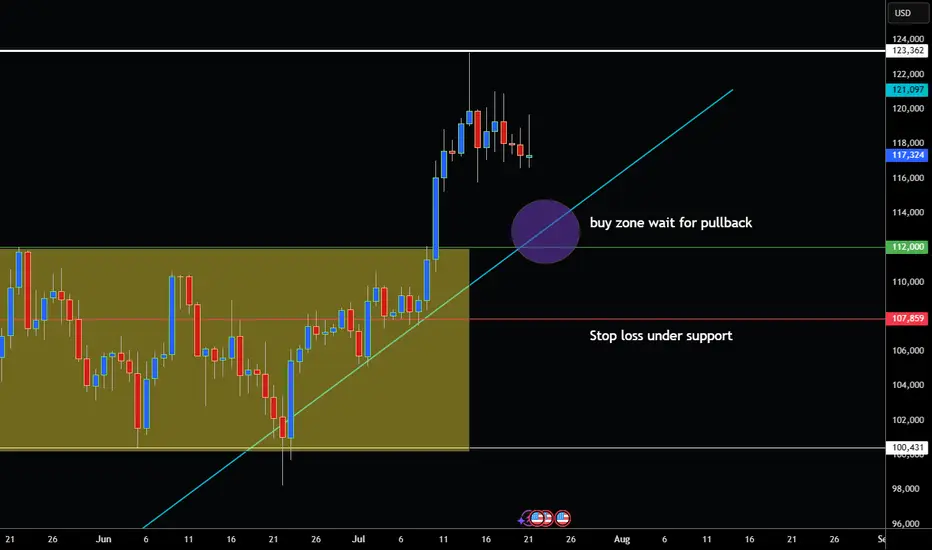
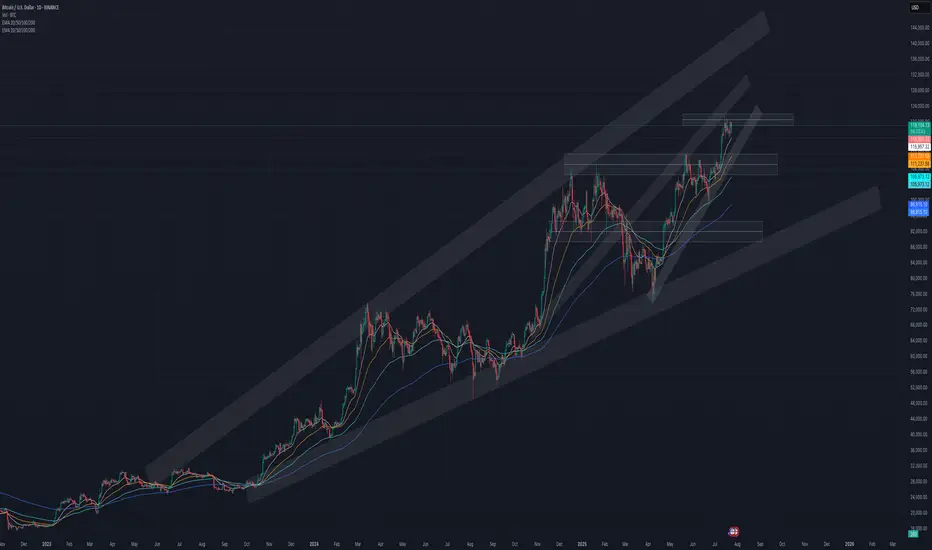
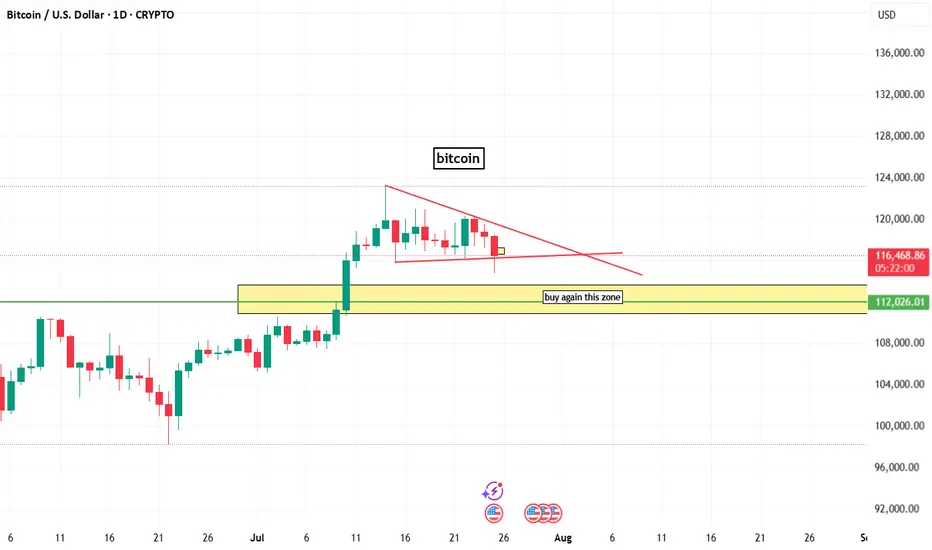
BITCOIN BTC/USD PULLBACK STARTED BACK TO BUYZONE?Hey Traders so today looking at Bitcoin showing a strong Uptrend since April this year. Now showing more bullish momentum after a break above the narrow sideways channel at 112,000. Breakouts normally get retested. Also the best place to buy imo is right at the trend line.
The way I like to trade it is don't chase the market let it come to you. It takes patience but you will always get the best price for your trade if you are willing to wait. However some might disagree with this strategy and say you may miss the move because the market doesn't come back.
I say Who Cares if the market comes back or if it keeps rallying! 🤣
There is always another train at the station (anotherwords there are always other trading opportunities so if we miss one big deal we will another one. Most importantly we will find another one with the best price!
Anyway enough of my rant so if your bullish watch for that pullack to around 112,00-113,000 and put a stop loss below support at 107,500. It looks like a safe level not to get stopped out at.
However if Bearish wait for close below support at 107,500 before considering to sell a rally imo.
Good Luck & Always use Risk Management!
(Just in we are wrong in our analysis most experts recommend never to risk more than 2% of your account equity on any given trade.)
Hope This Helps Your Trading 😃
Clifford
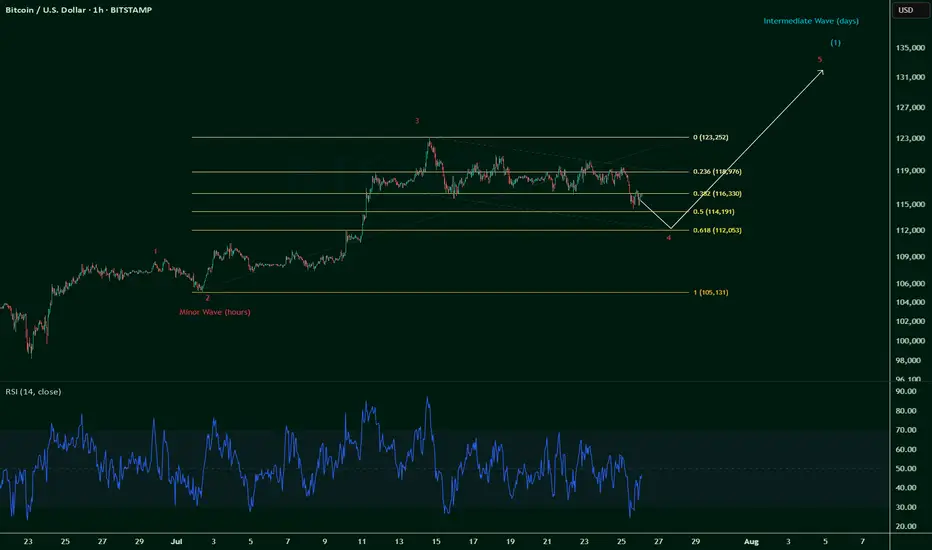
$BTC breaks $115k invalidates Wave 5 -- still Wave 4 correction.So it was a long squeeze after all, and one that was coming.
The initial thoughts were that we're on a Wave 5 up and counting:
But we're brought back down to earth as CRYPTOCAP:BTC breaks below $115k, invalidating a Wave 5 count.
So, it's official: we're still on a Wave 4 correction, which can go as low as 0.618 fib towards $112k.
Now painting a likely scenario given that Wave 2 correction only moved 0.236 fib ~ 0.328 fib (Wave 2 & Wave 4 often contrast):
This could play out till end July or even all the way into early August, which if comes to fruition, could signal for a bullish August.
And August has historically almost always been a bearish month (8 red historical months out of 12).
Pinch me.
How far will Bitcoin drop? 115? 113? 110? Or even lower?Bitcoin has finally managed to break out of the range after nearly two weeks. Now we need to see whether this breakout gets confirmed or not, and if it does, what volume of selling it will face.

BTC Update – Short-Term Pressure Building
Bitcoin is still being pushed down below the BB center.
RSI is trending lower, and MACD is nearing a bearish crossover.
PSAR is hovering close to price, a warning sign.
This could still be a pause before the next leg up — but don’t ignore the signs.
And just a thought: Trump Media buying $2B in BTC might’ve marked a local top.
Prepare in advance.
Always take profits and manage risk.
Interaction is welcome.

Wind up before the big pitch!The longer we coil here, the more vicious the move up will be. Put your tray tables in the upright position and prepare for takeoff...

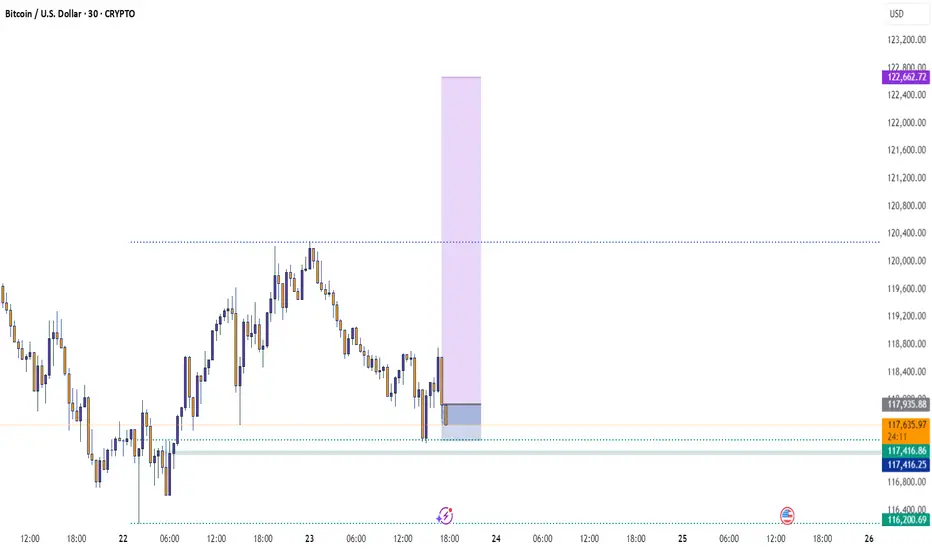
Btusdt techinical analysisThis chart shows a BTC/USD (Bitcoin to US Dollar) 30-minute time frame with a falling wedge pattern and potential bullish breakout setup. Here’s a breakdown of the key technical elements:
---
🔍 Chart Analysis Summary:
1. Pattern:
Falling wedge (highlighted by the converging pink trendlines): typically a bullish reversal pattern, especially after a downtrend.
Price has broken above the wedge, indicating a possible breakout.
2. Price Action:
BTC found strong support near $116,800.
After the breakout, the expected upward move is projected by the blue measured move box, targeting around $118,400–$118,800, a 1.36% gain (~$1,591).
3. Resistance & Target Zones:
First resistance zone: $118,400–$118,800 (wedge top and measured move target).
Next major resistance: $119,600–$120,000 area.
4. Support:
Strong support marked around $116,800 (purple zone at the bottom).
If BTC breaks below this, the bearish scenario could resume.
---
📈 Potential Trade Setup:
Bullish bias above wedge breakout.
Entry: Current level (if breakout holds).
Target: $118,400–$118,800.
Stop loss: Below $116,800 support zone.
---
Let me know if you'd like a bearish scenario, RSI/volume analysis, or a follow-up chart.

BTC Daily Outlook
In my opinion, Bitcoin looks like it might need a short pause here.
📉 It's sitting just below a key Fib level and may require some time to consolidate before making another attempt.
📌 Price is printing a possible second close below the BB center.
📉 SMA is below the BB center — not ideal.
📊 Volume saw a strong red spike on July 15
📉 OBV formed a lower high while price remains elevated (granted, it’s the weekend and volume tends to dip).
📉 RSI is below 70 and under its moving average.
Too early for a strong conclusion — but this is a caution signal.
Let’s stay alert and watch it unfold together.
Always take profits and manage risk.
Interaction is welcome.

BTC, zoom out!!!Based on your prediction that Bitcoin will change at a rate of 5% every year, the price of Bitcoin would be $124,709.55 in 2026, $151,585.24 in 2030, $193,465.44 in 2035, and $246,916.38 in 2040. Scroll down to view the complete table showing the predicted price of Bitcoin and the projected ROI for each year.
BuyRejection Level
Daily Volume
Market Structure Shift
London Session
Trend Line Break
Untapped Order Point
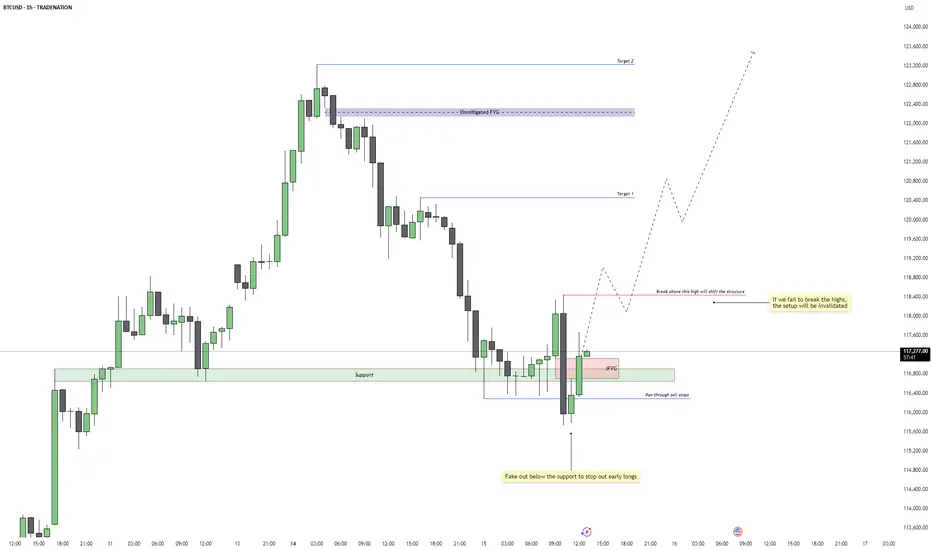
Bitcoin - Reversal Setup or Just a Trap Reset?Price faked below the 1H support zone around 115,800, triggering a clean run through resting sell stops. This classic liquidity sweep flushed out early long positions before immediately reclaiming the range. The move aggressively filled a prior imbalance and flipped sentiment just when it seemed the trend might break lower. The quick rejection and recovery from this level suggests smart money accumulation beneath support.
Formation of a 1H Inversion Fair Value Gap
The rebound from the liquidity grab printed a bullish 1H inversion FVG, now acting as a potential launchpad for continuation. This FVG coincides with the same zone that was previously support, now carrying added confluence. As long as price remains above this gap, the reaction shows bullish intent, with buyers reclaiming initiative after a shakeout.
Trend Shift Trigger and Invalidation Level
The current structure remains technically bearish until we break above the marked 1H high at 118,400. That level is the structure shift trigger. A decisive close above it would confirm a market structure shift and open the door to a broader bullish continuation. However, failure to close above this high would invalidate the setup and suggest that the move from support was just a temporary retracement rather than a full reversal.
Upside Targets and Continuation Outlook
If we get the bullish break above 118,400, I’m looking for price to reach Target 1 near 120,400, followed by Target 2 around the unmitigated FVG at 122,200. These levels align with clean inefficiencies that are likely to get filled if the market gains momentum. With enough volume behind the breakout, BTC could push into ATH territory above 123K as part of a larger macro expansion.
Volume and Higher Timeframe Context
Volume is the final key piece. We need strong follow-through above 118,400 for the setup to remain valid. Weak rejection or consolidation below that red line would signal distribution and potential failure. On the higher timeframes, BTC still looks constructive, but the 1H structure must confirm by breaking higher, or the broader bullish case will need to be re-evaluated.
Conclusion
BTC swept 1H support, ran stops, and printed a bullish inversion FVG. A break and close above 118,400 would confirm trend reversal and initiate a move toward 120,400 and 122,200. If we fail to close above that level, this setup is invalidated and the range could continue or break lower.
Disclosure: I am part of Trade Nation's Influencer program and receive a monthly fee for using their TradingView charts in my analysis.
___________________________________
Thanks for your support!
If you found this idea helpful or learned something new, drop a like 👍 and leave a comment, I’d love to hear your thoughts! 🚀

BTC/USD – 15M Smart Money Update📍 BTC/USD – 15M Smart Money Update
🔹 Price: $117,938
🔹 Day High: $119,679 | Day Low: $116,616
🔹 Context: Trading above Bull Retracement Zone (117,465–117,932)
🟣 Bullish Plan:
✅ Pullback into Bull Zone → FVG tap → bounce
🎯 Target: Bearish Order Block (OB) + Day High sweep
📈 MSS Confirmed | OB + FVG active
⚠️ Bear Trap Possibility:
Fakeout from Bear OB possible before final bullish push
Structure allows deeper pullback, but bullish continuation remains valid
📊 Indicators:
RSI: Cooling from overbought
MACD: Bullish momentum still active
🧠 Sniper Reminder:
Wait for clean reaction in Bull Zone before entry — Smart Money always reacts, never rushes.

BTC 4H – Dance with the 200MA
Bitcoin continues its strong relationship with the 200MA.
Each time price dips below it, fear spikes — but bounces off key Fib levels have followed, with price then riding higher alongside the 200MA.
Right now, price is caught between the 200MA and a nearby Fib level.
Here’s what could happen next:
– Price flips the Fib into support, ideally with help from a rising 200MA.
– Price waits for the 200MA to catch up, and they break the Fib together.
– Or, we get another panic dip, and the bounce comes after another test from below.
Whichever path it takes, we’ll be here watching it unfold.
Always take profits and manage risk.
Interaction is welcome.

BTC Bottom Regression Channel RevisitFisher is head south and a breakdown to the bottom of the regression channel is likely.

bitcoin chart analysisbitcoin chart analysis on daily time frame
here a buy zone that indicated by box and line.
and on chart bitcoin bullish but lower time frame btc is berrish.
Confluent Factors much? Trending, Above EMA: 9,18,21 (angled up) + Above MA: 50,200 + Fib .382, Horizontal Support, Diagonal Support with triangle 70% completed. Was/is a great re-test to buy for the short term acct.


Bitcoin profit booking at this Price level 119675 Bitcoin is making higher high and giving flag fathernow in a range bound zone due to profit booking and and Here we may take a short trade sell 119500, sl-121800, tgt 1108500, 99500🚩🚩
