Bitcoin price increaseAfter the tensions between traders in the United States and the strong price fluctuations in the dollar and other stocks, and after the 3-month increase in gold, this time it will be the turn of digital currencies to increase again and there are signs of their increase in the market. For Bitcoin, two increase targets can be considered: $110,000 - $120,000.
Sasha Charkhchian
BTCUSD.PM trade ideas

Decisive moments: breakout of longtime trendchannel or down downAs you can see we have been moving around a longtime trendchannel. Could this the needed outbreak? Or are we close to the end of the uptrend? We will know soon.... Anything could happen now. Don't BELIEVE... just look at the signs!

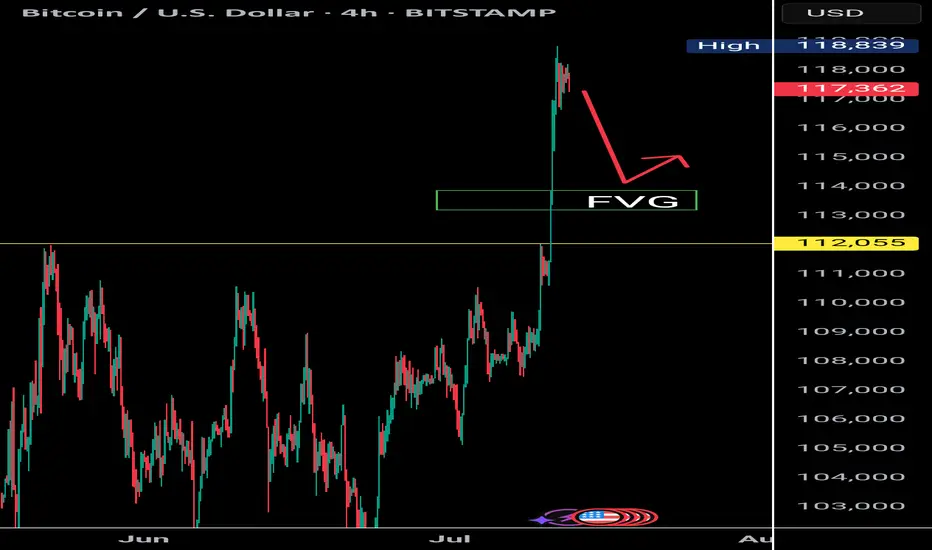
Bitcoin more high opportunity BTCUSD 4H | New Highs in Play
Price has broken structure with strong momentum. A bullish retest near 116,000–116,800 could trigger the next leg up toward the 120,000–121,000 target zone. Watching for price reaction at demand to confirm continuation.

$BTC Rejection at 119K | Eyes on 112K Retest as RSI Cools DownBitcoin faces strong rejection near the $119K resistance zone, showing signs of a cooling market as the RSI exits the overbought territory. Historically, BTC tends to revisit key structural levels after such overheated moves. A favorable re-test zone lies between $114K and $112K, with $112K aligning closely with the previous all-time high — a psychologically significant support area.
Support levels to watch: $112K (favorable retest) and $110K (strong base).
As RSI continues to cool, keep an eye on bullish reactions around these levels for potential entries.
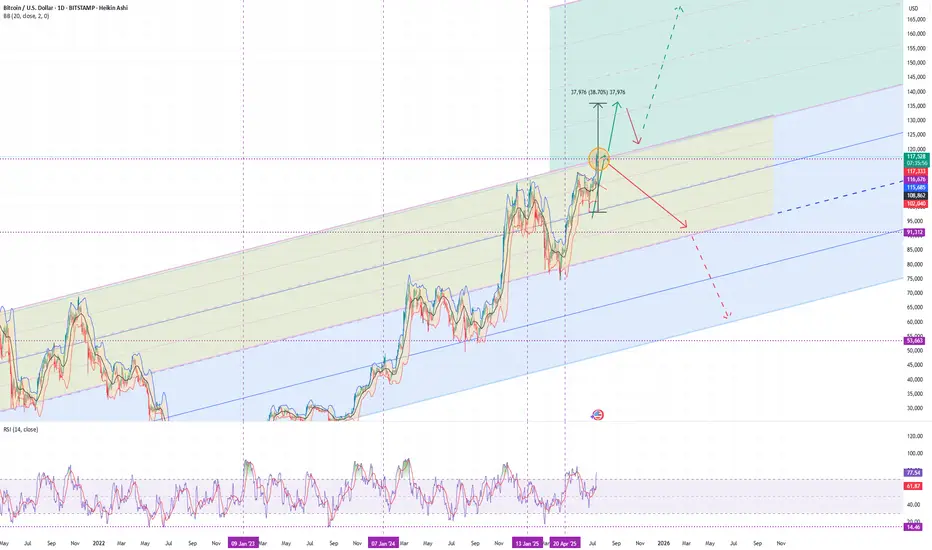
BTC/USDStill the most likely scenario. I believe we're near peak positive sentiment.
As I stated prior:
"I've been calling for a crash for a while.
The closer to the top you are, the more hatred that you'll get for calling one.
It's a difficult position being contrary to the crowd. I think that's why Peter denied Jesus.
In any case, positive sentiment must end and as overdue as it is, I'm expecting a bang, after a final wave of FOMO."

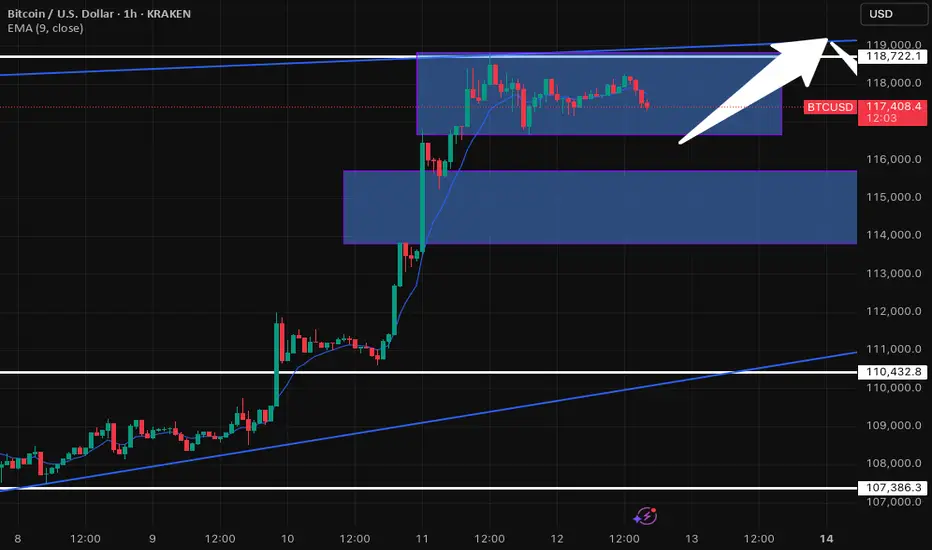
BTC/USD 1H: Uptrend Consolidation - Key Levels to WatchQuick Look at Bitcoin (BTC/USD) on the 1-Hour Chart - Kraken
Alright, let's dive into what Bitcoin's doing on the 1-hour chart. We've seen BTC in a pretty solid uptrend lately, cruising nicely within that ascending channel. It recently had a fantastic run, pushing right past the $110,432.8 resistance level – a great sign!
But now, it looks like Bitcoin is taking a breather. It's currently consolidating in that upper blue box, roughly hanging out between $116,000 and $118,000. This kind of sideways movement often means the market is trying to figure out its next big move after a strong push. Are buyers reloading, or are sellers starting to step in? That's the big question.
Here's what I'm keeping an eye on:
On the Upside: The immediate hurdle is the top of this current consolidation range, right around $118,722.1, which also lines up with the upper trendline of our channel. If Bitcoin can break convincingly above that, we could see another leg up – definitely a bullish signal!
On the Downside: If it can't hold this range and starts to dip, the first area of interest for support is that lower blue box, roughly $114,000 to $115,000. That's where I'd expect some buyers to potentially step back in.
Stronger Safety Nets: Don't forget that $110,432.8 level. It was tough resistance before, so it should now act as a pretty strong support if we see a deeper pullback. And, of course, the bottom trendline of our ascending channel and $107,386.3 are there as well.
My Takeaway:
Bitcoin's in a strong position overall, but this consolidation is key. The next big move will tell us a lot. Keep an eye on those breakout or breakdown points – that's where the action will be!
Sell BTCUSD BTCUSD will decline from 117000 towards 115000 in today's trading session. A break of structure occurred and now price seems to be free falling.

BTC/USDI've been calling for a crash for a while.
The closer to the top you are, the more hatred that you'll get for calling one.
It's a difficult position being contrary to the crowd. I think that's why Peter denied Jesus.
In any case, positive sentiment must end and as overdue as it is, I'm expecting a bang, after a final wave of FOMO.

bitcoin will go down for the next 8hrs After sweep the liquidity above 118098. the price goes down for the correction . I expect it will reach the one hr order block at 115911.
Entry : 118098- 117500
St : 118200
tp: 116000
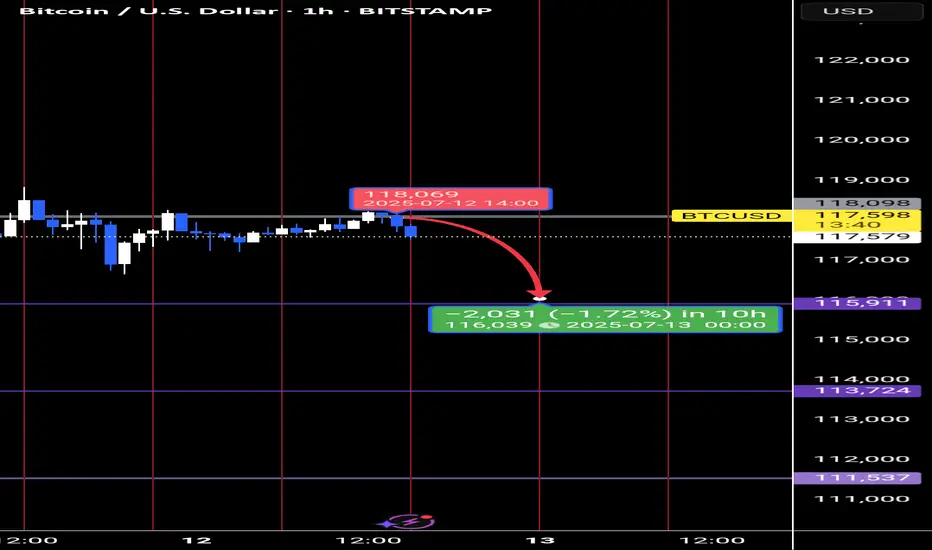
bitcoin down for 8 hrAfter sweep the liquidity above 118098. the price will correct may be to 115911 or more ...
for the next 8 hrs I expect it will reach the 1 hr order block at 115911.
entry : 118098- 117000
tk: 115911 or end of time cycle of 8hr
St: 118198

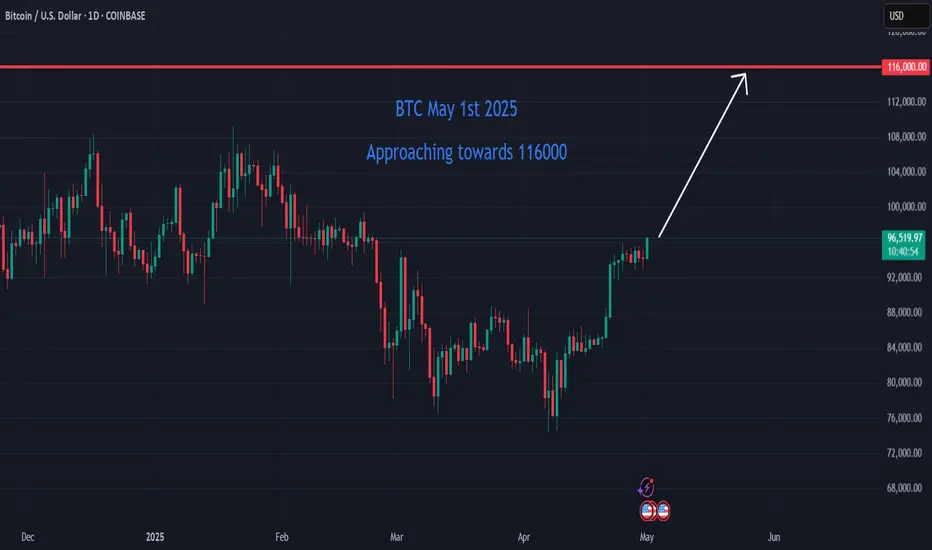
Bitcoin on the Brink: Short-Term Surge Toward $116K Bitcoin (BTC) is currently trading at approximately $96,390, approaching the $116,000 mark. Here's a short-term analysis using Cycle Analysis, Elliott Wave Theory, and Gann Analysis to inform potential trading strategies.
________________________________________
📈 Cycle Analysis: Mid-2025 Surge
Historical patterns suggest that Bitcoin tends to reach its peak between 518 and 546 days after a halving event. Given the most recent halving in April 2024, analysts anticipate a potential price peak around mid-2025, approximately 1.5 years post-halving. Notably, Bitcoin is currently about 35 days ahead of its typical cycle, indicating a possible acceleration in price growth.
________________________________________
📊 Elliott Wave Analysis: Wave 3 in Progress
Elliott Wave Theory suggests that Bitcoin is currently in the third wave of its bullish cycle, which is typically the most powerful and extended wave. Recent analyses indicate that the third wave is unfolding, with potential targets ranging from $114,500 to $120,500. A conservative estimate places the peak of this wave between $127,000 and $150,000
________________________________________
📐 Gann Analysis: Price-Time Equilibrium
Gann Analysis utilizes geometric angles to predict price movements. The "2×1 Fan" line, representing a 45-degree angle, is considered a fair value line. Historically, Bitcoin's price has peaked near this line during parabolic run-ups. Currently, Bitcoin's price is approaching this level, suggesting a potential peak.
________________________________________
🧭 Short-Term Trade Setup
✅ Entry Points:
• Accumulation Zone: $85,000 to $90,000
• Current Price: $96,390
🎯 Target Levels:
• Short-Term Peak: $116,000 to $135,000
• Medium-Term Peak: $150,000
⚠️ Risk Management:
• Potential Correction: After reaching the peak, anticipate a significant pullback, possibly 30–50%.
• Exit Strategy: Consider taking profits as Bitcoin approaches upper resistance zones.
________________________________________
🧾 Conclusion
Bitcoin is in the final stages of its current bullish cycle, with projections indicating a potential peak between $150,000 and $278,000. However, caution is warranted as market corrections are typical following such surges. Investors should consider taking profits as Bitcoin approaches upper resistance levels and prepare for potential pullbacks.
Would you Look at this ... 💁♂️💁♂️💁♂️ Ok, I have only taken 1 course of TA And somehow I am able to draw the perfect trajectory of the Course of BTC. Now the question is how high will we go... Follow for the next Prediction

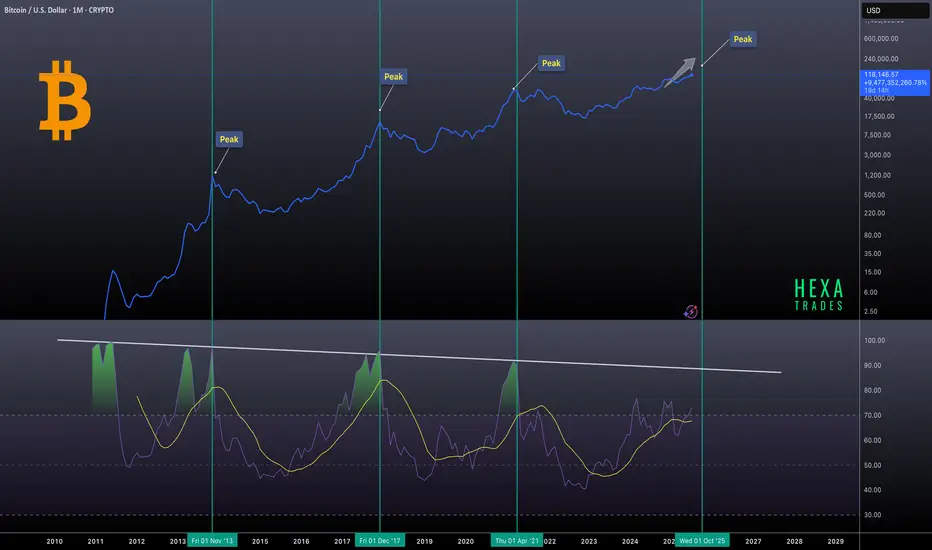
Bitcoin Macro Cycles: Sell Signal at RSI 90Bitcoin’s historical market cycles, using monthly RSI data to identify previous bull market peaks. Notable tops in 2013, 2017, and 2021 are highlighted, with the next potential peak projected around October 2025. A consistent pattern emerges where each market top aligns with the monthly RSI reaching or nearing the 90 level, indicating extremely overbought conditions.
Sell when the monthly RSI hits 90. This has consistently marked previous market tops and can serve as a reliable signal for long-term investors.
I had predicted a breakout in bitcoin a few days agoI had predicted a breakout in bitcoin a few days ago, see its result on the chart today

Sell bitcoin now because we are seeing a quick momentum changeSell bitcoin now because we are seeing a quick momentum change, close our
Buy position on small profit and take a sell now

The idea is super clear Bitcoin works with pattern repetition, currently defied the double top pattern and that's just the last solid confirmation needed to break the ice.

BTC BREAKOUT VERY INSTRUCTIVE Weekly simply shows there are more rooms for BTC to continue the uptrend but lower time frame will let us know better as there may be pullbacks however, we need the weekly candle close above the most recent high of $118,900 to give us that immediate confirmation.
So as not to get trapped by the bears, the best way to trade the buy for BTC is to have a buy-stop Order at $118,900 with SL below $112,000 with very low Lot size depending on your account balance.
Proper risk management is strongly advised

Bitcoin(BTC/USD) Daily Chart Analysis For Week of July 11, 2025Technical Analysis and Outlook:
In the last week's trading session, Bitcoin has demonstrated a significant surge, achieving historical prices as anticipated by TSS for an extended period. The cryptocurrency has successfully completed both the Outer Coin Rally 114500 and the Inner Coin Rally 118200. Presently, Bitcoin is poised to celebrate this notable accomplishment with a victory lap, but it may face a potential downward trajectory, targeting the Mean Support level of 112000. This anticipated decline will necessitate the resilience to a retest of Inner Coin Rally 118200. The designated targets for the Outer Coin Rally at this juncture are 122000, 126500, 132200, and 135000.

BTCUSD BUY OPPORTUNITY IN M15 TIMEFRAME!Price surged High with strong buy momentum in H4 timeframe and recently traded a new all time high. This provides us with a potential buy opportunity as price currently trades at 117392.00 our target profit is at 119634

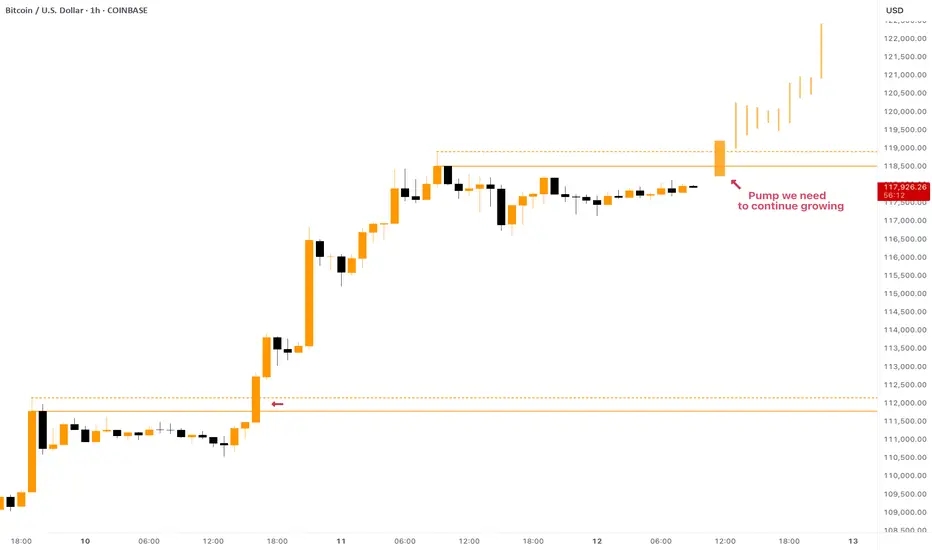
BITCOIN - Local Conditions for Growth ContinuationCRYPTOCAP:BTC showed us an astonishing growth from $108,000 to $118,000 in a few days! But what is next and where is the next target?
At the moment the price is consolidating below the ATH, in fact there are two resistances: $118,500 and $119,000. To continue pumping, Bitcoin has to break both of them with strong impulse.
To be honest , the current price development reminds me of what we've seen a couple days ago: breakout of the resistance -> consolidation below local highs -> strong breakout and growth continuation. Something similar can be expected now as well.
In the past couple of years CRYPTOCAP:BTC taught us a lesson of waiting no time to hop on the train . When it pumps - it does it quickly, just like it does it this time. So, waiting for the best entry near $109,000 - $110,000 might leave you behind while Bitcoin will be pumping towards $125,000.
A Path into the TOP2W BTC - RSI is telling us we are at a pause - consolidation with a slight pullback is to be expected
RSI is tightening up and seems like it wants to consolidate a bit, maybe a slight dip down to run back up
The RSI here is not only giving direction its also giving us a possible top for price action into Oversold

Btcusd techinical analysis.This chart displays a 1-hour candlestick analysis for Bitcoin (BTC/USD) on OKX, with a focus on harmonic pattern recognition and technical price projections.
Here's a breakdown of what the chart suggests:
---
🔷 Harmonic Pattern: Potential Bullish Bat or Gartley
The marked XABCD structure appears to form a harmonic pattern, likely a Bullish Gartley or Bat:
XA: Initial impulse leg.
AB: Retraces ~61.8–78.6% of XA.
BC: Retraces ~38.2–88.6% of AB.
CD: Extends to complete the pattern near the D point.
✅ Ratios like:
AB ≈ 0.618–0.786 of XA
BC ≈ 0.618–0.886 of AB
CD ≈ 1.272–1.618 of BC support this classification.
---
📈 **Ascending Triangle
