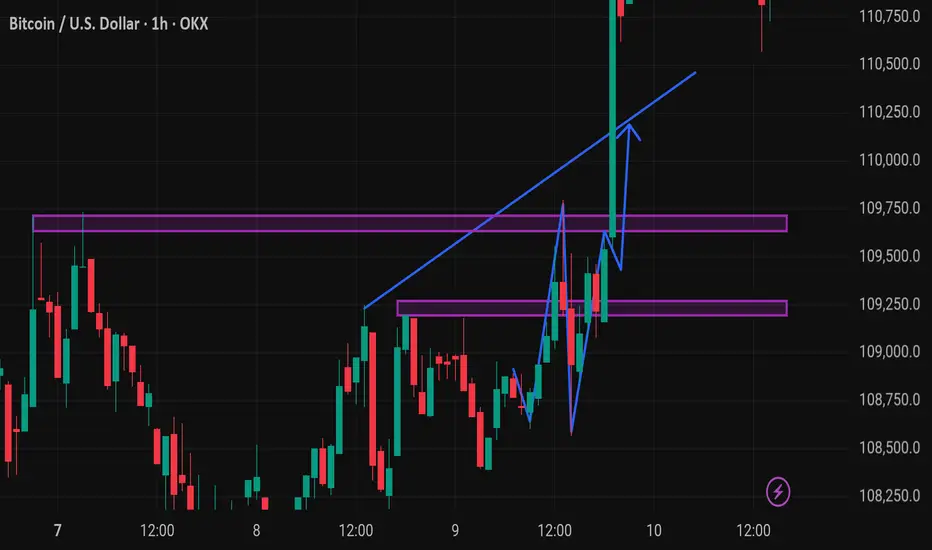
BTCUSD Bullish Medium-termBTCUSD is about to start the bull run.
Break of 113000 will target 118,000 before 150,000 in the coming 4 months.
BTCUSD.PM trade ideas
BTC-M2!Sooo much liquidity out there currently! I think everyone calling for 150 as the cycle pico top are being bearish. As I have said before, I predict that BTC will take the full cycle and max out its potential early to mid October.
My thesis for over a year...
Base -- 160
Norm -- 220
Bull -- 280
FYI, the M2 adjustments as shown...
1D -- 90
4D -- 22
1W -- 12

BTCUSDBullish Alt record high targets Bullflag
Different SL for different Risk takers
BTCUSD BULL TRADE
I will share traget
* I share The chart earlier but there was some error so posting again

$BTC Breakout Confirmed – Next Stop: $120K? CRYPTOCAP:BTC Breakout Confirmed – Next Stop: $120K?
I told you — if BTC closes above the box, a breakout was imminent… and it just confirmed!
Price has cleanly closed above the $110K resistance zone after multiple rejections — this breakout signals strong bullish momentum. 📈
Next stops: $120K and beyond
Breakout buyers are now in control — as long as BTC stays above $110K.
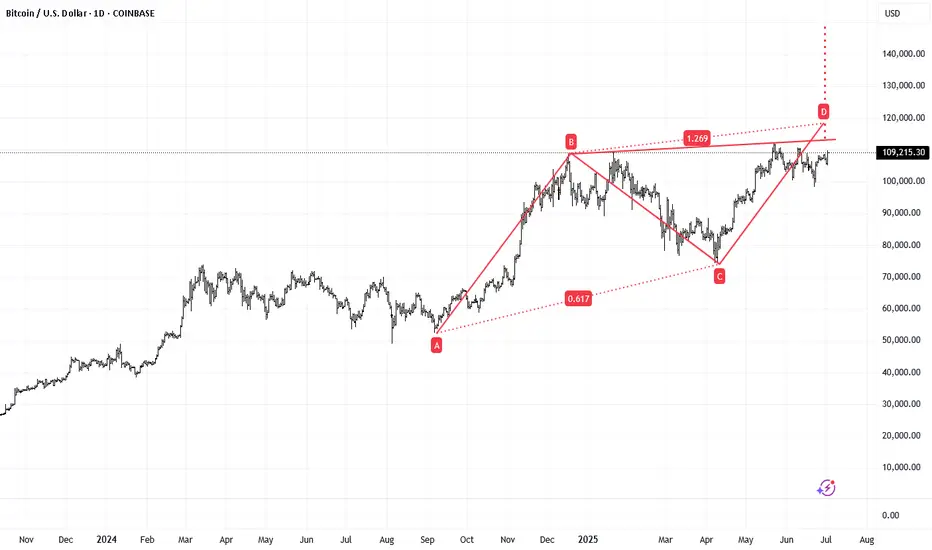
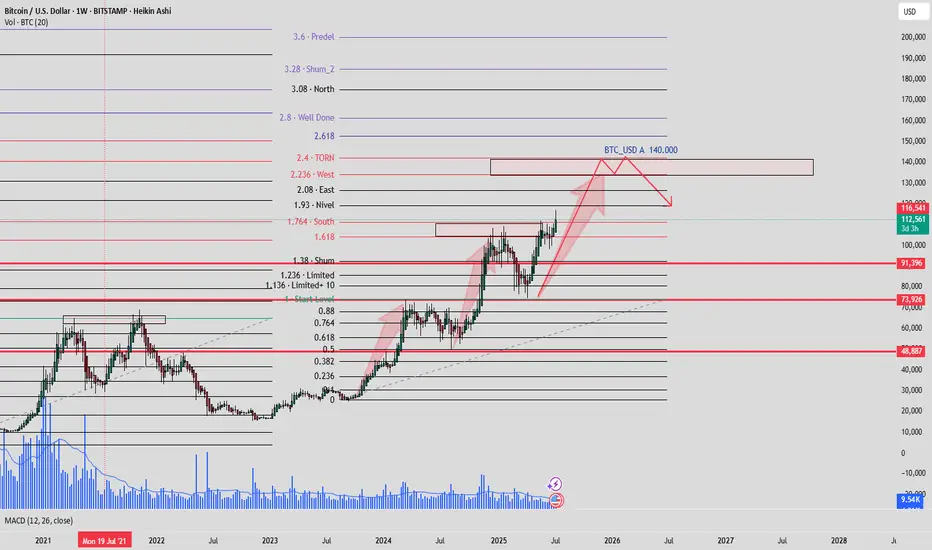
#BTC ALMAZOV PROJECTION#BTCUSD ALMAZOV PROJECTION WEEKLY
Price projection according to Almazov's theory, Bitcoin should at least touch $140,000, before pulling back or continuing to go long if its dimensionality decreases.
BTC All Time High All Time High
It’s mid year 2025. Let’s see what looks like bullish moment, will it continue ?
I anticipate the crypto bull run to be long term. I’m excited.
#BTCUSD #CRYPTOCURRENCY

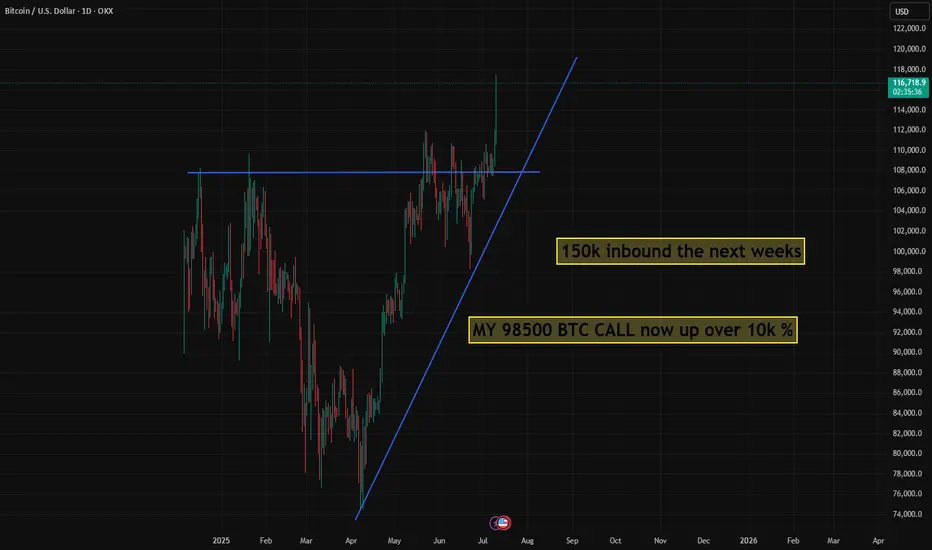
BTC 98500 ENTRY IS UP MASSIVE BITTEACHHUGE WIN FOR MY MEMBERS AND MY TRADING VIEW FOLLOWERS. check all my recent LONG calls i made this month.
this call was on my other banned trading view on 6/5 2025 at a 98600 entry point on BTC. we are absolutley printing a BAG right now and nothing is stopping the digital economic train.
follow for more info

$BTCUSD Trade Setup – Rejection at Channel Highs or BreakoutBitcoin is approaching a key decision point at the top of its descending channel. After bouncing off $100K support and reclaiming the midline, price is now pressing against the upper trendline near $112K. The MACD has just flipped bullish, and momentum is turning upward. However, BTC has repeatedly failed at this level over the last two months, forming a clear resistance zone.
This trade is structured as a short from resistance with tight invalidation above $112K. The setup offers a favorable risk/reward if this rejection holds and BTC pulls back to the $97K–$98K zone.
Entry: ~$108K
Stop: ~$112K (channel breakout)
Target: ~$97.5K (lower channel support)
If BTC breaks and holds above $112K, that would invalidate the short thesis and likely flip the structure toward a full breakout scenario.

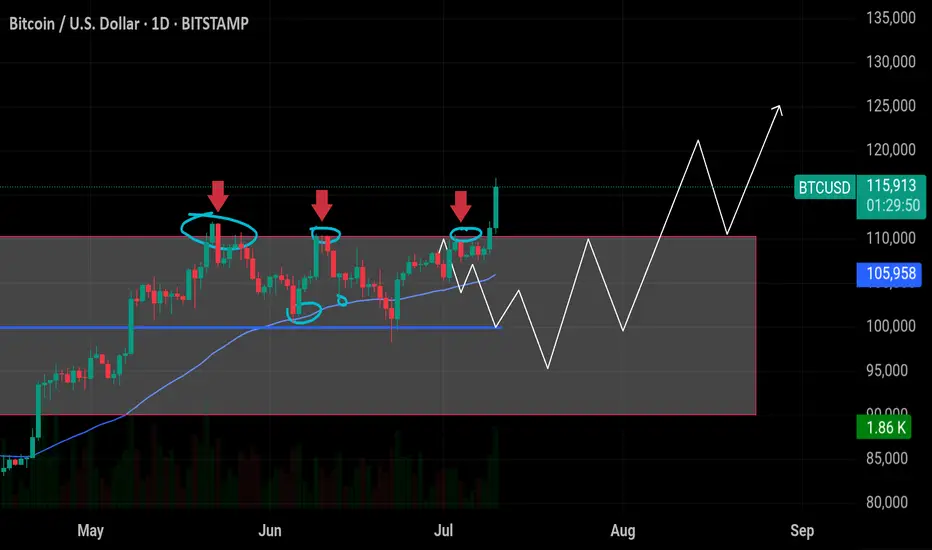
BTC is on track!This is what four month for Bitcoin can look like and you really think 230k in October 2025 is far-fetched?? You better rethink that.

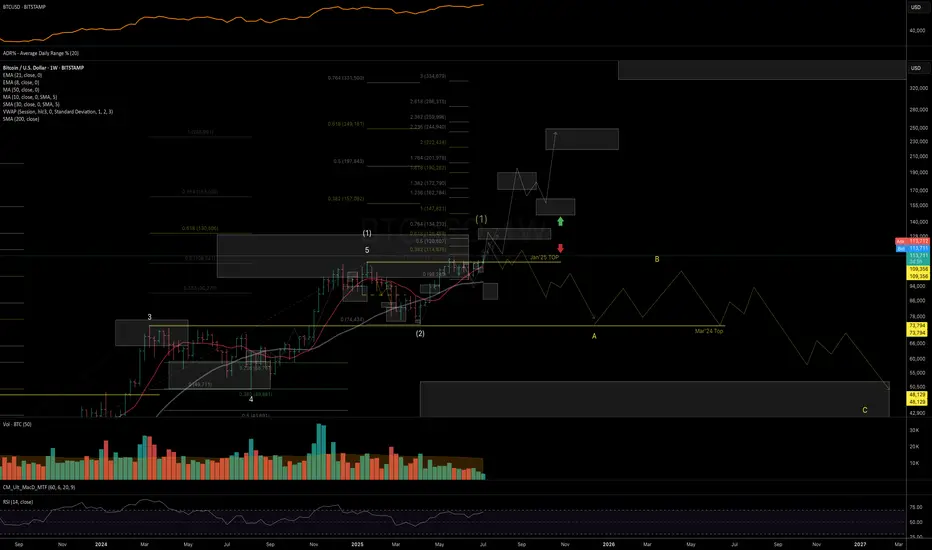
BTC: Macro Structure [Weekly Timeframe]Sharing my current view on the macro price structure of Bitcoin, outlining both main and alternative scenarios based on trend wave analysis.
Macro Trend Overview and Main scenario
The uptrend from the Nov ’22 bottom shows a classic 5-wave impulsive structure, closely aligning with ideal Fibonacci proportions:
Wave 3 peaked within the 1.382–1.618% zone
Wave 4 found support in the 1.236–1.000% area
Wave 5 topped near the 2.000% / 0.618% projection (measured from the Nov’18 bottom to Nov’21 top, projected from the Nov’22 low)
Wave (2) was relatively short in time and depth, but technically acceptable as complete. Given the broader technical structure, macro fundamentals, policy tailwinds, and social sentiment - I consider wave (2) to be finished.
The rally from April’25 low to May’25 high looks impulsive, followed by a clean three-wave pullback into the June’25 low - a structure consistent with the start of a new uptrend, within a larger degree wave (3).
If this is the case, given the fractal nature of the markets, price should Fibonacci proportions similar to the Nov’22 - Mar’24 cycle.
For this bullish count to remain valid, BTC must break and hold above the 126–134K resistance zone. This would open the door to next resistance zone be tested nex: 170–190K and 200–220/250K, where I’d expect a major top to begin forming, possibly, the start of a multi-year higher low formation.
Alternative Scenario
If price fails to break above 126–134K and starts showing reversal patterns, then the yellow count remains valid suggesting the entire trend from Nov’22 has peaked, and BTC could be entering a deep, prolonged correction (as per the yellow count).
In Summary
As long as weekly closes stay above 111.9K, my base case favors continued upside into 125–135K, where the next major decision zone lies:
• Either a short consolidation before breakout
• Or formation of a macro top
For more detailed levels and daily trend structure (including ETH, SOL, XRP, and HYPE), check out my recent video idea and Minds post.
Thank you for your attention and I wish you successful trading decisions!
If you found this idea helpful, I’d really appreciate a boost — and would be glad to have you as a subscriber!
Thank you for your attention and I wish you successful trading decisions!
* I'm keeping the same structure read from my public Mar'24 analysis:
Bitcoin – Rejection Confirms Trap, Next Stop: $107kBitcoin attempted to take out the swing high around 110.5k but failed to clear the previous all-time high, resulting in a sharp rejection. This failure marks a significant turning point, suggesting a lack of bullish momentum at premium levels. The rejection came after a sweep of equal highs within a well-defined resistance zone, indicating a potential liquidity grab.
Highs Swept, But No Breakout
After dropping into support around the 107.5k region, price managed to push up and form a new swing high, but once again met heavy selling pressure after sweeping the prior equal highs. That sweep and the subsequent rejection give this structure the character of a classic liquidity trap, where smart money runs the highs only to reverse.
Weak Lows Below
The support zone has now been tapped multiple times, and the most recent low is structurally weak. It failed to produce a higher high, which makes it vulnerable to a clean stop hunt. Given this context, these lows are likely to be targeted next, as price seeks out sell-side liquidity resting beneath.
Expected Path Forward
I’m expecting further downside to unfold from here. The rejection from resistance, paired with the weak internal structure, suggests Bitcoin will take out the weak lows near 107.5k. Once those lows are swept, I expect a bullish reaction from the same demand zone, setting up a potential long opportunity back into the 109k–110k area. The plan is to look for signs of a reversal after the sweep, such as a 5M market structure shift or a fair value gap entry setup.
Liquidity Map and Trade Plan
The current price action is best viewed through the lens of liquidity. The highs were engineered to trap breakout buyers and then rejected. Now, the weak lows offer the next logical draw on liquidity. My focus is on short-term downside targeting that 107.2k–107.5k support region, followed by a potential bullish reversal setup once that liquidity is cleared.
Conclusion
This is a clean example of a failed breakout, followed by engineered liquidity moves in both directions. As long as price respects the current structure, my bias remains short into the weak lows, followed by a high-probability long setup once those lows are swept and the market shifts.
Disclosure: I am part of Trade Nation's Influencer program and receive a monthly fee for using their TradingView charts in my analysis.
___________________________________
Thanks for your support!
If you found this idea helpful or learned something new, drop a like 👍 and leave a comment, I’d love to hear your thoughts! 🚀

Bitcoin Breaks Out – The Final Test Has Begun 🚀🔥 Bitcoin Breaks Out – The Final Test Has Begun 💥📈
Boom! The breakout is here. After days of grinding under resistance, BTC has finally burst out of the channel — and all eyes are now on the monster level at $114,900.
📊 We spoke about this level again and again — the third macro test, the “HUGE-est Level EVER,” the battleground between Ultimate FOMO and End of Cycle.
⚠️ This breakout could lead to:
✔️ Acceleration to retest 114,900
✔️ A potential 3rd attempt to break the golden structure
✔️ Euphoria or exhaustion — no middle ground
🧠 Smart traders will remember:
– 8+ divergences still exist on higher timeframes
– The risk of failed breakout traps is high
– But this is what we’ve been waiting for: confirmation + continuation
🎯 If momentum holds, we may be on our way to test the upper macro structure. This is not the time to hesitate — it’s time to manage risk like a pro and track the flow.
💡 Catch up on the setup:
👉 Where Can Bitcoin Go? Part 8
👉 July 10th Market Outlook – Uncharted Waters
🗣️ It’s not about prediction — it’s about preparation.
We were ready. Are you?
One Love,
The FXPROFESSOR 💙
Disclosure: I am happy to be part of the Trade Nation's Influencer program and receive a monthly fee for using their TradingView charts in my analysis. Awesome broker, where the trader really comes first! 🌟🤝📈

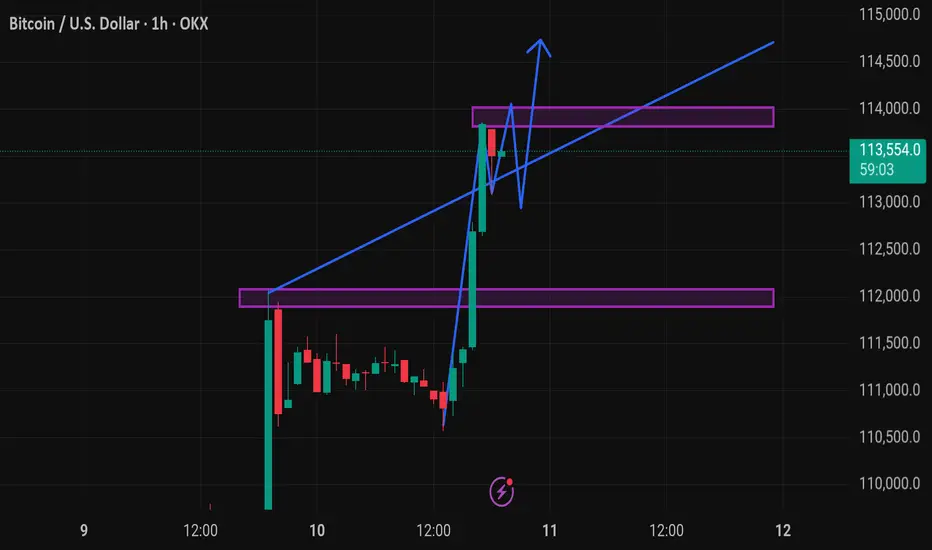
Btcusd techinical analysis.This chart represents the Bitcoin (BTC) / USD price action on a 1-hour timeframe, with technical analysis indicators suggesting a bullish outlook.
Key Elements in the Chart:
1. Current Price:
BTC is trading at $113,506.5, up +1.98% on the 1-hour chart.
2. Support and Resistance Zones:
Support Zone (purple box around ~$112,000): Recently tested and held, now acting as a potential base.
Resistance Zone (purple box around ~$113,800 to ~$114,000): Price is currently consolidating just below this zone.
3. Trendline:
A rising blue trendline is acting as dynamic support, showing upward momentum.
4. Projected Price Action (Blue Arrow Path):
The blue path suggests a potential bullish breakout from the resistance zone.
Implies consolidation, retest of support/trendline, and continuation upward—a common bullish flag or pennant pattern.
---
Interpretation:
The chart setup is bullish, expecting:
Retest of support near $113,200–$113,400
Break above the $114,000 resistance
Potential rally continuation beyond $114,000 (toward $115,000 or more)
Caution:
If BTC fails to hold the trendline or drops below the support zone (~$112,000), this bullish setup may be invalidated.
Would you like a trading strategy (e.g., entry/exit levels or risk management) based on this setup?
Crypto at All Time Highs! But...Last month I shared a chart of an equal-weight crypto basket suggesting crypto may be on the cusp of fresh All Time Highs -- those highs have arrived! While that is certainly exciting for crypto holders one should take note of other aspects of the rally.
The US Dollar has depreciated substantially against foreign currencies this year (2025)
Bitcoin has yet to reach a fresh high against Gold
Bitcoin is strongly correlated to US equities, which are also at all time highs
USD Decline
The US Dollar is down a whopping 10% against a basket of foreign currencies this year, lead ostensibly by President Trump's raucous political policies, most notably aggressive tariffs across the globe and industries. The crypto rally therefore could be characterized as more of a Dollar softening than a crypto strengthening.
Bitcoin v Gold
Bitcoin - still the epicenter of all things crypto has not topped Gold.
Gold in fact has been on a heater of late against the Dollar.
Many folks still regard Gold as "real money". As such crypto could be said to be in a "stealth bear market", especially considering the declining momentum against Gold while failing to match its highs.
Bitcoin v Stocks
Bitcoin is also strongly correlated to US equity performance, despite claims that it's a hedge. The correlation has only grown stronger as Bitcoin's price against the Dollar has soared.
That said, it does consistently outperform equities, as long as the music is still playing!
Closing Thoughts
Most people likely don't care about how Bitcoin is faring against Gold. Bitcoin, the highest quality form of crypto is itself still highly speculative. While an equal-weight basket of cryptos is impressively reaching an all time high against the Dollar, coins with smaller market caps will surely be the first to go when this speculative impulse subsides.
There's probably still some gas in the tank at this point, but now is a good time to consider trimming positions before you miss the chance 🤑

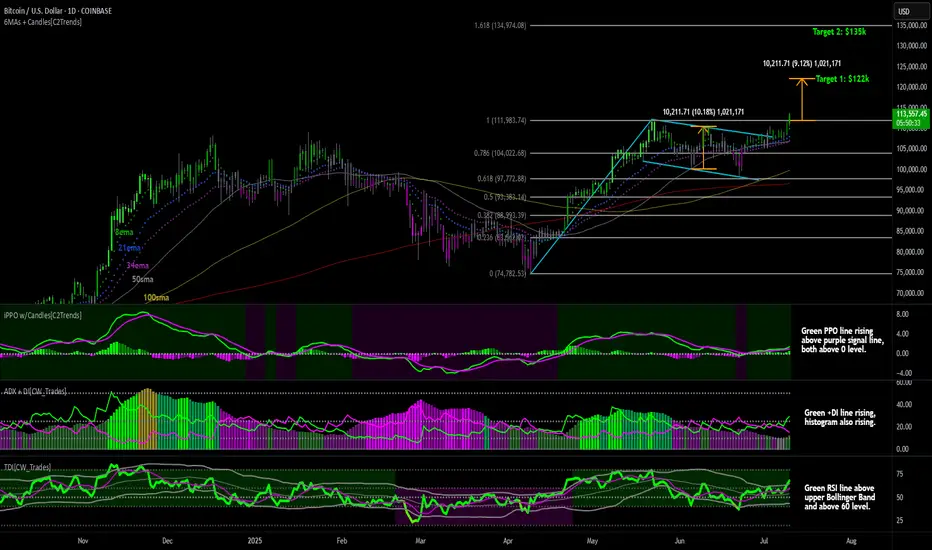
Bitcoin New All-Time HighNew all-time high for Bitcoin above $113k and is now in uncharted territory.
First price target I'm watching from here is $122k which is based on the range that we saw price make in the blue flag pattern that formed during the consolidation phase. I took the price difference between the high and low in the flag and projected it out from the previous resistance level at $112k which gives a target of $122k. Second price level I'm watching is $135k which is the 1.61 fibonacci extension level based on the April low to the recent resistance level at $112k made in May.
Lower price indicators are now all bullish:
The PPO indicator show the green PPO line rising above a rising purple signal line, with both lines having held above the 0 level during consolidation. This indicates intermediate to longterm bullish price momentum.
ADX indicator shows the green +DI line rising above a declining purple -DI line and the histogram bars are rising. This indicates increasing bull trend strength.
The TDI indicators shows the green RSI line above the upper Bollinger Band, and above the horizontal 60 level and is showing bullish trend strength.
New all-time highs generally attract more buyers looking to ride the strength.
Giddy Up.
SELL BTCUSD NOW🚨 TRADE ALERT:
SELL BTCUSD NOW 💥📉
🔻 Market showing bearish signs.
🎯 Set your TP (Take Profit) levels wisely.
🛡️ Use SL (Stop Loss) to manage risk.
📊 Confirm with your strategy before entry.

BTC/USD: Bitcoin Holds Above Key Support — Target at 113,388Market Overview:
Bitcoin is trading near 111,250 after breaking out of a descending structure and forming a bullish channel. The price has firmly established itself above the daily level of 110,600, signaling continued bullish momentum. The market is now aiming toward the channel’s upper boundary.
Technical Signals & Formations:
— Completed ABCD pattern
— EMA supports the bullish bias
— 110,600 now acts as key support
— Upside potential toward 113,388
Key Levels:
Support: 110,600, 109,115
Resistance: 112,000, 113,388
Scenario:
Primary: As long as BTC holds above 110,600, a move toward 112,000 and 113,388 remains likely.
Alternative: A drop below 110,600 may trigger a pullback toward 109,115.

BITCOIN Epic Breakout! Buy!
Hello,Traders!
BITCOIN is trading in an
Uptrend and the coin made
An epic bullish breakout
Of an ATH level of 112k$
Which reinforces our bullish
Bias and we will be expecting
A further bullish move up
Buy!
Comment and subscribe to help us grow!
Check out other forecasts below too!
Disclosure: I am part of Trade Nation's Influencer program and receive a monthly fee for using their TradingView charts in my analysis.

BTC Breakout Alert: Ready for the Next Bullish Wave The BTC/USD 4-hour chart shows a clear breakout above a descending trendline that has acted as resistance since mid-May. After multiple rejections, the price has now broken above the structure, signaling bullish momentum. The Ichimoku cloud confirms support underneath, providing confluence for a potential rally. The bullish breakout is also accompanied by increasing volume and a bullish engulfing pattern near the breakout zone, which adds confirmation. Price is currently consolidating just above the breakout area, suggesting a retest may be forming before further upside continuation. If momentum sustains, higher levels could soon be tested in the coming sessions.
Entry: 109,400
1st Target: 110,000
2nd Target: 111,870

BTC Summer Roadmap: Key Levels & Breakout ScenariosBTC has retested the weekly resistance trendline (around $114K) that has been in place since February 2021. Over the past 4 years, this trendline has been tested four times, and a fifth retest appears imminent in the short term.
Historically, a fifth retest often leads to a breakout. If that breakout occurs, the next major target for BTC is around $128,000.
That said, the market rarely moves in a straight line.
As outlined in the chart, I’ve considered three potential scenarios for BTC to unfold this summer.
New trades will be based on these movements, with optimal entries either at the yellow-highlighted zones or upon a confirmed breakout above the current weekly resistance.
Disclaimer:
This analysis is based on my personnal views and is not a financial advice. Risk is under your control.
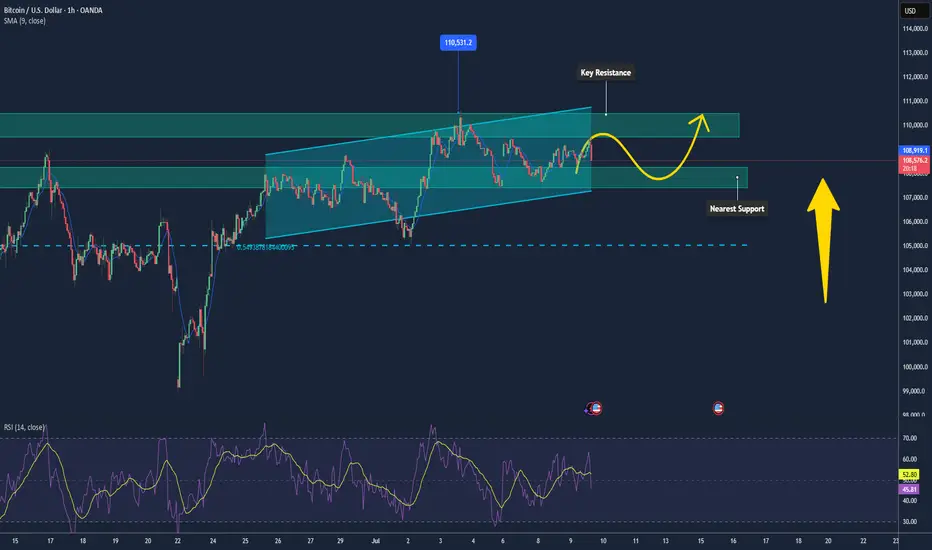
Bitcoin Maintaining Mild Uptrend, Poised Toward $110k📊 Market Overview:
• Strong ETF inflows continue, with over $13.5 billion in YTD flows into BTC, now making up nearly 70% of gold ETF inflows.
• Institutional investors like BlackRock (IBIT currently holds ~700k BTC) are still accumulating. The U.S. is also building a “Strategic Bitcoin Reserve,” reinforcing long-term confidence.
📉 Technical Analysis:
• Key Resistance: $109,000–$110,000, opening the path toward $110,500–$110,600 (Supertrend around $110,174).
• Nearest Support: $108,300 (EMA), followed by $107,800–$108,000; deeper pullback support at $105,000.
• EMA 09: Price is above this EMA → short-term trend remains bullish.
• Candlestick/Volume/Momentum: RSI is neutral around 58; MACD is converging near the zero line, signaling weakening bearish momentum and possible base formation.
📌 Outlook:
Bitcoin may continue its mild upward movement if it holds above $108,300–$108,000 and breaks clearly above $109k–110k with strong volume. Failure to do so could trigger a pullback toward $107,000–$108,000.
💡 Suggested Trading Strategy:
📉 SELL BTC/USD at: 109,500–110,000
🎯 TP: 108,000
❌ SL: 110,400
📈 BUY BTC/USD at: 108,200–108,500
🎯 TP: 109,500–110,000
❌ SL: 107,800