BTCUSD Analysis – Riding the Mind Curve & Bullish Setup Target🔎 Technical Narrative & Market Structure Analysis
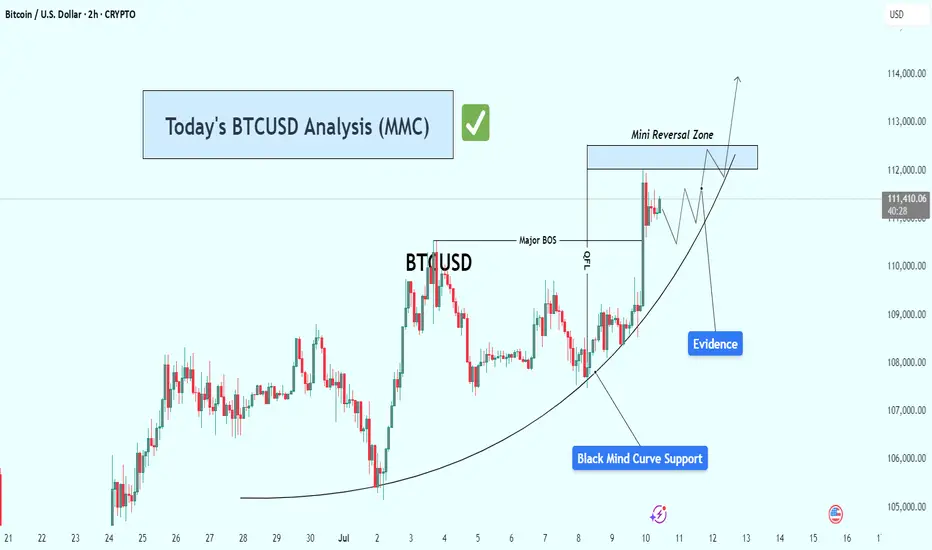
Bitcoin is currently respecting a textbook parabolic support structure represented by the Black Mind Curve—a dynamic visual model reflecting the psychology of crowd behavior transitioning from uncertainty to confidence. This curved structure often precedes strong bullish continuation patterns, especially when paired with evidence of smart money involvement.
The current price action shows sequential higher lows, each of which is supported directly by the Mind Curve. These bounces confirm demand stepping in consistently at higher levels, a strong sign of controlled accumulation and momentum building.
🧠 Key Chart Components Explained
✅ 1. Mind Curve (Dynamic Support)
A custom-drawn parabolic curve reflects the ongoing upward force from buyers.
Bitcoin has tested and bounced from this curve multiple times, showing it is respected by market participants.
As price hugs the curve more tightly, the compression could lead to a volatility breakout.
✅ 2. Major BOS (Break of Structure)
A significant market structure break occurred as price took out a previous swing high.
This BOS confirms a shift in market sentiment from ranging/sideways to uptrend formation.
The BOS now acts as a reference point for bullish momentum and could serve as support on a potential retest.
✅ 3. QFL Zone (Quantity following line )
Located just below the BOS, this zone marks the last area where aggressive buyers stepped in before the breakout.
These levels are often defended on a retest and are used by institutional traders to re-enter positions.
✅ 4. Evidence Candle
This sharp bullish impulse candle is what we call an "evidence candle"—it pierces minor resistances with strength and volume.
It represents institutional-level interest and confirms smart money accumulation.
Such candles typically precede either continuation or minor pullback for re-accumulation.
✅ 5. Reversal Zone (Target Zone)
This zone lies ahead at approximately 112,500 to 113,000, a confluence of previous supply, key psychological level, and potential liquidity pool.
It's the next logical area where price may pause, react, or break through if momentum sustains.
⚔️ Scenarios to Watch
🟩 Bullish Scenario:
Price continues riding the curve support upward.
Breaks and closes above the Reversal Zone, ideally with volume and continuation candle.
Potential upside extension toward 114,000–115,000.
🟨 Neutral/Consolidation Scenario:
Price consolidates just below the Reversal Zone.
May form a flag/pennant or triangle structure.
Bullish continuation likely if the curve holds beneath.
🟥 Bearish/Invalidation Scenario:
Price breaks below the Mind Curve and BOS, closing below with momentum.
This would signal a potential breakdown of the bullish structure.
Invalidation zone likely sits below 110,000, and a breakdown could open room to revisit the 108,500–109,000 area.
📌 Confluence Factors Supporting the Bullish Bias:
Respect of Mind Curve over time = hidden institutional support
Presence of BOS and QFL = structure and order block confluence
Evidence candle = high-volume trigger point
Reversal Zone = logical magnet for price, supported by liquidity and previous reactions
📈 Summary & Trading Thesis
Bitcoin is currently in a bullish microstructure within a larger range. The parabola-style Mind Curve suggests that this structure is maturing toward an inflection point. The break above BOS, evidence of strength, and alignment with demand zones all support a move toward the 112,500–113,000 Reversal Zone. If momentum sustains, this could become the start of a broader bullish leg.
📢 Final Thought:
While the setup is bullish, discipline and patience are key. Watching how price behaves around the Reversal Zone will be critical. A clean breakout or solid rejection will provide the next high-probability signal.
BTCUSD.PM trade ideas
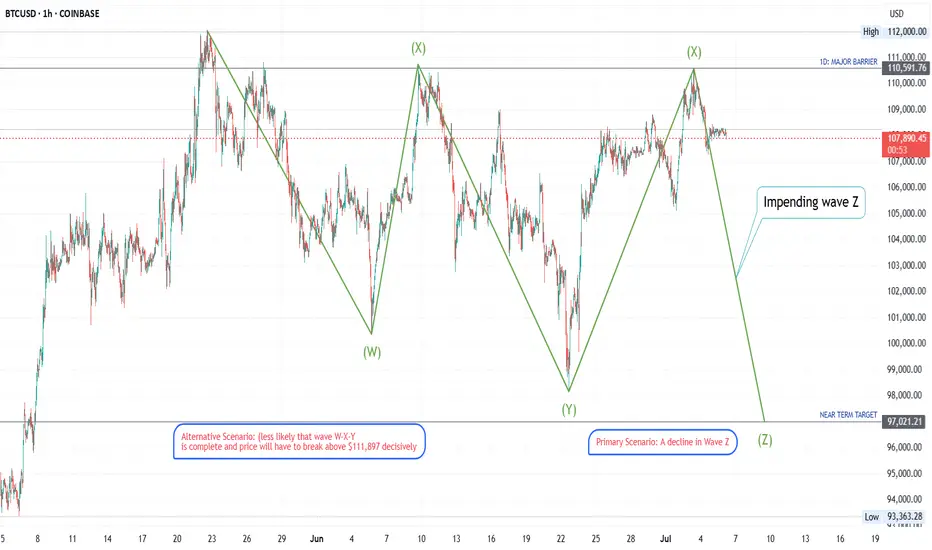
Wave Pattern: Complex Correction (Triple Three) on BITCOINThe price action on this BTC chart displays the characteristics of an overlapping, sideways, and downward-drifting nature of the price swings strongly indicates a complex corrective pattern. The most fitting pattern is a Triple Three, denoted as W-X-Y-X-Z. This is an extended consolidation pattern composed of three simpler corrections (W, Y, and Z) linked by two intervening waves (X).
Most Probable Next Moves
Based on the identification of the market being at the end of a second Wave X, the following are the most probable scenarios:
Primary Scenario: A Decline in Wave Z
The highest probability path is a decline in Wave Z.
Immediate Move: The price is expected to turn down from the current resistance area (the peak of the second Wave X, roughly $110,600).
Structure of the Move: Wave Z will itself be a corrective pattern, most likely another zig-zag (structured as A-B-C down).
Price Target: A common characteristic of a Triple Three is that Wave Z will often push to a new low for the entire structure. The chart's pre-marked "NEAR TERM TARGET" at $97,021 is a logical objective. This would involve breaking below the previous Wave Y low of $98,225.
Alternative Scenario (Less Likely)
A less probable scenario is that the entire W-X-Y correction completed at the June 23rd low. In this case, the rally since then would be the beginning of a new impulsive uptrend (Wave 1). This is considered less likely because the rally from late June to early July appears corrective and lacks the powerful, non-overlapping structure typical of a new impulse wave. For this scenario to gain credibility, the price would need to decisively break above the major barrier at $111,897.
5-Step BTC Masterplan: High-Conviction Swing Trades Until Jan 26Hey Traders! 👋
I’ve built a multi-phase #Bitcoin trading strategy based on historical highs/lows and key confluence levels (trend + Fibonacci). If you're looking to ride #BTC’s volatility with clear direction and logic — this plan is for you!
💡 No overtrading. No leverage needed. Just strategic entries and patience.
👇 Check out the roadmap:
✅ 1st Move: Long #BTC — Starting NOW!
📅 Date: 9-May-25
📈 Entry: Current Market Price (CMP)
🎯 TP: 113,800
❌ SL: None (spot only)
🧠 Logic: Early breakout zone targeting resistance.
🚨 2nd Move: Short Setup
📅 Date: 15-Jul-25
📈 Entry: 113,000
🎯 TP: 80,800
🛑 SL: 121,000
🧠 Logic: Major resistance + likely correction.
✅ 3rd Move: Buy the Dip
📅 Date: 15-Oct-25
📈 Entry: 81,800
🎯 TP: 92,500
🛑 SL: 73,000
🧠 Logic: Retest of long-term support.
🚨 4th Move: Short Again
📅 Date: 2-Dec-25
📈 Entry: 91,800
🎯 TP: 61,850
🛑 SL: 101,000
🧠 Logic: Lower high, macro pullback likely.
✅ 5th Move: The Final Long!
📅 Date: 1-Jan-26
📈 Entry: 62,100
🎯 TP: 119,500
❌ SL: None (spot only)
🧠 Logic: Long-term support & trend reversal.
📊 This is not financial advice — just one trader’s structured roadmap.
🧠 Let the chart tell the story — emotions off, plan on.
💬 What do YOU think? Which move are you most aligned with? Drop your thoughts below!
👍 Like if this helped. 🔔 Follow for real-time trade updates & deeper analysis!
#BTC #Bitcoin #CryptoTrading #SwingTrade #TechnicalAnalysis #TradingPlan #Fibonacci #TrendReversal #HODL #BearTrap #BullTrap #Altcoins #CryptoStrategy #LongShort #SpotTrading


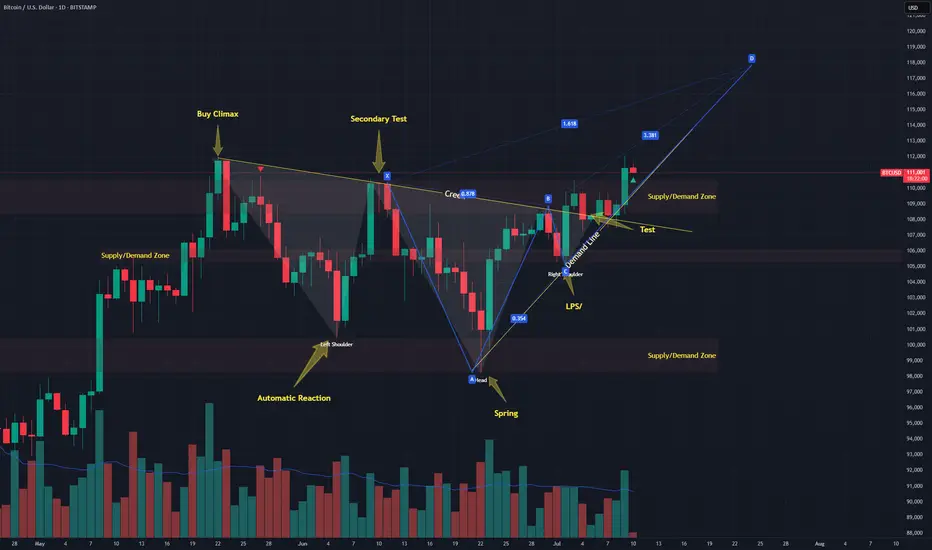
Bitcoin forming a possible deep crabLast week I published a thesis that #Bitcoin might be in a #Wyckoff re-accumulation pattern and we had an ugly ass inverse head and shoulders forming as a part of it.
Well know that test on the creek formed a BC leg of a possible Deep crab. 1.618 is ~117k. Lots of confluence
BTCUSD📈 Bitcoin (BTCUSD) Market Update
Current Price: $105,000.00
Outlook: Strongly Bullish
Bitcoin is currently trading at $105,000 and showing continued bullish momentum. Price action indicates strong demand at current levels, with technical structure suggesting potential for an explosive move upward.
Key Insight:
Buy pressure remains dominant, with no immediate signs of reversal. BTC is holding above key support zones and appears poised for a continuation rally.
📊 Trade Idea:
Bias: Long (Buy)
Entry Zone: Market Price (~$105,000)
Short-Term Targets:
🎯 Target 1: $110,000
🎯 Target 2: $120,000
🎯 Target 3: $130,000
Note: Monitor for consolidation above $105,000 as a base for further upside. Risk management remains essential—adjust stop-loss levels as per your strategy.

Bitcoin Longer: Clear Blue Skies for Wave 3 of 5As I explained in this video, I believe that we are currently in a wave 3 of 5 for Bitcoin and we should be breaching new highs as we have an undergoing wave 3. However, take note that the risk-reward is not good to go long. So I would recommend holding if you already have a position but to be very cautious if you are thinking of initiating a new long position.
The stop loss is $109,700. The near-term take profit is $113,923 before a potential pull back and then up to $115,000.
Good luck!

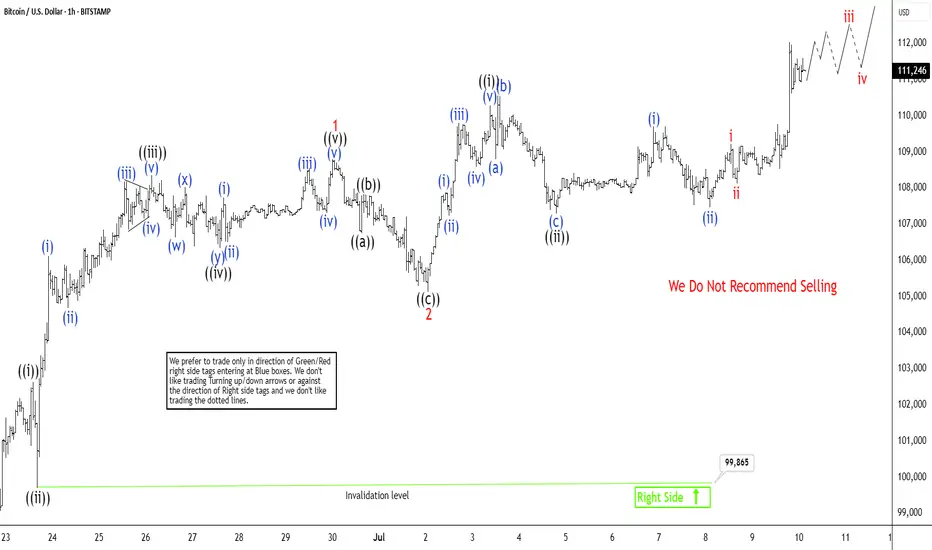
Bitcoin (BTCUSD) Breaking to New All Time HighBitcoin (BTCUSD) has recently achieved a new all-time high, signaling the onset of the next upward phase in its price trajectory. From the significant low recorded on June 22, 2025, at $98,240, Bitcoin has exhibited a robust five-wave advance, reinforcing the bullish outlook. This rally aligns with a classic five-wave impulse structure per Elliott Wave theory, a framework often used to forecast market trends. Starting from the June 22 low, wave ((i)) peaked at $102,647. It was then followed by a corrective pullback in wave ((ii)) to $99,865. The cryptocurrency then surged in wave ((iii)) to $108,358. Wave ((iv)) concluded at $106,351 after a brief dip. The final leg, wave ((v)), culminated at $108,800, completing wave 1 of a higher-degree impulse.
Subsequently, Bitcoin experienced a wave 2 correction, retreating to $105,130. From this level, it has begun nesting higher in wave 3. This is a phase often associated with strong momentum. Within this structure, wave ((i)) reached $110,292. Wave ((ii)) pullback followed to $107,303, forming an expanded flat pattern. Further subdividing, wave (i) peaked at $109,717, with wave (ii) dips concluding at $107,471. In the near term, as long as the pivotal low at $99,865 remains intact, any pullbacks are likely to attract buyers in a 3, 7, or 11-swing sequence, supporting further upside. This technical setup suggests Bitcoin’s bullish momentum is far from exhausted, with higher levels anticipated as the wave structure continues to unfold.
Price: ~$107,900 Trend: Consolidating after a breakout from a dCurrent Setup Analysis
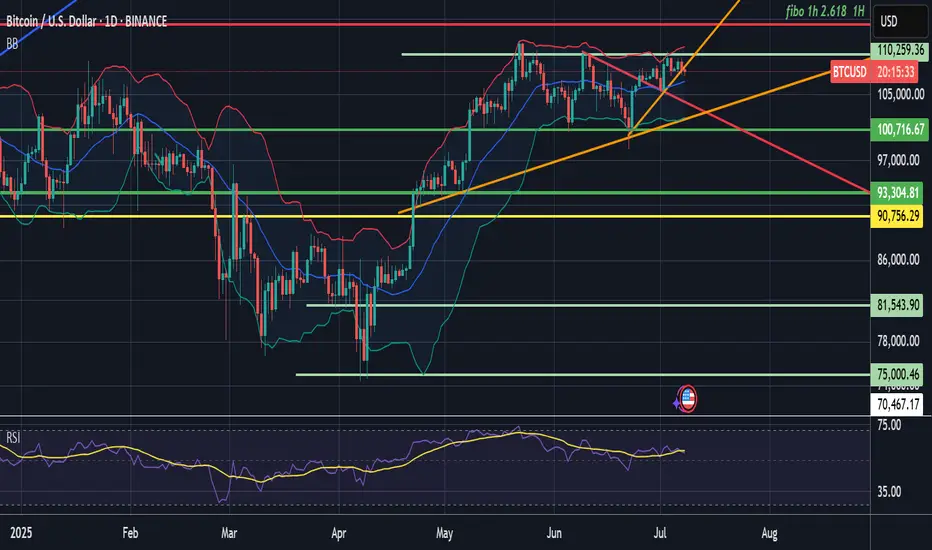
BTC broke out of a falling wedge pattern (red trendline) and is holding above support near $100K.
Higher lows since June indicate bullish accumulation.
The price is riding above the ascending orange trendline.
Bollinger Bands suggest potential continuation; RSI isn’t overbought.
▶️ Buy Setup (Long Bias)
Entry (Buy): Between 107,500–108,000
Stop Loss: Below 104,000 (just under trendline and BB midline)
Target 1: 110,259 (key horizontal + BB upper area)
Target 2: 112,000 (psychological resistance)
Target 3: 114,266–116,000 (Fibo 2.618 + extension zone)
Sell Setup (Short Bias) – only if rejection
Entry (Sell): If there's a clear rejection candle near 110,000–112,000
Stop Loss: Above 114,500
Target 1: 100,716
Target 2: 93,304
This is a low-probability setup unless rejection is clear.
Final Recommendation
High probability of bullish continuation (above 60%)
Prefer a buy-the-dip strategy with stop under $104K
Watch 110K area — could act as a breakout or rejection point
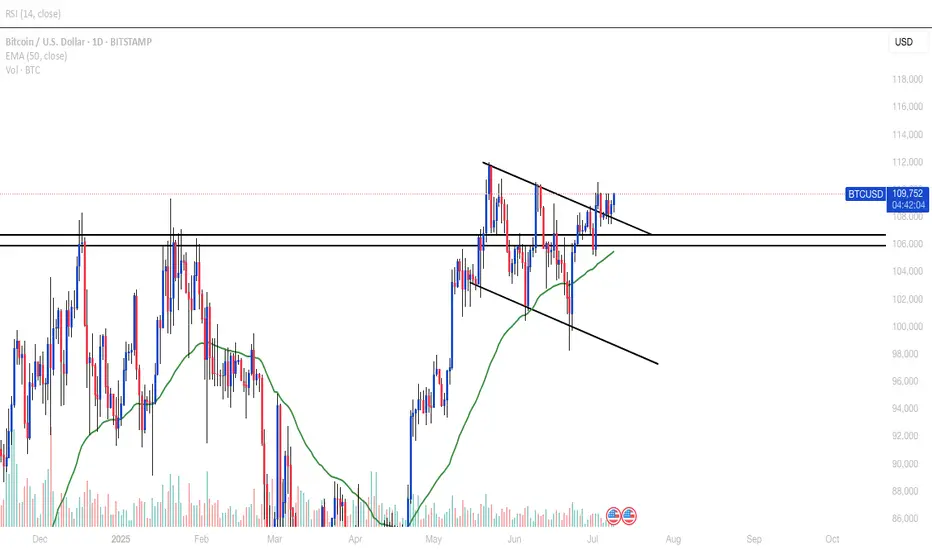
BTCUSD · 3D — Bearish Divergence + Volume Drop Suggest Pullback
🧠 Setup Overview
Bitcoin is showing signs of exhaustion after a parabolic rally:
Bearish divergence is visible on the 3D RSI — price made higher highs while RSI made lower highs.
Volume is shrinking with each push up, suggesting buyer momentum is fading.
Price is pressing into all-time highs without conviction, signaling potential for a pullback.
🔻 Downside Targets
Target 🎯 Level Why It Matters
Target 1 $92,300 (50% Fib) Midpoint of last impulse + first strong demand area.
Target 2 $82,500 (61.8% Fib) Volume-profile support + key confluence zone.
🔎 What Confirms the Setup?
Breakdown below $108K structure
Daily close below $105K with increasing volume
RSI losing midline support = momentum shift confirmed
❌ Invalidation
Daily close > $112K with strong volume = idea invalid
Would suggest continuation toward blue-sky breakout
✅ Summary
Bearish divergence + volume drop = classic topping signals
Risk is well-defined, with Fib-backed targets offering clean R:R
Trade cautiously — momentum is fading, not gone yet
📛 Disclaimer: This is not financial advice. Do your own research and manage risk according to your plan.
#Bitcoin #BTC #CryptoAnalysis #BearishDivergence #RSI #VolumeProfile #Fibonacci #TradingView

BTCUSD · 3D — Bearish Divergence + Volume Drop Suggest Pullback
🧠 Setup Overview
Bitcoin is showing signs of exhaustion after a parabolic rally:
Bearish divergence is visible on the 3D RSI — price made higher highs while RSI made lower highs.
Volume is shrinking with each push up, suggesting buyer momentum is fading.
Price is pressing into all-time highs without conviction, signaling potential for a pullback.
🔻 Downside Targets
Target 🎯 Level Why It Matters
Target 1 $93,300 (50% Fib) Midpoint of last impulse + first strong demand area.
Target 2 $82,500 (61.8% Fib) Volume-profile support + key confluence zone.
🔎 What Confirms the Setup?
Breakdown below $108K structure
Daily close below $105K with increasing volume
RSI losing midline support = momentum shift confirmed
❌ Invalidation
Daily close > $112K with strong volume = idea invalid
Would suggest continuation toward blue-sky breakout
✅ Summary
Bearish divergence + volume drop = classic topping signals
Risk is well-defined, with Fib-backed targets offering clean R:R
Trade cautiously — momentum is fading, not gone yet
📛 Disclaimer: This is not financial advice. Do your own research and manage risk according to your plan.
#Bitcoin #BTC #CryptoAnalysis #BearishDivergence #RSI #VolumeProfile #Fibonacci #TradingView

₿itcoin: ATHBitcoin recently marked a new all time high. Our primary expectation is for an even bigger breakout to the upside, allowing green wave B to reach its peak within the upper blue Target Zone between $117,553 and $130,891. After this corrective high, we anticipate a sharp sell-off during green wave C, which should drive Bitcoin down into the lower blue Target Zone between $62,395 and $51,323—where we also expect the low of the larger orange wave a. This move should, for now, signal the start of another corrective rally along orange wave b, with a retest of the freshly marked all-time high well within reach. Once this countertrend move concludes, another significant decline should follow as orange wave c develops, targeting the low of the higher-level blue wave (ii). Alternatively, there remains a 30% chance that the preceding wave alt.(i) is still in progress, which could result in a direct breakout above resistance at $130,891.
📈 Over 190 precise analyses, clear entry points, and defined Target Zones - that's what we do.

Double Top Monthly TimeframeBitcoin Monthly – Double Top + Bearish Divergence (MACD & RSI) | Bull Cycle Over? [/b
Technical Breakdown:
We're witnessing strong signals that the Bitcoin bull cycle could be over. Here's why:
1. Monthly Double Top
Price has failed to break convincingly above the previous ATH 112k
Two clear peaks on the monthly chart, forming a classic double top pattern.
2. Bearish Divergence – RSI & MACD
MACD and RSI: Lower highs while price made equal/higher highs → Momentum weakening.
Trend reversal likely - level to watch 89k breaking this bullish trend line level, bitty will be shifting to a bearish trend..
It's too early and too bold to short and call the top is in — you need to trust your chart.
Bearish divergence confirmed
Likely end of 2023-2025 bull cycle
The permabulls won’t like this — but charts don’t bend to hopium

Bitcoin Strategic Breakout at the Threshold of Silence!⊣
⟁ BTC/USD - BINANCE - (CHART: 1D) - (Jul 09, 2025).
◇ Analysis Price: $110,767.80.
⊣
⨀ I. Temporal Axis - Strategic Interval - (1D):
▦ EMA9 - ($108,767.55):
∴ Price remains above the 9-day EMA, maintaining a short-term bullish posture;
∴ The moving average acts as dynamic support with positive slope.
✴️ Conclusion: Immediate trend remains intact, with momentum supported at $108,767.55.
⊢
▦ EMA21 - ($107,663.85):
∴ EMA21 acts as the structural support of the medium-term trend;
∴ Price maintains a healthy gap above it, confirming bullish continuity.
✴️ Conclusion: Structural integrity remains bullish - no threat of reversal below $107,663.85.
⊢
▦ Ichimoku Cloud - (Senkou A: $106,870.32 / Senkou B: $105,173.14):
∴ Price is clearly above the Kumo, with bullish Tenkan/Kijun alignment;
∴ Lagging Span (Chikou) is above both price and cloud - clean trend confirmation.
✴️ Conclusion: Primary trend remains bullish; cloud structure provides layered support between $106,800 and $105,100.
⊢
▦ RSI - ($61.33):
∴ RSI is rising, currently at 61.33, still below the overbought threshold;
∴ No divergence or bearish signal present; EMA9 of RSI is supportive at 56.94.
✴️ Conclusion: Momentum is healthy and climbing - room to extend toward the 70 level.
⊢
▦ MACD - (MACD Line: 251.71 / Signal Line: 836.26):
∴ Recent bullish crossover confirmed; histogram turning increasingly positive;
∴ MACD shows early-stage trend resumption with growing momentum.
✴️ Conclusion: Renewed bullish phase underway - MACD structure confirms sustained strength.
⊢
▦ Volume + EMA21 - (Current: 352.24 / MA: 244):
∴ Current daily volume significantly exceeds 21-day average;
∴ The breakout candle is technically validated by volume strength.
✴️ Conclusion: Real buying presence behind the move - not a hollow breakout.
⊢
🜎 Strategic Insight - Technical Oracle:
∴ All technical indicators are in alignment;
∴ Price is supported by volume, short-term EMA's, bullish Ichimoku structure, and clean RSI/MACD momentum;
∴ The price is approaching the (ATH - $111,317.37) and any confirmed close above it, backed by volume, could trigger a Fibonacci-based extension toward - ($115,000 / $117,300).
⊢
∫ II. On-Chain Intelligence - (Source: CryptoQuant):
▦ Exchange Inflow Total - (All Exchanges) - (13.4K Bitcoin):
∴ No abnormal spikes - inflows remain historically low.
✴️ Conclusion: Selling pressure is absent - no signs of miner or whale unloading.
⊢
▦ Exchange Reserve - (Binance) - (537.4K Bitcoin):
∴ Continuous outflow trend - reserves have declined sharply in recent weeks.
✴️ Conclusion: Structural supply contraction - classic hallmark of accumulation.
⊢
▦ Funding Rates - (All Exchanges)- (+0.006%):
∴ Slightly positive, well within neutral zone - no euphoria.
✴️ Conclusion: Leverage is present but controlled - not overheating.
⊢
▦ Open Interest - (All Exchanges) - (gradually increasing):
∴ OI rising gradually without abrupt spikes.
✴️ Conclusion: Positions are being built systematically - not impulsively.
⊢
🜎 Strategic Insight - On-Chain Oracle:
∴ The breakout is not driven by leverage, but rather by spot accumulation and institutional withdrawal;
∴ This environment mirrors previous (pre-expansion) phases (notably late 2020), when reserves declined and funding stayed flat;
∴ All vectors are aligned - a structurally sound rally is underway.
⊢
⧈ Codicillus Silentii - Strategic Note:
∴ The market exhibits complete silence beneath price - no inflows, no speculative buildup;
∴ Only those attuned to the deeper rhythm perceive the pressure building within this compressed structure;
∴ The Codex observes no disruptive anomalies; the energy is latent, not explosive - yet.
⊢
▦ Tactical Range Caution:
∴ Immediate Support: $108,767.55 - (EMA9);
∴ Structural Support: $107,663.85 - (EMA21);
∴ Previous ATH: $111,317.37;
∴ Breakout Extension Target: $115,000 - $117,300.
⊢
𓂀 Stoic-Structural Interpretation:
▦ Structurally Bullish - Tactically Confirming.
⊢
⧉
Cryptorvm Dominvs · ⚜️ MAGISTER ARCANVM ⚜️ · Vox Primordialis
⌬ - Wisdom begins in silence. Precision unfolds in strategy - ⌬
⧉
⊢

BTC Live: Resistance 111592/ Breakout soon or 109440 first?In this short video breakdown, we reviewed some key structural levels. We've identified a resistance at 111.592, which is critical for near-term price action. However, zooming out to the bigger picture, the major resistance to watch sits at 114.921 — this is a level we’ve respected many times before and could act as the next big test if momentum continues upward.
On the support side, we've previously leaned on 109.079, and we're now observing strong confluence zones thanks to our Fibonacci pull — notably around 110.505, lining up with the 0.61 and 0.5 retracement levels.
What we’re seeing is an ascending channel in play. If we break and hold above 111.592, that opens the door to challenge the 114.900 level. Until then, price might need to consolidate or retest some of these key supports.
Always worth checking past ideas to see how significant some of these zones have been historically. This wasn’t a fakeout — just part of the bigger structure.
Are you watching the same levels? Let me know your setups — it's always great to see different perspectives in the community.
One Love,
The FXPROFESSOR 💙
Disclosure: I am happy to be part of the Trade Nation's Influencer program and receive a monthly fee for using their TradingView charts in my analysis. Awesome broker, where the trader really comes first! 🌟🤝📈

Congratulations to those of us that took this trade we just hit Congratulations to those of us that took this trade we just hit take profit now

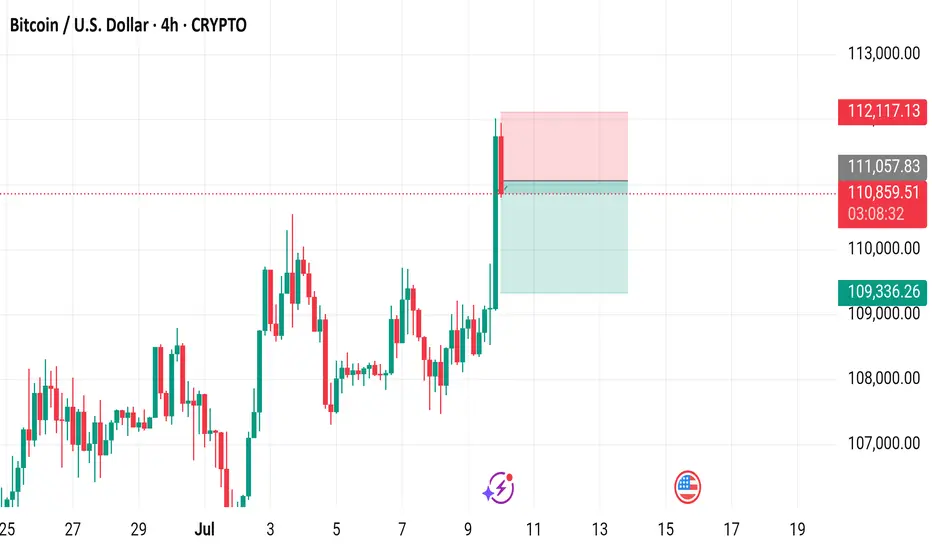
Bitcoin / U.S. Dollar 4-Hour Chart - CRYPTO4-hour candlestick chart displays the price movement of Bitcoin (BTC) against the U.S. Dollar (USD) from late June to mid-July 2025. The current price is $110,838.12, reflecting a 1.75% increase (+$1,908.56). The chart highlights a recent significant upward movement, with a notable green candlestick indicating a strong buying trend. Key price levels include a support zone around $109,336.26 and resistance near $112,117.13. The chart also shows buy and sell options at the current price level of $110,838.11.
Bitcoin on Fire: Targeting $110K in Relentless Uptrend!Hi traders! , Analyzing BTC/USD on the 30 minute timeframe, price is currently respecting an upward channel and showing consistent higher highs and higher lows. The recent bounce from dynamic support suggests bullish continuation.
🔹 Entry: 109,545
🔹 Take Profit (TP): 110,612
🔹 Stop Loss (SL): 108,438
Price is trading above both the 50 and 200 EMA, confirming bullish momentum. The RSI remains above the midline, indicating buyers are still in control. This long setup offers a favorable risk-reward ratio within the context of the broader uptrend.
A confirmed breakout from the short-term resistance, combined with trendline support and channel structure, adds confluence to this idea. Watch for potential resistance near the 110,612 zone.
⚠️ DISCLAIMER: This is not financial advice. Every trader is responsible for their own decisions and risk management.

Bitcoin - Liquidity grab at $111.000?This 4-hour BTCUSD chart illustrates a potential short-term bullish continuation scenario followed by a deeper retracement, highlighting key liquidity levels and an important Fair Value Gap (FVG) support zone.
Liquidity sweep
At the top of the current price action, just above the $110,612.16 level, there is a clear area of resting liquidity. This zone has likely accumulated a significant number of stop-loss orders from traders who are shorting the market or who went long earlier and are protecting profits below previous highs. The market tends to seek liquidity to fill institutional orders, making this zone a high-probability target for a sweep. As a result, price is likely to take out these resting stop orders in a quick upward move, often referred to as a "liquidity grab" or "stop hunt", before potentially reversing or consolidating.
Bullish 4H FVG
Following this liquidity sweep, the chart suggests a retracement into a bullish 4-hour Fair Value Gap (FVG) located around the $106,600 to $107,400 region. This imbalance zone was formed during an impulsive move up, leaving behind a gap between the wicks of consecutive candles. Such gaps represent areas where demand previously overwhelmed supply, and they often act as strong support on a retest. If price revisits this zone, it is expected to offer support and could serve as a base for another upward push, assuming bullish momentum remains intact.
Downside risk
However, if the bullish FVG fails to hold as support and price breaks down through this imbalance zone, it would signal a weakening of bullish structure. In that case, the breakdown would likely lead to a deeper correction or even a trend reversal, with price seeking lower levels of support further down the chart. This would invalidate the short-term bullish scenario and suggest that sellers are gaining control, possibly triggering further liquidations and more aggressive selling pressure.
Conclusion
Overall, the chart is currently leaning bullish, anticipating a liquidity sweep to the upside followed by a potential pullback into the FVG. The reaction at the FVG will be critical in determining whether the market can continue higher or if it shifts into a deeper bearish correction.
Disclosure: I am part of Trade Nation's Influencer program and receive a monthly fee for using their TradingView charts in my analysis.
Thanks for your support.
- Make sure to follow me so you don't miss out on the next analysis!
- Drop a like and leave a comment!

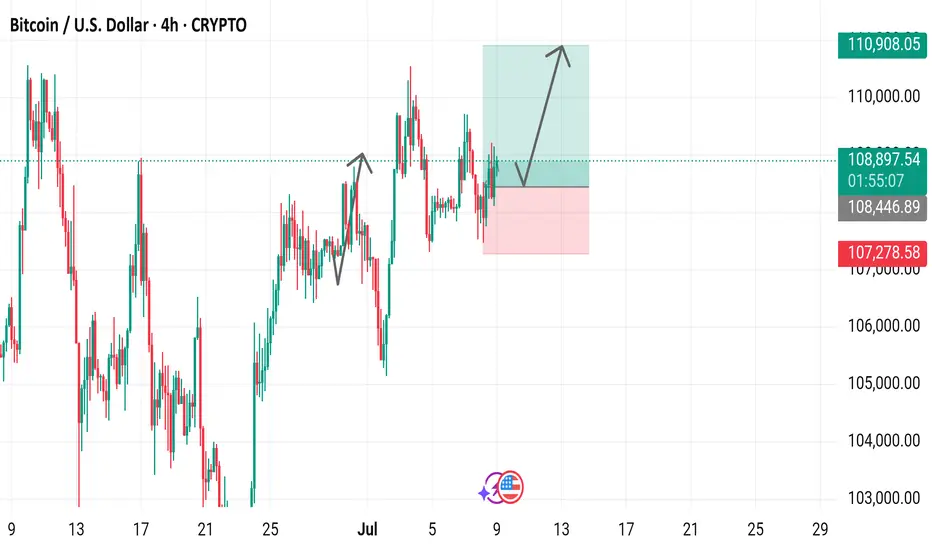
Bitcoin / U.S. Dollar 4-Hour Chart (BTCUSD)4-hour candlestick chart displays the price movement of Bitcoin (BTC) against the U.S. Dollar (USD) from late June to early July 2025. The current price is $108,895.04, with a 24-hour change of +$619.70 (+0.57%). Key levels include a support zone around $107,278.58 and a resistance near $110,908.05. The chart highlights recent price action, including a potential upward trend indicated by a green shaded area, with buy and sell signals marked at $108,895.04.

Fake pumpWe had a good run.
BTC is due a correction.
Weekly RSI is Overbought.
Trendlines match fibonacci zones.
Overall fundamentals seem good longterm, but market needs a reset.
Many shorts to be liquidated in 115-117k , more than a billion dollars.
A billion dollars worth of longs to be liquidated at 97k.
Betting on fake pump,majorly overbought daily RSI, liquidate shorts, dump bitcoin, liquidate longs, load and reset.
95k seems reasonable, but theres a Fair Value Gap at 91k, and these get filled almost every time.With a spike through to the 0.61 fibonacci at 88k.
Possibility of 80k if theres a black swan mass panic event, this will touch the 0.78 fib and touch an unbroken bullish trendline from 2023. But very unlikely right now, just a healthy correction and reset before the true bull starts.
Alts will probably bleed hard, since faith is so shaken in them. Stack when theres mass fear.
After the next real pump rotation most probabably begins.
Good idea is to DCA at 95k, 90k is a solid zone, 80k would be absolutely perfect. Good levels for alts are corresponding to these prices.