BTC H2 2025 - H2 2026My idea of what I think will unfold the rest of the year and next year for BTC.
BTCUSD.PM trade ideas

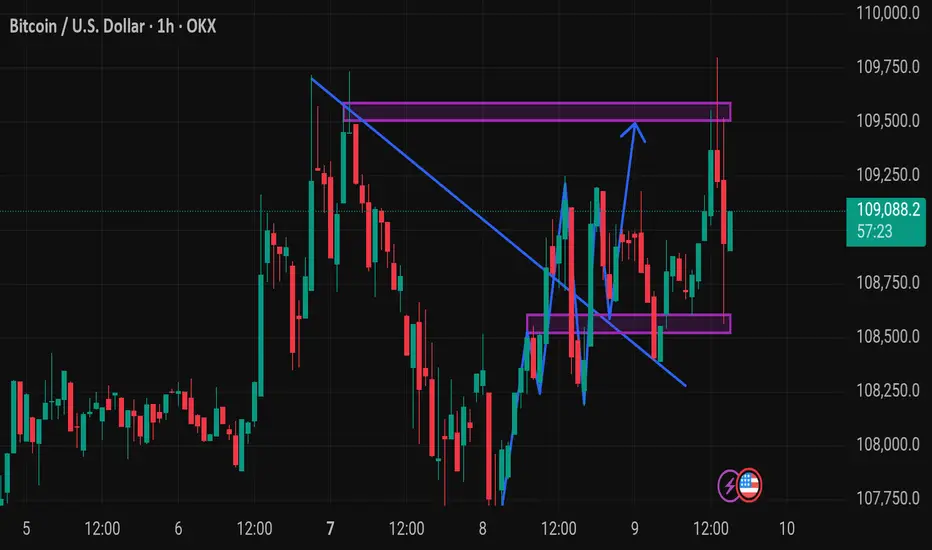
Btcusd techinical analysis.This BTC/USD 1-hour chart suggests a bullish breakout scenario. Here's a breakdown of key technical signals:
Key Observations:
1. Price Level: Current price is $109,582.1, with a recent rise of +0.59%.
2. Resistance Zones (Purple Boxes):
First resistance near $109,800 – $109,900.
Second (minor) resistance around $109,300 – $109,400.
Price is testing the upper resistance zone now.
3. Bullish W Pattern:
A sharp drop and recovery formed a “W” pattern—common before breakouts.
The neckline of this W is being challenged.
4. Trendline Breakout Projection (Blue Arrows):
The chart suggests a breakout projection towards $110,300 – $110,400.
This is based on the upward trajectory from the recent swing low.
5. Support Zone (Lower Purple Box):
Support established at $109,150 – $109,250.
If price

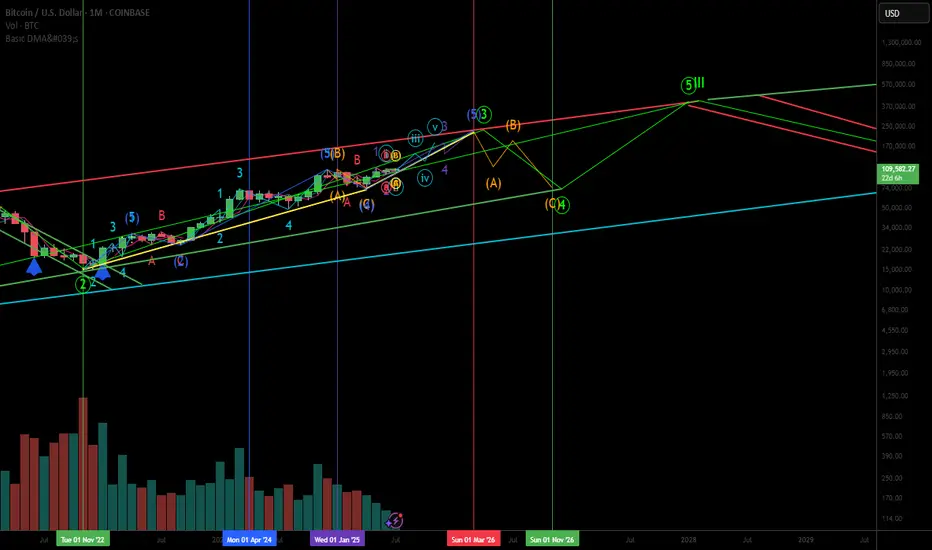
An Elliot Wave indicating a Bitcoin SupercyclePrimary cycle 3 ends approximately March 2026 at $225,000. Primary cycle 4 ends around Nov 2026 at $75,000. Primary cycle 5 and the end of cycle I ends near $400,000 in Jan 2028.
This illustrates Bob Loukas' latest thought toward an extended right translated bull Bitcoin cycle ending in early 2026 instead of the end of 2025. Then a shortened bear market that ends in Nov 2026, 4 years after the last bear cycle in Nov 2022.
Then a "left" translated cycle ending in Jan 2028 near $400,000 which completes Cycle I. It looks like a supercycle by combining the right translated current cycle with a left translated next cycle.
A good cycle strategy would be to take at least partial profit near $225,000, reaccumulate near $75,000 at the end of 2026 in anticipation of a big move up to near $400,000 by Jan 2028. A major sell at that point would be prudent. Loukas believes after a 12-16 month left translated cycle into early 2028 will be followed by a 2.5 year or more bear market to the end of 2030.
BTC about to cum?Just a reminder: These monthly candles may appear small, but they're all green for now. This doesn't look bearish; it looks like a buildup before an explosion.

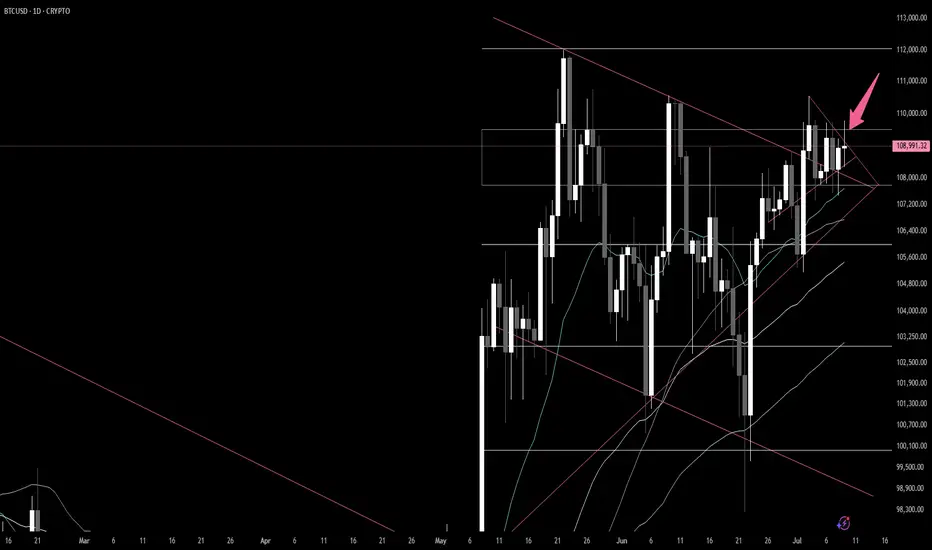
Breakout July 10, 2025Price is getting compressed in a smaller higher pennant above the upper limit bull flag. I suspect that we see one more sharp pullback in mid-late August before achieving cycle pico top. Brace yourselves, tomorrow should be the day!
BITCOIN - SELL TO $86,000 (8H VIEW)I see selling opportunities right now for Bitcoin.
⭕️LQ Swiped Above Previous Wave 3 High ($109,000).
⭕️Wave 4 Complex Correction Complete (5 Sub-Waves).
⭕️(Wave 5 Impulse Bullish Move Complete (5 Sub-Waves of 1,2,3,4,5).
❌Invalidation Zone Above Wave 5 High ($112,140).
High risk trade as BTC could still head high for Wave 5 around $120- $130,000. Use strict risk management.

XRP breaks out: 19% rally in sightXRP has just broken out of an inverse head and shoulders pattern, a classic bullish setup that points to a potential 19% rally. The breakout comes at a time when the US is expected to deliver key crypto regulation updates by July 22. If the legal outcome is positive, it could fuel further upside not only in XRP but across the broader crypto market. This setup offers a strong risk-to-reward profile, especially if Bitcoin also breaks out of its current rectangle pattern.
This content is not directed to residents of the EU or UK. Any opinions, news, research, analyses, prices or other information contained on this website is provided as general market commentary and does not constitute investment advice. ThinkMarkets will not accept liability for any loss or damage including, without limitation, to any loss of profit which may arise directly or indirectly from use of or reliance on such information.

Analyst Highlight: Bitcoin Levels to Watch After new Highs $109KA close-up analysis of BTC's push beyond $109k: Short vs Long Mas, VWAP alignment, and potential retracement zones. Expert-scoped with easy-to-read annotations and key entry/exit gates- perfect for adding to your watchlist.

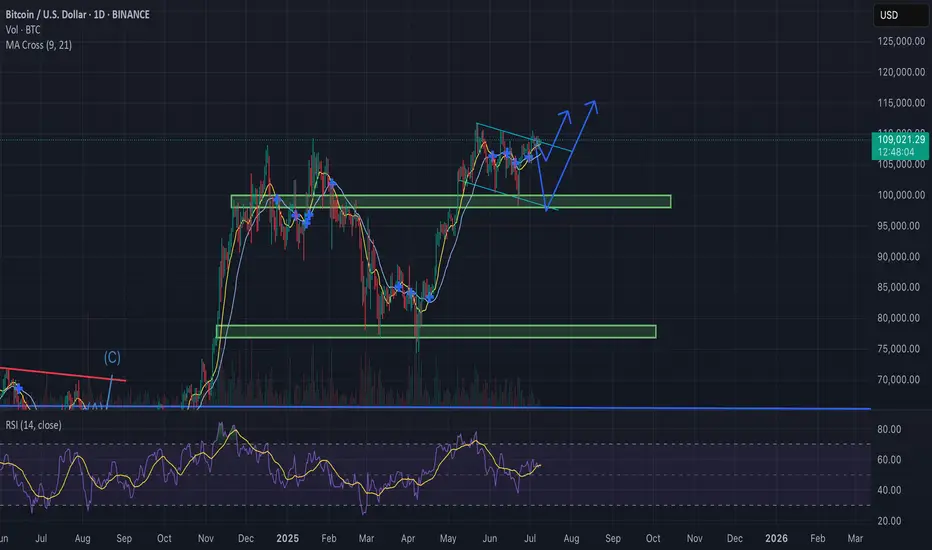
Bitcoin Update – Bullish Falling Wedge in Play?BTC/USD is currently trading near $108.8K, compressing within a falling wedge formation — historically a bullish continuation pattern, especially after a strong uptrend.
Why the Bias Remains Bullish:
Bullish MA Cross: Short-term MAs (9/21) are aligned for upside momentum.
Falling Wedge: Price compressing with lower highs and lows, coiling for a breakout.
RSI Strength: RSI (purple) remains elevated, supporting continued upside pressure.
Fundamental Catalysts:
Trump delays trade war announcements, reducing global uncertainty.
FOMC meeting in late July: Trump pushes for rate cuts, potentially bullish for risk assets like BTC.
If BTC breaks out above the wedge resistance with convincing volume:
Retest likely at ~$110K
Targets : $115K → $120K+

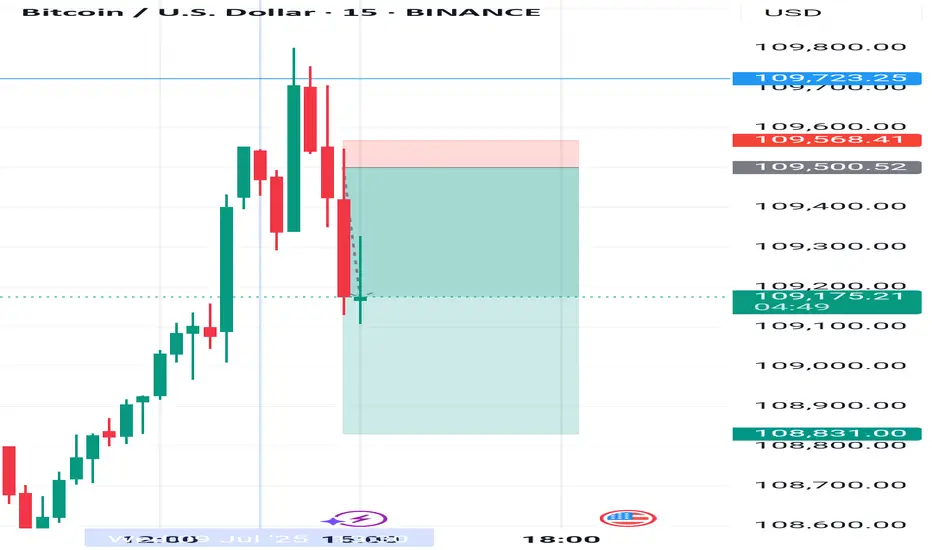
Trading balanceTrading balance The price of the asset has rebounded from the balance zone. With the prospect of growth into the resistance zone.
BTCUSD – Range High Retest at 110KBitcoin is consolidating below the 110,736.11 resistance after reclaiming support from the 102,558.1 zone. Price is holding a tight range, building pressure just under key resistance — a breakout above this could spark a move to new highs.
Support at: 102,558.1 🔽 | 91,357.7 🔽
Resistance at: 110,736.1 🔼 (range high)
🔎 Bias:
🔼 Bullish: Break and hold above 110,736.1 opens room for bullish continuation.
🔽 Bearish: A break back below 102,558.1 would suggest a potential shift toward 91,357.7 support.
📛 Disclaimer: This is not financial advice. Trade at your own risk.

possibility of uptrendIt is expected that the triangle pattern will form according to the specified paths, then there will be a possibility of a trend change and the beginning of the upward trend.
If the price crosses the support area, the continuation of the downward trend will be likely.
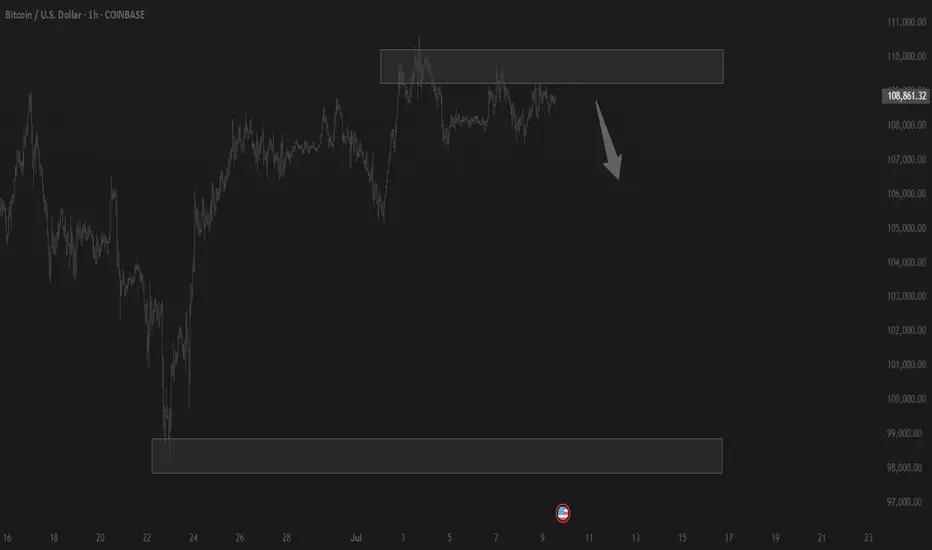
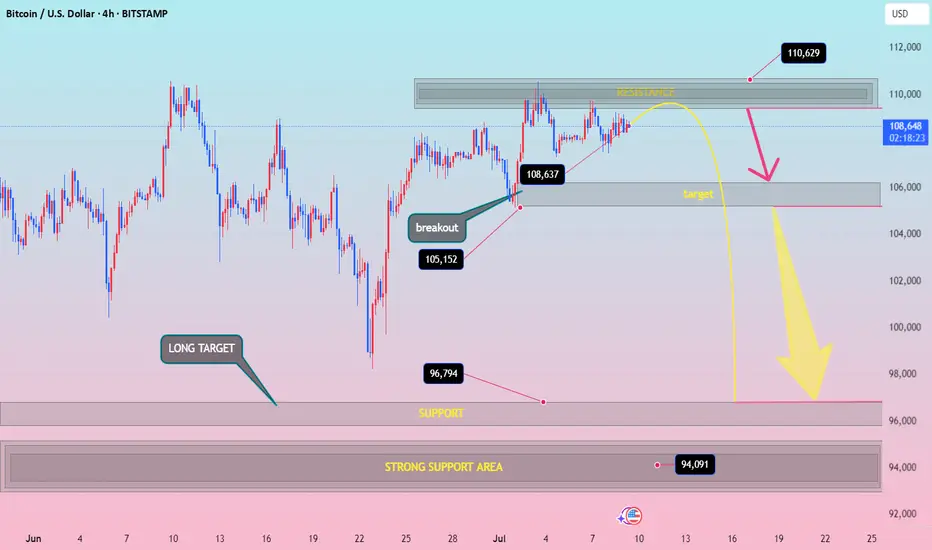
BTCUSD h4 down surelybtcusd down idia Resistance Zone: Around 110,000–111,000
Price Action Expectation:
→ Short-term push to 110,629
→ Then rejection toward 105,000, and potentially all the way down to 96,794 or even 94,091
Bearish bias after resistance is hit
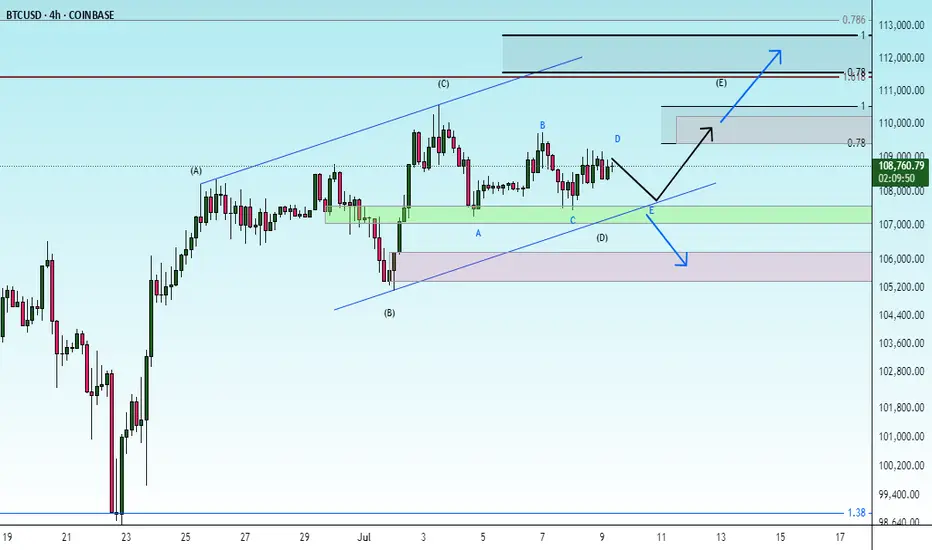
⚡ Disruption Analysis (Contrarian View)
✅ 1. Resistance Flip Possibility
What if the 110,000 resistance breaks cleanly with strong volume?
Invalidates the bearish rejection arrow
Could trigger FOMO buying → Acceleration toward 112,500+
Bullish scenario: formation of a bull flag above resistance = continuation setup
✅ 2. Bear Trap Theory at 105,000 Zone
That “target” zone near 105k could be a fake breakdown zone
Market might dip there briefly, lure shorts, then reverse violently
This creates liquidity for a rapid long squeeze breakout
✅ 3. Market Structure Still Bullish on HTF
Higher lows from June 24 to July 6
Clean breakout at 105,152
Still respecting ascending structure — which is not bearish yet
🚨 Disruption Summary Chart Moves
🔼 Alternate Path 1 (Bullish Disruption):
Price consolidates under resistance → breaks above 110,629 → targets 112,500–115,000
🔄 Alternate Path 2 (Fake Breakdown Disruption):
Drops to 105,000, triggers sell-off → sharp reversal → back above 108,637
🔽 Original Path (Rejection-Based Bearish):
Still possible — but not the only high-probability path anymore
BITCOIN turning the Bull Flag into Support??Bitcoin (BTCUSD) has been trading sideways, almost flat, since the July 03 High, supported by the 1D MA50 (blue trend-line).
Perhaps the strongest development of the week though is the fact that this consolidation has been taking place at the top (Lower Highs) of what we previously identified as a Bull Flag pattern.
Together with the 1D MA50, this Lower Highs trend-line forms a formidable Support, which as long as it holds, can technically fulfil the technical expectations out of this pattern and target the 2.0 Fibonacci extension at $168500.
Is this one step closer to our 'fair valued' $150k Target for this Cycle? Feel free to let us know in the comments section below!
-------------------------------------------------------------------------------
** Please LIKE 👍, FOLLOW ✅, SHARE 🙌 and COMMENT ✍ if you enjoy this idea! Also share your ideas and charts in the comments section below! This is best way to keep it relevant, support us, keep the content here free and allow the idea to reach as many people as possible. **
-------------------------------------------------------------------------------
💸💸💸💸💸💸
👇 👇 👇 👇 👇 👇

Bitcoin is ready for the breakout ?🤏 On #Bitcoin’s 3D chart, the Bollinger Bands have tightened to record levels — a signal that historically precedes massive moves. 🚀
📉 Volatility has also dropped to levels not seen since late 2024, right before #BTC launched from $26k to $70k.
✖️ Even John Bollinger himself, the creator of the indicator, hinted in his X post that a powerful impulse might be on the way.
Something’s brewing... 👀

BTCUSD – Quiet Push After the StormBTC plunged from $110K into $105.5K, then ground sideways in a long accumulation zone. Recent breakout took price toward $109.2K, but it stalled and faded slightly. Still holding structure. Bulls want a clean break over $109.5K to challenge $110K again.

Bitcoin H1 | Potential bounce off a multi-swing-low supportBitcoin (BTC/USD) is falling towards a multi-swing-low support and could potentially bounce off this level to climb higher.
Buy entry is at 107,504.00 which is a multi-swing-low support that aligns closely with the 61.8% Fibonacci retracement.
Stop loss is at 106,700.00 which is a level that lies underneath an overlap support.
Take profit is at 109,163.00 which is a swing-high resistance that aligns with the 78.6% Fibonacci retracement.
High Risk Investment Warning
Trading Forex/CFDs on margin carries a high level of risk and may not be suitable for all investors. Leverage can work against you.
Stratos Markets Limited (tradu.com ):
CFDs are complex instruments and come with a high risk of losing money rapidly due to leverage. 63% of retail investor accounts lose money when trading CFDs with this provider. You should consider whether you understand how CFDs work and whether you can afford to take the high risk of losing your money.
Stratos Europe Ltd (tradu.com ):
CFDs are complex instruments and come with a high risk of losing money rapidly due to leverage. 63% of retail investor accounts lose money when trading CFDs with this provider. You should consider whether you understand how CFDs work and whether you can afford to take the high risk of losing your money.
Stratos Global LLC (tradu.com ):
Losses can exceed deposits.
Please be advised that the information presented on TradingView is provided to Tradu (‘Company’, ‘we’) by a third-party provider (‘TFA Global Pte Ltd’). Please be reminded that you are solely responsible for the trading decisions on your account. There is a very high degree of risk involved in trading. Any information and/or content is intended entirely for research, educational and informational purposes only and does not constitute investment or consultation advice or investment strategy. The information is not tailored to the investment needs of any specific person and therefore does not involve a consideration of any of the investment objectives, financial situation or needs of any viewer that may receive it. Kindly also note that past performance is not a reliable indicator of future results. Actual results may differ materially from those anticipated in forward-looking or past performance statements. We assume no liability as to the accuracy or completeness of any of the information and/or content provided herein and the Company cannot be held responsible for any omission, mistake nor for any loss or damage including without limitation to any loss of profit which may arise from reliance on any information supplied by TFA Global Pte Ltd.
The speaker(s) is neither an employee, agent nor representative of Tradu and is therefore acting independently. The opinions given are their own, constitute general market commentary, and do not constitute the opinion or advice of Tradu or any form of personal or investment advice. Tradu neither endorses nor guarantees offerings of third-party speakers, nor is Tradu responsible for the content, veracity or opinions of third-party speakers, presenters or participants.

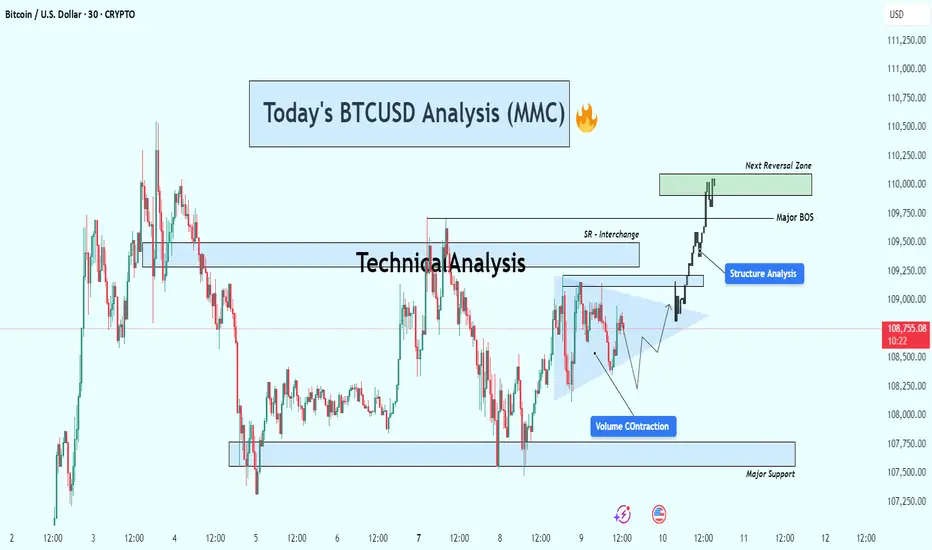
BTCUSD Breakout Confirmed – Targeting Next Reversal ZoneBitcoin (BTC/USD) is currently trading around $108,700, showing strong bullish momentum after breaking out of a consolidation structure. Price action has shifted significantly, with clear structural developments pointing toward continued upside — but not without caution around the next reversal zone.
🔍 Key Technical Insights:
🔹 1. Volume Contraction Triangle (Bullish Breakout)
The chart initially shows a volume contraction pattern forming a symmetrical triangle.
This pattern is often associated with market compression — a setup where smart money accumulates before a breakout.
BTC broke out of the triangle with strong bullish candles, confirming buyers have stepped in with conviction.
🔄 2. Structure Shift & Break of Structure (BOS)
A major BOS (Break of Structure) occurred as price broke previous swing highs, confirming a bullish market structure.
This BOS zone now acts as a potential support area if BTC pulls back.
A short-term SR interchange zone (Support becomes Resistance) was also respected and flipped again to support during the breakout — a clear sign of structural strength.
🧭 3. Next Reversal Zone – Supply in Sight
Price is approaching a major supply/reversal zone between $109,750 and $110,250.
This zone has previously shown strong selling interest.
Traders should watch for rejection or continuation patterns within this zone — such as bearish divergence, exhaustion candles, or confirmation of resistance.
🛡 4. Major Support Level
Below current price, a major support zone around $107,500–$107,800 remains intact.
This zone has provided a solid base during past consolidations and would be the first area of interest for buyers if a retracement occurs.
📌 Strategy Plan:
🔼 For Bullish Traders:
Those already in the breakout can hold with targets toward $110,000–$110,250.
If not in yet, wait for a retest of BOS/SR zone (~$109,000) for a safer re-entry.
Consider partial take-profits within the green reversal zone.
🔽 For Bearish Traders:
Watch for price exhaustion or a fake breakout in the reversal zone.
Potential short setups could form only if price fails to hold above the BOS zone and prints a lower high.
🔧 Technical Summary:
✅ Structure: Bullish Break of Structure confirmed
🔺 Momentum: Strong upside following volume contraction
📍 Next Key Resistance: $110,000–$110,250
📉 Major Support: $107,500–$107,800
⚠️ Caution Zone: Reversal area ahead – watch price action closely
Conclusion :
Bitcoin looks set to challenge the $110K psychological level as buyers remain in control. However, the reversal zone above is critical. A clean break and hold above it could open doors to further highs, while rejection here may trigger short-term pullbacks or range-bound conditions.
Quantum Computing - Why BTC isn't the biggest worryYou’ve probably heard that quantum computing could break Bitcoin’s encryption—and that’s true. But here’s the thing: Bitcoin might not even be the biggest target.
The real risks? Financial systems, national security, healthcare, and even the internet itself. These areas rely on the same encryption methods that quantum computers could crack, and the fallout could be far worse than a Bitcoin hack.
Let’s break it down.
1️⃣ Financial Systems: A Global Crisis Waiting to Happen
Imagine if hackers could:
Drain bank accounts at will.
Manipulate stock markets.
Fake trillion-dollar transactions.
This isn’t just about stolen crypto—it’s about economic chaos. Banks, stock exchanges, and payment systems all depend on encryption. If quantum computers break it, we’re looking at a meltdown way bigger than Bitcoin’s $3 trillion market.
2️⃣ National Security & Internet Privacy: A Hacker’s Dream
Governments and militaries use encryption to:
Protect classified intelligence.
Secure communications between leaders.
Guard critical infrastructure (power grids, water supplies).
If quantum computers crack these codes, entire nations could be exposed to cyberwarfare. Your private data? At risk too—email, messaging, even your online banking could be decrypted years later.
3️⃣ Healthcare, Supply Chains & IoT: The Hidden Vulnerabilities
Medical records could be leaked, exposing sensitive health data.
Smart devices (like home security systems) could be hacked.
Supply chains might collapse if logistics networks are breached.
These systems weren’t built with quantum threats in mind—and upgrading them won’t be easy.
🔴 The Bigger Picture: A "Civilizational Upgrade"
Switching to quantum-resistant encryption is like rebuilding the internet’s foundation. It’s necessary, but messy. Some experts compare it to the Y2K bug—but way harder.
🔷 So, Is Bitcoin Safe?
Not entirely—about 25% of all Bitcoin could be stolen if quantum computers advance fast enough. But compared to the risks facing banks, governments, and hospitals? Bitcoin might be the least of our worries.
🔷 What’s Next?
Governments & companies are already working on fixes (like NIST’s post-quantum cryptography standards).
The transition will take years—and hackers might exploit weak spots along the way.
Staying informed is key. If you’re in tech, finance, or security, this affects you.
ℹ️ Want to Dive Deeper?
Deloitte’s take on quantum computing & Bitcoin
Forbes on quantum risks beyond crypto
🤷♂️ Bottom line?
Quantum computing is coming—and while Bitcoin has risks, the real danger lies in the systems we all depend on every day.
❔What do you think? Will we be ready in time? Let me know in the comments! 🚀
