BTCUSD BUY 105750On the 4-hour chart, BTCUSD is currently oscillating at a high level. Currently, we can pay attention to the support near 105750, which is a potential buying position for the bullish bat pattern. At the same time, this position is in the demand area.
BTCUSD.PM trade ideas

SYMMETRYHey traders, hope you’re crushing it this week! 🚀 Quick note on our BTC/USD 4-hour ABC setup: the symmetry I’m talking about is purely price-based—AB and BC move roughly the same number of ticks, not the same amount of time.
So when we say “symmetry,” we mean:
A→B drop: ~3,670 ticks
B→C rally: ~3,427 ticks
That close price match gives us confidence in our PCZ at 107,600–107,300 (78.6%–100% retrace of B→C).
⚔️ Trade Plan Recap
Entry: Long between 107,300–107,600
Stop: Below 107,000 (keeps risk tight)
Targets:
Zone 1: 61.8–78.6% of B→C → 110,657–111,569
Zone 2: 127.2–161.8% extension of A→B → 114,206–116,084
Remember: look for that bullish pin-bar or engulfing candle down in our PCZ before pulling the trigger, and bail if we lose 107,000. No time-based symmetry here—just clean price alignment. Trade with structure, not emotion, and keep an eye on any macro or on-chain news for extra context. ✌️

Market ViewWatch
Trade
Manage
Smile
Good morning, service to all of God creature take another level in life of purpose., we all got our role. Make the decision today.

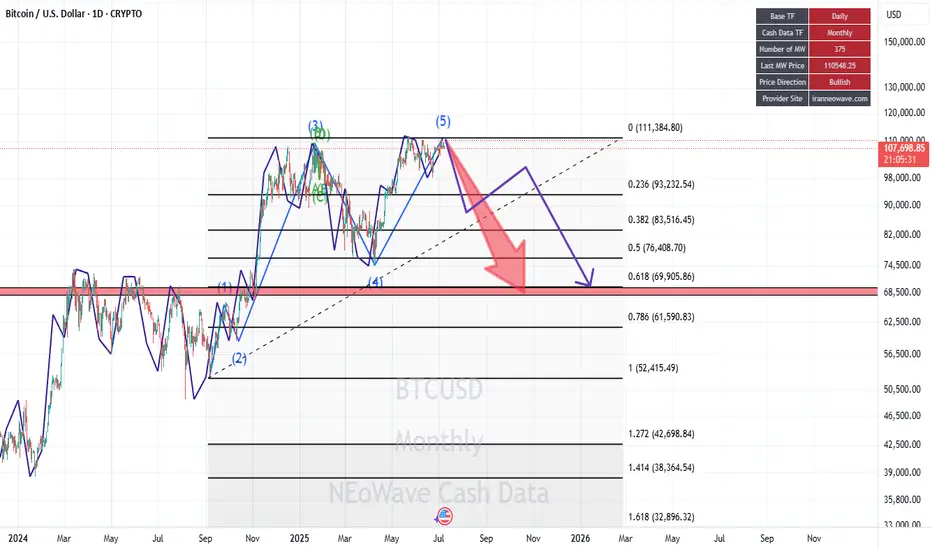
BTCUSDBased on NeoWave Analysis:
We should wait for the end of wave 5, getting ready for a Sell position.
BTC setup with a 3.9 risk-to-reward ratio.Is BTC beginning a bullish move toward 120K?
This setup offers a 3.9 R:R with an
Entry at 109,000
Stop loss at 106,355
Target 120,000
Not financial advice.

Bitcoin Daily, Mixed Situation · Bitcoin vs Altcoins · Not MixedI came with the intention of doing an update on the weekly timeframe, the chart doesn't look great.
Here we are looking at Bitcoin daily and once more the situation is mixed to say the least. It is hard to predict with exactitude with such a chart. In this case, we have to look for clues in other places. The altcoins.
But before we go there let's consider a few of the actualities that are present on the Bitcoin chart.
Bitcoin price action
Mixed or not mixed, the action continues to happen at resistance against all odds; this is bullish.
Bitcoin is trading safely above $106-$107,000 daily, and this is also bullish.
Bitcoin is trading above all moving averages we track and nothing is more bullish than that. MA200 sits around $96,000. EMA55 at $104,700 and EMA13 at $107,700.
Bitcoin will be bullish regardless as long as it trades above these levels and at a such strong price. So the mixed part is only psychological. It is mixed because people are afraid of a drop or want to see it drop. It is bullish based on the actual numbers and the chart.
The altcoins market vs Bitcoin
Some altcoins are breaking up today two to three digits green. Those good old reputable projects. This wouldn't be happening preceding a major bearish wave. Such strong action on the altcoins tends to precede a major bull market. Last week there were other pairs breaking really strong, the previous week another group, this week a new group and so on. Slowly but surely the low prices are disappearing but this isn't still a marketwide occurrence, we can see/say that the market is in no hurry.
Another relationship between Bitcoin and the altcoins relates to how many are behaving; when Bitcoin is about to crash, the altcoins tend to crash really strong and fast. The altcoins don't wait and just go down and continue diving deep if Bitcoin is about to produce a major crash. But this isn't the case, many altcoins are already at bottom prices but not based on a crash but a very slow and drawn out retrace. From these lows they are recovering strong.
When Bitcoin is bullish, sideways with a strong price within a bull market, the altcoins tend to grow. It is the same signal looked at from a different perspective. These altcoins are telling us that behind the scenes Bitcoin is bullish and we know Bitcoin is bullish because it is trading above $107,000. A bullish continuation is the next logical step.
Thank you for reading.
Boost if you agree.
Namaste.

$BTC (BITCOIN) 4HPrice previously rallied strongly from a Fair Value Gap (FVG) at the bottom of the chart, forming a bullish market structure.
After a bullish displacement, BTC consolidated in a tight range (reaccumulation) and swept internal liquidity before breaking down.
Now, price has returned to a critical discount zone around 107800–107600
First Target: 109,229 — internal range high.
Main Objective: 112,000 — resting external liquidity above a clean high.
As long as BTC holds above 107600, we remain bullish. The current area is perfect for accumulation before a potential expansion phase toward external liquidity.

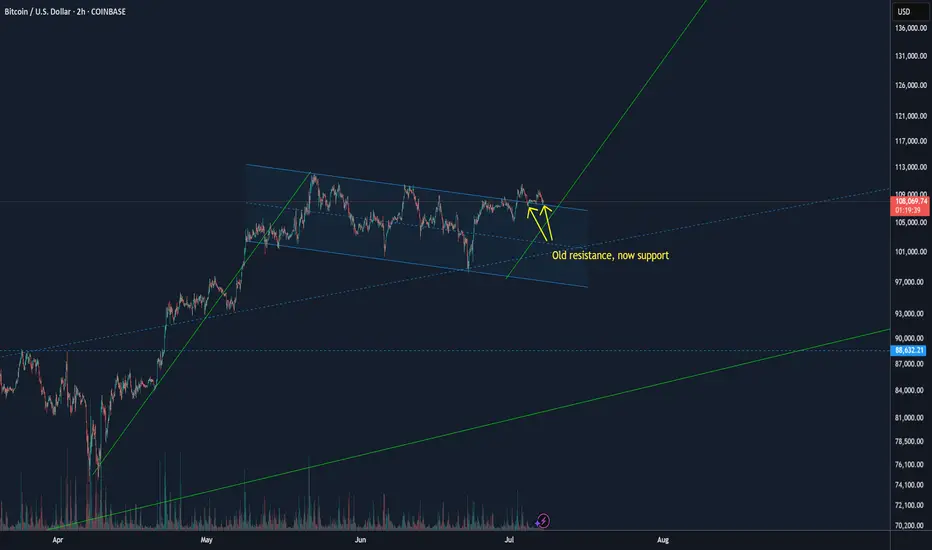
BTC moving higher, 140K not that crazyIf you're looking to short BTC around the 110K range thinking "oh yeah, this is the fourth or so time its been at 110, I'll make a quick buck".. don't. This is looking very different.
BTC has already broken out of its current resistance channel and its now acting as support. You can see its bounced off of support once and its hovering around there again.
All that BTC needs to do it do a small move up past its ATH and it's off to the races.
If the bull flag pattern holds true the move could go as high as $140k.
Bitcoin Elliot Wave CountBullish for the next 90 days
Blow off top thesis
Pump into rate cuts and Big Beautiful Bill.

Market ViewWatch
Trade
Manage
Smile
@Odesina Folorunsho Alabi
The scale of interpretation and trade execution is at each individual hands, we got to make the call either right or wrong, take charge.

BTC Storm of Consolidation, New Money, and Macro-PoliticsBitcoin at the Precipice: A Perfect Storm of Consolidation, New Money, and Macro-Political Tailwinds
In the intricate and often tempestuous world of digital assets, there are moments of frantic volatility and periods of eerie calm. Bitcoin, the undisputed king of cryptocurrencies, currently finds itself in one of these fascinating lulls—a state of high-altitude consolidation that is anything but sleepy. Trading just a whisper away from its all-time high, the asset is coiling like a spring, absorbing immense selling pressure from early adopters while simultaneously drawing in a new, powerful wave of buyers. This delicate equilibrium, however, is set against a backdrop of explosive potential catalysts. From tightening technical indicators screaming of an imminent breakout to the looming deadline of US tariffs, the vocal endorsement of tech titans, and the unprecedented entry of Bitcoin into the mainstream political arena, the stage is being meticulously set. The question on every analyst's and investor's mind is no longer if Bitcoin will make its next major move, but when, and just how monumental it will be. This is not just another market cycle; it is a convergence of forces that could propel Bitcoin toward price horizons that were once the domain of only the most fervent optimists.
The Anatomy of a Healthy Consolidation: Whales Recede as a New Foundation is Built
At first glance, a market that stalls just below its peak might seem like a sign of weakness, an indication that the bullish momentum has been exhausted. However, a deeper look into the current structure of the Bitcoin market reveals a picture of profound strength and maturity. This period of consolidation is characterized by a crucial and healthy rotation of ownership. The so-called "whales"—early investors and large-scale holders who have accumulated vast quantities of Bitcoin at much lower prices—are beginning to ease their holdings. This is not the panic-selling seen during bear market capitulations. Rather, it is a strategic and logical process of taking profits, de-risking portfolios, and realizing life-changing gains after a historic run.
Every Bitcoin sold by a whale must be bought by someone else, and the identity of these new buyers is what makes the current phase so compellingly bullish. The supply being released onto the market is not causing a price crash; instead, it is being steadily absorbed by a fresh cohort of participants. This new wave includes a diverse mix of players: retail investors who are gaining confidence as Bitcoin solidifies its mainstream status, smaller institutional players who are now more comfortable entering the market, and, most significantly, corporations that are beginning to view Bitcoin as a legitimate treasury reserve asset. This process is akin to the changing of the guard. The early pioneers are passing the baton to a new generation of holders who are establishing a new, higher cost basis. This dynamic is incredibly constructive for long-term price stability. It builds a robust and formidable wall of support at these elevated price levels, transforming what was once a speculative peak into a solid foundation for the next leg up.
Further evidence of this underlying strength can be seen in Bitcoin's recent weekly performance. The asset has managed to set another record high weekly close. In the world of technical analysis, a weekly close is considered far more significant than a brief, volatile intraday spike. An intraday high can be the result of a short-lived speculative frenzy or a liquidation cascade, but a high weekly close demonstrates sustained buying pressure and conviction over a longer duration. It signifies that, for seven straight days, buyers successfully defended higher price levels against sellers, ultimately winning the battle as the candle closed. This repeated ability to secure high weekly closes indicates that the market is systematically accepting and validating these new price territories, creating a psychological and technical launchpad for a future assault on all-time highs. Traders are now intensely focused on this dynamic, attempting to pinpoint the new, higher bottoms of this consolidation range, recognizing that these levels are likely to serve as the bedrock for the next major bull run.
The Technical Cauldron: Bollinger Bands Signal an Imminent and Violent Breakout
While the fundamental picture is one of healthy rotation, the technical charts are sending an even more urgent message: prepare for a massive move. Among the myriad of indicators used by traders, the Bollinger Bands are currently painting a particularly dramatic picture. Bollinger Bands consist of three lines plotted over a price chart. The middle band is a simple moving average, while the upper and lower bands are positioned at a set number of standard deviations away from the middle band. In essence, they are a direct measure of market volatility. When the market is volatile, the bands widen. When the market is calm and consolidating, the bands contract, or "squeeze."
Bitcoin is currently in the midst of one of the most significant Bollinger Band squeezes seen in recent history. The upper and lower bands have drawn incredibly close to one another, indicating that volatility has been wrung out of the market to an extreme degree. Historically, such periods of low volatility are the calm before the storm. A Bollinger Band squeeze is almost always resolved by a period of explosive, high volatility—a powerful breakout. The longer and tighter the squeeze, the more violent the subsequent price move tends to be. The indicator itself does not predict the direction of the breakout, but in the current context, the directional bias is overwhelmingly clear. With Bitcoin consolidating just shy of its all-time high after a powerful uptrend, and with the fundamental backdrop being so strong, the path of least resistance is overwhelmingly to the upside.
This technical setup creates a powerful psychological feedback loop. As more traders and algorithms spot the tightening bands, they begin to position themselves for the inevitable breakout. This builds a massive amount of potential energy within the market. When the price finally does break through the upper band, it can trigger a cascade of buy orders—from traders entering new long positions, to short-sellers being forced to buy back to cover their losing bets. This rush of buying pressure is what can turn a simple breakout into a parabolic, face-ripping rally.
The anticipation surrounding this move has led to some audacious price targets being discussed. Analysts are now contemplating the possibility of a "false move" to as high as $105,000. The term "false move" in this context is intriguing. It could imply a rapid, almost wick-like surge to that level, driven by extreme speculation and leverage, which might then be followed by a sharp correction to shake out the "paper hands" before a more sustainable climb resumes. Alternatively, it could simply be a way of expressing disbelief at the sheer velocity of the potential move. Whether the target is $105,000 or another figure, the underlying message from the charts is unambiguous: Bitcoin is on the verge of a big move, and the technicals strongly suggest it will be a powerful breakout to the upside, potentially ushering in a new phase of price discovery.
The Confluence of Catalysts: Tariffs, Politics, and The Musk Effect
A primed technical setup is potent on its own, but when combined with powerful external catalysts, it creates the recipe for a perfect storm. Bitcoin's next potential move is not just being driven by its internal market dynamics; it is being pulled forward by a confluence of macroeconomic and political forces that are aligning in its favor.
One of the most significant near-term catalysts is the looming US tariff deadline. Historically, periods of geopolitical tension and economic uncertainty have been incredibly bullish for Bitcoin. Tariffs, trade wars, and protectionist policies create instability in global markets and can erode the value and trust in fiat currencies. As nations engage in economic conflict, savvy investors and even central banks begin to look for non-sovereign, censorship-resistant stores of value to hedge their wealth. Bitcoin, with its decentralized nature and fixed supply, is the ultimate hedge against such fiat currency debasement and geopolitical turmoil. The impending tariff deadline is forcing a global conversation about the stability of the current financial system, and Bitcoin stands to be a primary beneficiary as capital seeks a safe haven from the storm.
Adding fuel to this fire is the upcoming "Crypto Week," a period of heightened focus on the industry through conferences, major announcements, and media coverage. These events act as a gravitational force, pulling the attention of the financial world toward the digital asset space. This concentrated attention almost always leads to increased trading volume and volatility. It creates a self-fulfilling prophecy where the expectation of big news and market moves encourages traders to participate, thereby creating the very volatility they anticipated.
Perhaps the most electrifying and unpredictable catalyst, however, is the re-emergence of Elon Musk's "love" for Bitcoin and the asset's dramatic entrance onto the main stage of American politics. Musk, with his colossal social media following, has a proven and unparalleled ability to influence market sentiment with a single post. His recent teasing of a "Pro-Bitcoin America Party" has sent shockwaves far beyond the crypto community. This move, whether serious or satirical, has injected Bitcoin directly into the heart of the US political discourse. It reframes Bitcoin not just as a financial asset, but as a political symbol—a representation of innovation, decentralization, and freedom from government control.
This has been met with a reaction from other major political figures, including Donald Trump, creating a fascinating push-and-pull. The fact that leading presidential candidates and political influencers are now debating Bitcoin's merits and role in the nation's future is a monumental step in its journey toward mainstream legitimacy. It forces the public and policymakers to take it seriously. This political theater creates an environment where assets perceived as being aligned with pro-growth, pro-innovation, and pro-freedom ideologies can thrive. The emergence of a "BTC Bull Token" or similar concepts tied to this political momentum underscores the new reality: Bitcoin is no longer just a tech story; it is a powerful political and cultural movement, and this new dimension is likely to attract a wave of capital from those who align with its burgeoning ideology.
The Institutional Stamp of Approval: A Corporate Treasury Revolution
While retail excitement and political drama provide the fuel, the institutional adoption of Bitcoin provides the solid, unshakeable foundation for its long-term trajectory. The most powerful recent example of this trend is the announcement from Genius Group, a publicly traded education technology company, that it is increasing its Bitcoin treasury target to a staggering 10,000 BTC. This is not a speculative trade; it is a profound strategic shift in corporate treasury management.
This decision signifies that corporate boards and CFOs are beginning to understand and act upon Bitcoin's value proposition as a superior treasury reserve asset. In an era of persistent inflation and low-to-negative real yields on traditional assets like government bonds, holding large amounts of cash on a balance sheet is a guaranteed way to lose purchasing power. By allocating a portion of its treasury to Bitcoin, Genius Group is taking a proactive step to protect its shareholders' value from the ravages of monetary debasement. It is a declaration of confidence in Bitcoin's long-term potential as a reliable store of value.
The importance of such a move cannot be overstated. It provides a powerful stamp of approval and a case study for thousands of other corporations around the world. When one publicly traded company makes such a bold move and outlines its rationale, it normalizes the strategy. Other CFOs, who may have been hesitant, now have a blueprint to follow and a precedent to point to when presenting the idea to their own boards. This has the potential to unlock a veritable floodgate of corporate capital. Even a small, single-digit percentage allocation from the treasuries of the S&P 500 companies would represent hundreds of billions of dollars of new, sustained buying pressure for Bitcoin. The move by Genius Group is not an isolated event; it is the leading edge of a seismic shift in how the corporate world perceives and utilizes money.
Conclusion: The Dawn of a New Epoch
Bitcoin stands at a historic inflection point. The current period of quiet consolidation is deceptive; beneath the surface, a powerful confluence of forces is converging to launch the asset into its next major chapter. The market's internal structure has never been healthier, with the holdings of early whales being patiently absorbed by a new and committed class of buyers, building a formidable price floor far above previous highs. The technical charts are screaming of an imminent and powerful breakout, with the tightening Bollinger Bands signaling a massive release of energy that heavily favors the upside.
Layered on top of this potent technical and structural setup is a perfect storm of external catalysts. The specter of global economic instability driven by tariffs, the focused attention of a "Crypto Week," the unparalleled influence of figures like Elon Musk, and the shocking but legitimizing entry of Bitcoin into the partisan political arena are all acting as powerful tailwinds. This is all underpinned by the quiet but revolutionary trend of institutional and corporate adoption, which promises to bring waves of new capital into the asset for years to come.
The consolidation will soon end. The question is not about direction, but about magnitude. The forces at play are no longer just about market cycles; they are about a fundamental repricing of a global, non-sovereign asset in a world grappling with economic and political uncertainty. The stage is set for a breakout that could not only shatter previous all-time highs but could also permanently elevate Bitcoin's status, solidifying its role as a cornerstone of the 21st-century financial and political landscape.
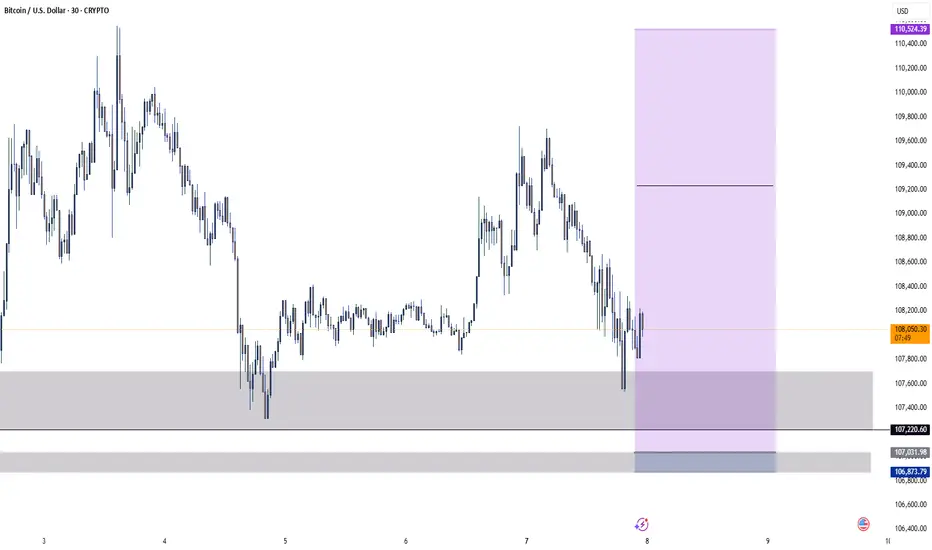
BTCUSD M30 Bearish Outlook #BTCUSD M30 Outlook 🕒
BTCUSD looking bearish below 108,490 zone.
🎯 Target: 107,470
Bias: Lower highs & weakness on M30.

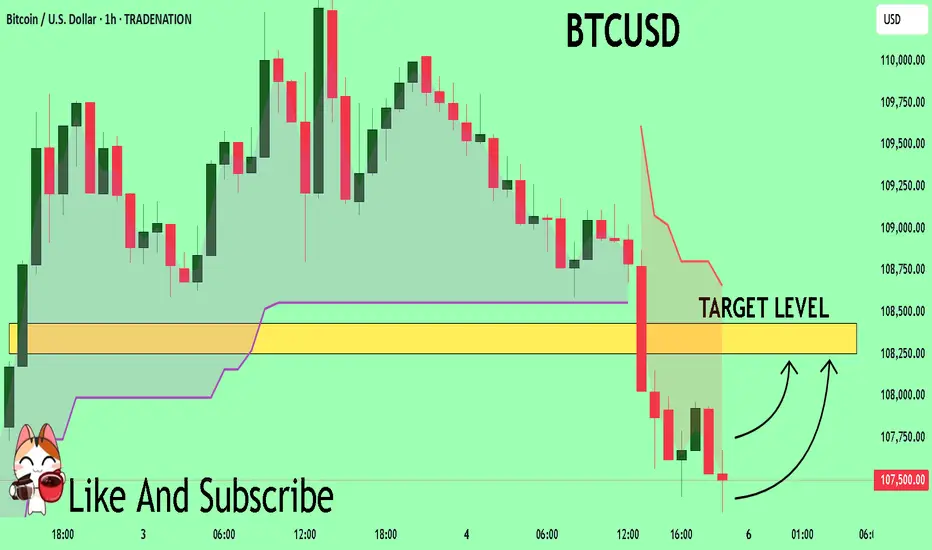
BTCUSD What Next? BUY!
My dear subscribers,
My technical analysis for BTCUSD is below:
The price is coiling around a solid key level - 10750
Bias - Bullish
Technical Indicators: Pivot Points Low anticipates a potential price reversal.
Super trend shows a clear buy, giving a perfect indicators' convergence.
Goal - 10825
About Used Indicators:
By the very nature of the supertrend indicator, it offers firm support and resistance levels for traders to enter and exit trades. Additionally, it also provides signals for setting stop losses
Disclosure: I am part of Trade Nation's Influencer program and receive a monthly fee for using their TradingView charts in my analysis.
———————————
WISH YOU ALL LUCK
BTC — Weekend Pump Fades.. All Eyes on the Gartley Reversal ZoneBitcoin has been consolidating in a tight range between $110K and $105K over the past two weeks. This weekend’s attempted breakout stalled out quickly! BTC was rejected at the Point of Control (POC) of the previous range and came close to the 0.786 retracement of the recent drop.
🧠 Reminder: Weekend pumps are notorious for being unreliable, especially without strong volume.
Now, the charts point toward something much more structured — a potential Gartley harmonic pattern forming, with multiple levels of confluence suggesting the next key decision zone is just around the corner.
🧩 Gartley Completion Zone: $106,290–$106,400
This price zone is loaded with confluence:
✅ 0.786 Fib retracement of the XA leg sits at $106,290
✅ 1.0 trend-based Fib extension of the BC leg is at $106,370
✅ Anchored VWAP from all-time high aligns precisely at $106,370
✅ VAL (Value Area Low) sits at the same level
✅ Imbalance (Fair Value Gap) from earlier price inefficiency lies in this exact region
All of this stacks up into a high-probability reaction zone.
🎓 Educational Insight: How to Trade a Gartley Harmonic
The Gartley pattern is one of the most powerful harmonic setups — a structured form of retracement and extension that captures exhaustion before reversals. Here's how it works:
🔹 XA: Impulse leg
🔹 AB: Retracement of 61.8% of XA
🔹 BC: Retraces 38.2%–88.6% of AB
🔹 CD: Extends to 78.6% retracement of XA and aligns with a 1.0–1.272 Fib extension of BC
🟢 Point D is the entry zone — your reversal opportunity.
📉 Stop-loss sits just below invalidation (Point X).
💰 Targets usually lie at 0.382 and 0.618 of the CD leg.
🔎 Why It Works: It traps late traders and captures price exhaustion at natural Fibonacci ratios. Combined with other tools — like VWAP, liquidity zones, and order flow — it becomes a high-conviction strategy. These patterns are most effective on higher timeframes like 4H or daily.
_________________________________
💬 If you found this helpful, drop a like and comment!
Want breakdowns of other charts? Leave your requests below.

BITCOIN Short-term Target = $117kBitcoin (BTCUSD) is coming off a 4H Golden Cross, attempting to hold the 4H MA50 (blue trend-line) as its short-term Support. The early hours of the E.U. session today show that this might be a difficult task, however comparison with May's Bullish Leg, gives positive signs.
Almost the entire month of May sequence has been an uptrend, which looks very similar to today's. Almost identical rises from their bottoms (+13.60% against +12.60%) until the first top, with similar 4H RSI fractals also, we can expect the current uptrend to make a second top soon near the 1.5 Fibonacci extension at $117000.
Are you expecting such an outcome in the coming days? Feel free to let us know in the comments section below!
-------------------------------------------------------------------------------
** Please LIKE 👍, FOLLOW ✅, SHARE 🙌 and COMMENT ✍ if you enjoy this idea! Also share your ideas and charts in the comments section below! This is best way to keep it relevant, support us, keep the content here free and allow the idea to reach as many people as possible. **
-------------------------------------------------------------------------------
💸💸💸💸💸💸
👇 👇 👇 👇 👇 👇

Bull Flag TargetBased on the flag pole height BTC has a current target of 137. This is be so much fun!

Btcusd techinical analysis.Btcusd techinical analysis next move posibale at h1 time frame.not finchinal advice.

7.7 Analysis of the latest BTC trend and operation layout📊 Cautious wait-and-see strategy (Recommendation index ⭐️⭐️⭐️⭐️⭐️)
📰 News information:
1. Digital Market Asset Transparency Act
2. Anti-CBDC Regulation Act
3. US Stablecoin Innovation Act
📈 Technical Analysis:
At present, the price of BTC is around 109,000, and the overall narrow fluctuation pattern continues. The market as a whole lacks clear direction. However, it is worth noting that the trading volume has dropped to 30.1 billion US dollars, which has further shrunk compared with the previous day, reflecting a decline in market participation.
In my opinion, the driving factors of the market include the following:
1. The continued activity of ancient whales has attracted attention
2. The technical side shows that the momentum is weakening
3. Market sentiment has turned neutral
4. ETF fund inflows remain strong
5. The "Crypto Week" policy catalyst is coming
Currently, BTC continues to consolidate within the upward trend line, but the momentum indicator shows fatigue, the 4H Bollinger Bands shrink, and the price is running near the middle track of 108,400. Enter the market cautiously during the day and pay attention to the support of 107,000
🎯 Trading Points:
SELL 109,000-110,000
TP 107,500-107,000
In addition to investment, life also includes poetry, distant places, and Allen. Facing the market is actually facing yourself, correcting your shortcomings, facing your mistakes, and being strict with yourself. I share free trading strategies and analysis ideas every day for reference by bros. I hope my analysis can help you.
BITSTAMP:BTCUSD

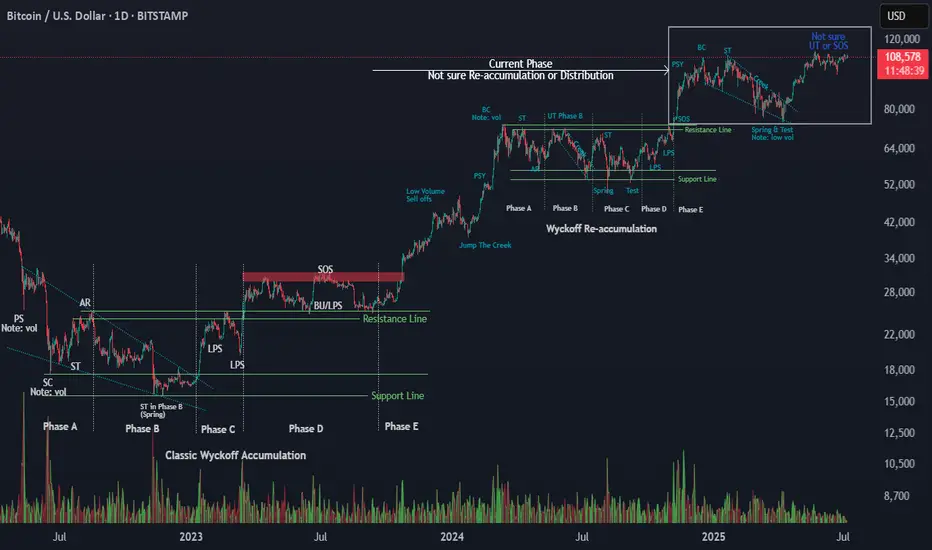
Wyckoff Logic – Test PhaseI won’t say much — the chart speaks for itself.
Based on my ongoing study of Wyckoff methodology, it appears that Bitcoin is currently in the Test phase within a re-accumulation structure. This suggests the Mark-Up phase is not yet complete, and we may still have room for price expansion before the next major distribution.
This is not a prediction, but a reference for structural context using classical Wyckoff logic.
As always, price confirmation and volume behavior will be the key to validate the next move.
Observations:
Strong support zone holding after Spring/Test
Price respecting higher lows
Volume profile supports continuation
Feel free to share your perspective below 👇
#Wyckoff #Bitcoin #BTC #Reaccumulation #MarketStructure #PriceAction #TradingView #CryptoTA
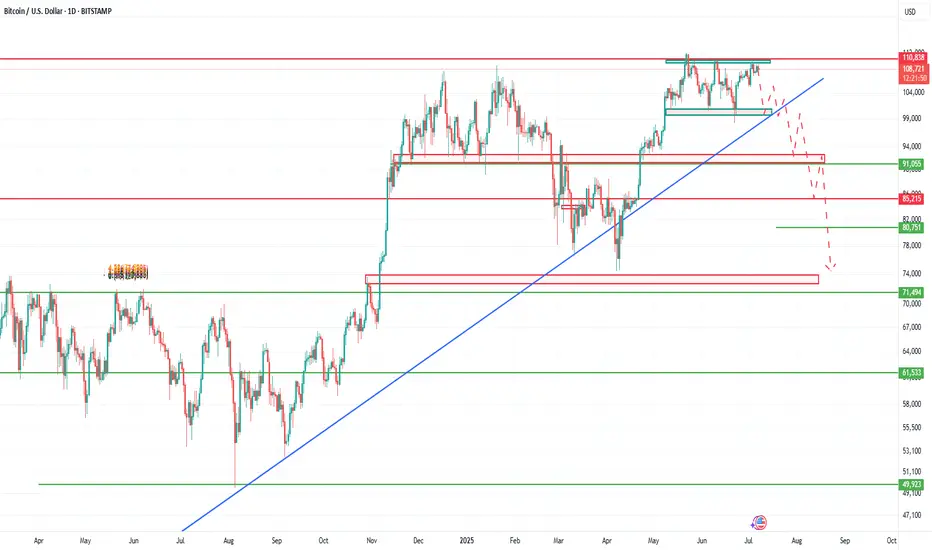
BTC is ready to plungebtc has form a compression and its ready for the major correction.
becareful in trading btc.
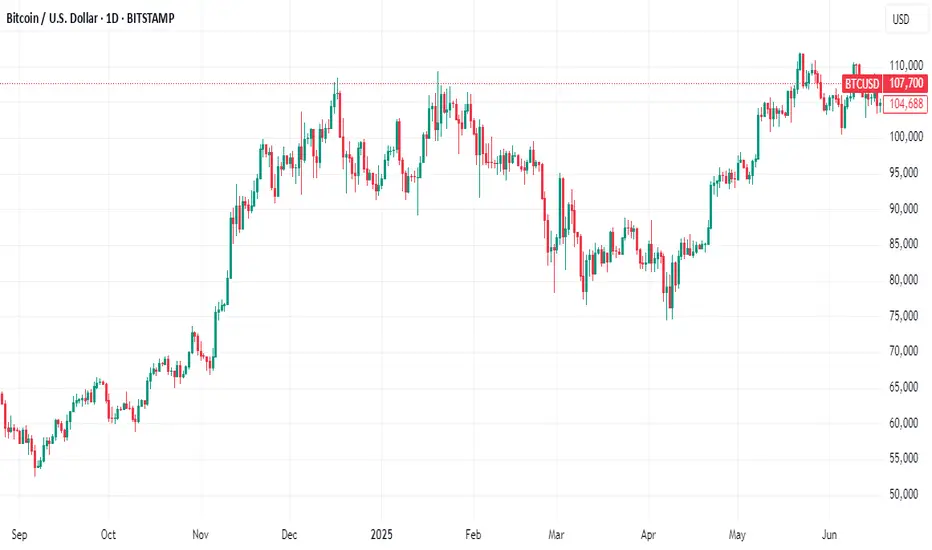
Is Bitcoin Working Out a New Leg Up? Onchain Data Says It May BeDiamond hands are waving goodbye and institutions are loading up — it’s why Bitcoin may be struggling to break out of its current consolidation range. How long can this accumulation phase continue?
And yes — we look at the trades of the decade — two transactions where each one moved a cool billie from a $7.8K investment in 2011.
Some people cling to their Bitcoin BITSTAMP:BTCUSD stash like it’s their last protein bar before a marathon. Others, apparently, wake up one day and decide to dump their coins and browse the market for islands.
Welcome to the silent shift that’s redefining the big players in the Bitcoin market, worth about $2.2 trillion as per data from our Crypto Coins Heatmap .
Old-school whales — the very early adopters and miners holding the OG wallets — are quietly selling, while institutional heavyweights sweep in to buy every dip (part of the reason why lately every breakout never breaks out).
Over the past year, these OG whales have shed about half a million Bitcoin — worth north of $50 billion — according to data from 10x Research. And guess who’s gobbling it all up? ETFs, corporate treasuries, and family offices that didn’t want anything to do with crypto five years ago.
Is it bullish? Is it bearish? Is it just Bitcoin being Bitcoin? Let’s pull up the charts, squint at the data, and see what the world’s most famous digital coin might be plotting next.
📈 A Record High — And Now What?
So here’s the setup. Bitcoin has been strutting under its record high of $111,000 for months now. You’d think the hype machine — from Trump’s pro-crypto administration, to corporate balance sheets going full Michael Saylor (looking at you, GameStop NYSE:GME ) — would send BTC blasting past the Moon and landing on Mars.
Instead? It’s just... chilling. Volatility’s drying up like the last drop of liquidity in a summer Friday session. And the reason is surprisingly simple: the massive handover happening between big, anonymous early adopters and the suit-and-tie institutional crowd.
😌 From Wild Ride to Easy Cruising?
You could argue this is exactly what Bitcoin needs: maturity, respectability, less drama. But don’t tell that to the day traders who want 20% swings before breakfast. As these whales get out and institutions get in, analysts say the upside could be capped at a chill 10% to 20% a year.
Good news for your retirement portfolio, maybe not so great for that “Lambo by Labor Day” dream.
Institutions now hold about 25% of all Bitcoin in circulation — and once these get in, they tend to sit tight for years.
🚀 The $1.1 Billion Time Capsule
Speaking of whales: ever wonder what happens when a Bitcoin wallet goes dark for 14 years? It pops back online to make your mind melt.
On April 3, 2011, a wallet labeled “1HqXB...gDwcK” moved 23,377 BTC to three addresses. At the time, Bitcoin was worth a mere 78 cents. Fast forward: two of those receiving wallets, each with 10,000 BTC, sat dormant for over a decade.
This month, both wallets moved their treasure troves — worth over $1.1 billion each — within 30 minutes of each other. Talk about a coordinated exit. What’s behind the move? Tax planning? A lost key finally found?
A savvy crypto thief who figured how to crack the earliest key generation method? We may never know. Also, OG guy, if you’re reading this — props for the all-at-once move without even a test transaction.
⛓️ What Onchain Data Says
Onchain data is like reading tea leaves for nerds with Bloomberg terminals. It says the supply is tightening — not because there’s less Bitcoin, but because fewer coins are actually available to trade.
When long-term holders move coins, that typically signals big-picture changes. Here’s the twist: the net effect has been… stability. Institutional demand, like Bitcoin exchange-traded funds , soaks up supply just as fast as whales drip it back in.
That’s why Bitcoin’s been stuck in this $100K–$110K limbo, ping-ponging while the accumulation phase is still going strong.
👀 So, Is a New Leg Up Coming?
This is where the optimists and realists start to bicker over the charts. On the one hand, the structural handover to institutions makes Bitcoin more credible, more regulated, and more boring.
But less volatility can mean steadier gains — especially if you believe that the world will always want an inflation hedge that no central bank can print into oblivion.
On the other hand, a sideways market can test your patience more than a typical drawdown. Some of the whales are gone, the suits have arrived, and the easy moonshots might not be so easy anymore.
🌱 The Trade-Offs of Growing Up
Bitcoin was born in the wild west of finance — an anonymous, volatile, meme-fueled phenomenon. Now, it’s drifting deep into the mainstream. That might limit the fireworks, but it also locks in its place as an asset class that’s not going away.
🌊 Closing Thoughts: The Next Billion-Dollar Move
Will we see another $7,800 investment turn into a cool $1 billion? Maybe not exactly like that. But the game isn’t over — it’s just evolving.
Keep your eyes on the whales, the ETFs, the Fed’s next move , and those onchain breadcrumbs.
Over to you , chart-watchers: does this calm consolidation make you bullish, bearish, or just plain bored? Share your thoughts in the comments!

BRIEFING Week #27-28 : Distancing from US MarketsHere's your weekly update ! Brought to you each weekend with years of track-record history..
Don't forget to hit the like/follow button if you feel like this post deserves it ;)
That's the best way to support me and help pushing this content to other users.
Kindly,
Phil
