Bitcoin Skyrockets as Everyone Now Wants a Piece. What Happened?If you took a few days off last week and went to get coffee this morning, you likely missed Bitcoin torching its all-time high and soaring into the uncharted.
The world’s most popular digital asset took off in an unstoppable rocket ride, smashing records so fast that even the always-wired-in day traders couldn’t keep up.
Bitcoin BITSTAMP:BTCUSD blasted through $122,000 Monday morning after gobbling up sell walls at $120,000 and $121,000 in less than one hour. That’s not a typo.
That’s an actual snapshot of what happens when you mix onchain whale movements, fresh institutional FOMO, and traders rediscovering their appetite for risk. Billions upon billions swirled up and Bitcoin passed $2.3 trillion in market cap (ref: our Crypto Heatmap ).
🙌 Bow Down Before the King
Bitcoin has officially reminded every altcoin who wears the crown when markets go haywire. While some tiny tokens get to pump 100% on hype alone, Bitcoin does it with the weight of its market cap behind it — which now surpasses the GDP of entire countries.
Its dominance share has climbed back above 64%, a level we haven’t seen since the last time crypto Twitter argued whether “flippening” would happen by next Thursday (spoiler: it didn’t, and we mean 2021). And right now, all eyes are pinned on that round, meme-ready milestone: $125,000 or even $150,000.
Why these levels? Because traders love round numbers. They’re clean, symbolic, and if that next ceiling shatters, the chain reaction of liquidated shorts and new leveraged longs can turn an orderly bull run into pure market mayhem.
📈 Institutional Hoarding: The Secret Fuel
If you think this is just retail traders YOLO’ing in from their parents’ basement, think again. Onchain data showed earlier this month that this moon mission was being quietly underwritten by the big boys — institutional funds, overflowing Bitcoin ETFs , and corporate treasuries that once scoffed at Bitcoin as “magic internet money.”
Does this mean Bitcoin is becoming boring? Not quite. It means the foundation for this rally is sturdier than the TikTok-fueled moonshots of yesteryear. Think steady inflows, regulated vehicles, and balance sheets that no longer flinch when they see “digital assets” on a line item.
👀 So, Why Now?
Bitcoin doesn’t need much of a reason to get volatile — you know that. But a few more stars than usual aligned to give this surge its lift-off moment.
First, the macro backdrop: US inflation is at 2.4% (next ECONOMICS:USCPI report coming Wednesday, pay attention to the Economic Calendar ), which makes a Fed rate cut more likely later this year.
Lower rates mean cheaper dollars, weaker bond yields, and renewed appetite for risk assets. Oh, and don’t forget about gold OANDA:XAUUSD — the OG “no yield, no problem” hedge.
Second, corporate treasuries are all-in on Bitcoin again. If Michael Saylor’s Strategy NASDAQ:MSTR (formerly MicroStrategy — we all know what business they’re really in) keeps adding coins and onboarding new public companies like GameStop NYSE:GME , you know the institutions smell long-term value. Add Trump’s full-throated crypto endorsement and you’ve got a narrative tailwind no trader wants to miss.
🥂 Record Highs Everywhere — COINcidence?
Now let’s go back to those aligning stars. Bitcoin’s fresh all-time high didn’t happen in a vacuum. The S&P 500 SP:SPX , the Nasdaq Composite NASDAQ:IXIC , and Nvidia NASDAQ:NVDA — the world’s most expensive company — all clocked record closing highs last week.
So, is this a “rising tide lifts all boats” moment? Or are we partying on borrowed time? Equities are riding a wave of hope that the Fed will start easing soon, and any whiff of a rate cut is pure oxygen for risk assets.
But seasoned traders know that record highs can sometimes be the most dangerous places to FOMO in. Ask anyone who went all-in on dot-com stocks in 1999.
🏹 Eyes on the Big 120K — Will It Hold the Line?
Short-term, the $120,000 milestone is the line in the sand everyone’s watching. Break it decisively, see if it holds above it for a week or so, and the floodgates of speculative capital might open for another leg higher. Stall out below it? You could see a healthy round of profit-taking and some bruised egos during quiet dinners.
Macro factors will loom large: the Fed’s policy meeting, surprise tariff talks from the White House, or an unexpected bout of inflation could swing sentiment overnight. But for now, the mood is simple: bullish, frothy, and more than a little bit greedy.
💭 Final Take: From Moonshots to Maturity?
The shift from whales to suits means fewer wild swings but steadier institutional demand. The days of “Lambo tomorrow” might be giving way to “slow grind higher for the next 5 years.” For the retirement portfolio, that’s not the worst outcome.
For the traders who crave the adrenaline, there’s still plenty of room to catch the waves — just don’t expect them to come as easily or as frequently as they did in the wild west days.
📢 Your Turn: Moon or Swoon?
Over to you: is Bitcoin ready to break out above $125,000 and send shorts scrambling for cover? Or is this just another overbought stall before a healthy pullback?
Either way, grab your popcorn — and your stop-loss — because if there’s one thing crypto never does, it’s sit still for long. Drop your hot take below — and may your diamond hands be stronger than your coffee.
BTCUSD.PM trade ideas

BITCOIN Wait For Breakout!
HI,Traders !
#BITCOIN has formed a Bullish Wedge pattern
While trading in an uptrend As
we mentioned in a previous analysis
So we are bullish biased and
IF we see a bullish breakout
We will be expecting a
Further bullish move up !
Comment and subscribe to help us grow !

BTC SHORTAs expected the high was taken out.
I just took a low-probability sell on $BTC.
Join me if you can
➡️stop loss- 121,111.81
➡️enter now.
➡️manage your risk.

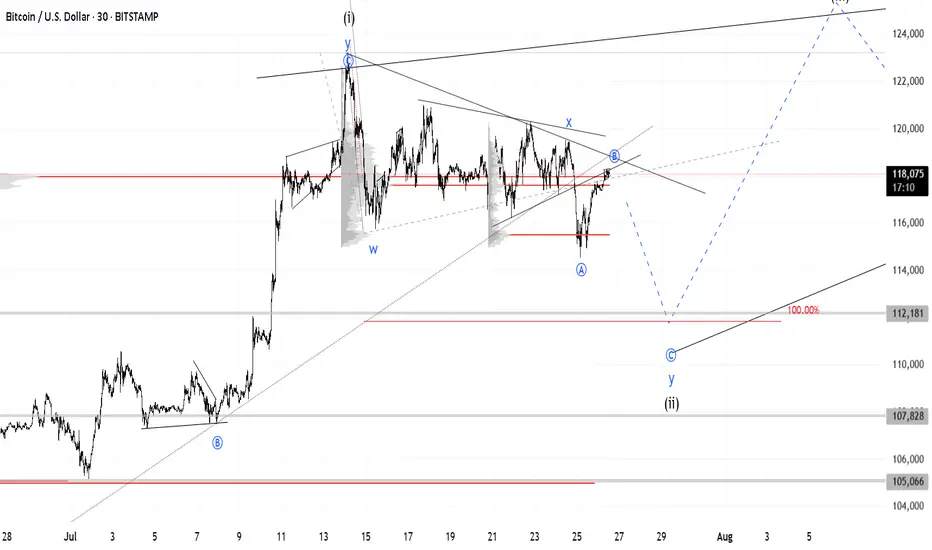
BTC Ready for the new impulse ? Elliott wave analysis 20/7/2025In my view, Bitcoin (BTC) has completed its micro correction and is now poised to move toward the $135,000–$139,000 target zone. This expectation is supported by the following factors:
1. Completion of the Sub-Waves in Wave (4)
My analysis of wave (4) indicates that it consists of an ABC correction, where wave B formed a WXYXZ pattern.
Additionally, I have counted the sub-waves within wave C of wave (4) and observed a complete 5-wave structure, suggesting that the fifth wave of wave C has ended, confirming the completion of wave (4).
2. Cypher Harmonic Pattern Pivot Point
I have identified a Cypher harmonic pattern with a pivot point around $116,600.
The termination of wave (4) occurred close to this pivot level, followed by a new impulsive move that made a higher high and formed a clear 5-wave structure—further confirming that wave (4) has likely ended.
3. Hidden Bullish Divergence on the 4-Hour Timeframe
A hidden bullish divergence can be observed on the 4-hour chart, particularly at the end of wave (a) and wave (c).
Historically, 4-hour hidden bullish divergences have often preceded strong bullish impulses. For instance, a similar setup occurred during the bullish rally from April 9, 2025, to May 22, 2025.
4. Failure to Make a New Low After Resistance Retest
The new impulse wave that emerged after the end of wave (4) has met resistance but failed to make a new low, suggesting that a fresh upward impulse is underway.
How Far Could Wave (5) Extend?
It is important to note that the wave (5) (blue) impulse is a sub-wave of wave (5) (purple).
The lengths of wave (3) (purple) and wave (5) (purple) are currently similar, which is unlikely because both are part of the major wave V (green), where typically only one wave should extend.
Since wave (3) has already completed, wave (5) is likely to be the extended wave, with a target length between 1.272 and 1.618 times the length of wave (3).
Interestingly, two Gann fan projections point to resistance levels in the $135,000–$139,000 range, which perfectly aligns with this 1.272–1.618 extension zone.
Invalidation Point
The invalidation level is around $117,000, as the micro correction within the new impulse should not drop this low.
If BTC falls below $117,000, it could imply that wave (4) has not yet completed and may be taking another corrective form.
For example, the wave (c) we currently see might only be wave 1 of a larger wave (c), or the correction in wave (b) may still be ongoing.
However, this scenario seems unlikely given the weight of evidence suggesting that wave (4) has already ended.

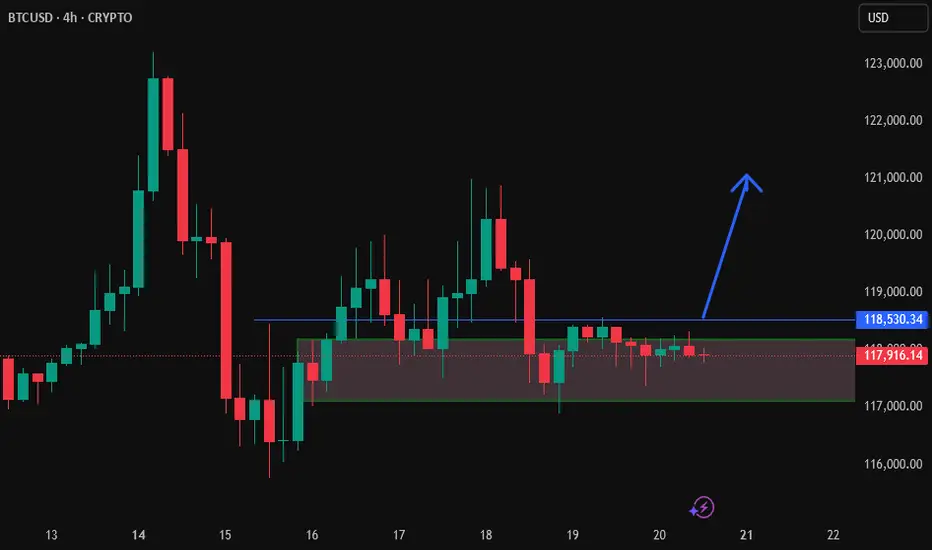
BTC/USD – 1H Smart Money Outlook | Sunday Preparation🔹 Current Price: $118,311
🔹 Day Range: High – $118,311 | Low – $117,137
🔹 Bias: Bullish unless daily low breaks
🔎 Smart Money Framework:
✅ Market Structure Shift (MSS) and Break of Structure (BOS) confirmed
✅ Price holding above Equal Lows (EQL) and retesting BOS zone
📍 OB (Order Block) above acting as major liquidity target
🔽 Multiple bullish mitigation zones:
🔹 Bullish Bias Zone
🔹 RBS (Resistance Become Support)
🔹 Bull Golden Zone
🔹 POI near SSL (Sell Side Liquidity) – ideal for deep discount buys
🧠 Scenario Mapping:
🔺 Direct Rally from current BOS retest → OB sweep
🔽 Pullback to RBS / Bullish Bias → then continuation to OB
🔻 Deeper pullback into Golden Zone / POI for premium entry
❌ Break below SSL invalidates bullish setup
🔧 Indicators:
RSI: Hovering around 65 – showing strength
MACD: Bullish momentum building gradually
EMAs: Price staying above short-term MA – trend supportive
📌 Summary:
BTC structure favors upside with multiple strong bullish setups forming. Only a clean break of daily low and POI invalidates the long bias. Smart money likely to hunt liquidity above OB. Ideal for scalpers and intraday positional setups.

BTCUSD MIGHT DROP!The price currently trade at 117,399 recently price broke through the local support level of 116155.00 I anticipate price to make some sell corrections . I’m selling from the current market price. Take advantage of the opportunity.

Ethereum is Trending HigherSince April trough, Ethereum has risen by 179%, delivering a higher rate of return than Bitcoin at 66%. But most of our attention is on Bitcoin, breaking above the 120,000 level.
Why is Ethereum quietly gaining ground —and what does the future hold for Ethereum?
Mirco Bitcoin Futures and Options
Ticker: MET
Minimum fluctuation:
$0.50 per ether = $0.05 per contract
Disclaimer:
• What presented here is not a recommendation, please consult your licensed broker.
• Our mission is to create lateral thinking skills for every investor and trader, knowing when to take a calculated risk with market uncertainty and a bolder risk when opportunity arises.
CME Real-time Market Data help identify trading set-ups in real-time and express my market views. If you have futures in your trading portfolio, you can check out on CME Group data plans available that suit your trading needs www.tradingview.com

BTCUSD Breakdown Below 116,500 – Watching 61.8% Fib Retracement BTCUSD has broken down below the 116,500 level on the 4-hour timeframe. It’s best to wait for a potential sell entry near the 61.8% Fibonacci retracement of the last bullish wave. Stop-loss and take-profit levels are shown on the chart

A good time to reentry Short BTCAlways i nice to reentry in profits
entry level 119.000
targets 116.600 / 115.600
SL 119.600
BITCOIN strong down trend selling strong from resistance 119,700📊BTCUSD Bitcoin Analysis – 1H Timeframe
Bitcoin is respecting the short-term downtrend, continuing to print lower highs and lower lows
📌Sell Setup Active:
✅Entry from the supply zone around 119,700 — price reacted perfectly with downside momentum
🎯Next Support Levels to Watch:
🔹 117,200
🔹115,900
These areas may act as short-term bounce zones or continuation areas — staying alert for reaction
🧠Risk management is key – no setup is ever 100% guaranteed! Stick to your plan
What’s your outlook on BTC in this range? Let’s discuss!
Stay sharp & informed — follow for more clean TA setups
#bitcoin #btcusd
👋Regards from expert Team

SellRejection Level
Daily Volume
Market Structure Shift
London Session
Trend Line Break
Untapped Order Point

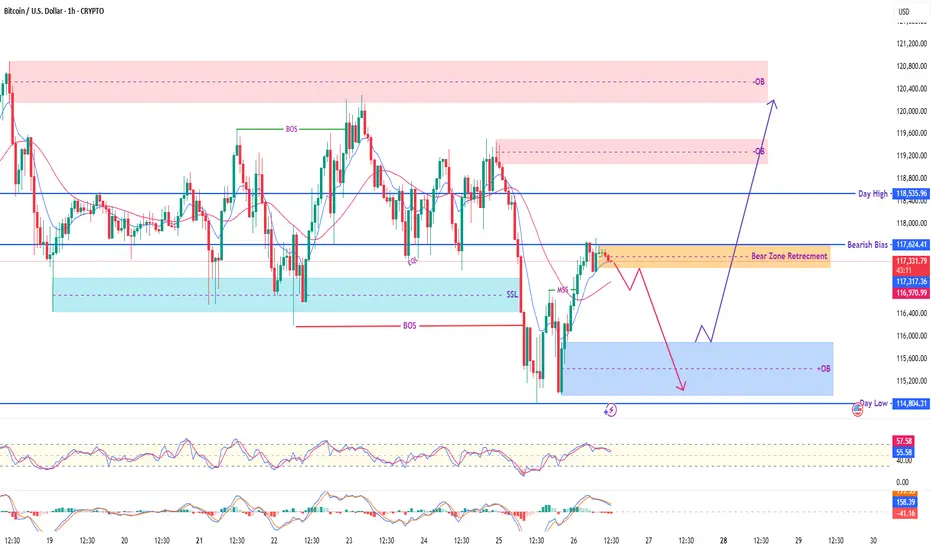
BTC/USD - Bitcoin's Crucial Levels & Potential Reversal Zones! What's up, TradingView fam! 👋 Here's a fresh 1-hour chart analysis for Bitcoin (BTC/USD), highlighting key price action and potential scenarios as the market navigates a critical zone.
Current Market Snapshot:
Price Retracement: BTC is currently in a 'Bear Zone Retracement' phase, hovering around $117,300 - $117,400. This suggests a pullback within a broader bearish move.
Bearish Bias 🐻: Our analysis indicates a prevailing 'Bearish Bias' in the short-term, meaning we're looking for potential selling opportunities or further downside.
Day High & Day Low: Key reference points are the 'Day High' at $118,505 and the 'Day Low' at $114,804.
Key Zones & Liquidity Pools:
Upper Order Block (Red OB) 🔴: A significant supply zone overhead, from $119,000 to $120,500. This area could offer strong resistance if price attempts to move higher.
Current Retracement Zone (Yellow Highlight) 📉: This is our 'Bear Zone Retracement' area around $117,200 - $117,500. This zone previously acted as support and could now flip to resistance, signaling a continuation of the bearish trend.
Lower Order Block (Blue OB) 🔵: A potential demand zone below, roughly $115,000 - $115,700. If price pushes lower, this could be an area for a bounce or temporary support.
SSL (Sell Side Liquidity) 🎯: Notice the sweep of 'Sell Side Liquidity' (SSL) around $116,500 recently. This liquidity grab often precedes a move in the opposite direction or a deeper pullback before continuation.
Potential Scenarios (Follow the Purple Arrows! 🔮):
Bearish Continuation (Most Likely Scenario) ⬇️: Given the 'Bearish Bias' and the current retracement into the 'Bear Zone', we could see rejection from current levels or a slight push higher to retest the upper part of this zone. From there, price might head down towards the Lower Order Block ($115,000 - $115,700), potentially retesting the 'Day Low' at $114,804.
Bullish Reversal (Less Likely, but Possible) ⬆️: A less probable but possible scenario involves price breaking above the current 'Bear Zone Retracement' and pushing higher. If it can clear the 'Day High' at $118,505, it might target the Upper Order Block ($119,000 - $120,500). This would invalidate the short-term bearish bias.
Indicators Check:
RSI: Currently around 57, showing a slight recovery but still with room to move.
Stochastic: Trending downwards, supporting the bearish momentum.
Always remember to trade smart, manage your risk, and wait for confirmation. This is not financial advice. Do your own research! 🛡️📊
Don't forget to Like 👍, Comment 💬, and Follow for more detailed analyses!
#BTC #Bitcoin #Crypto #Trading #TechnicalAnalysis #SmartMoneyConcepts #PriceAction #BTCUSD #MarketAnalysis"
Risk 116. Target 123-125KMorning folks,
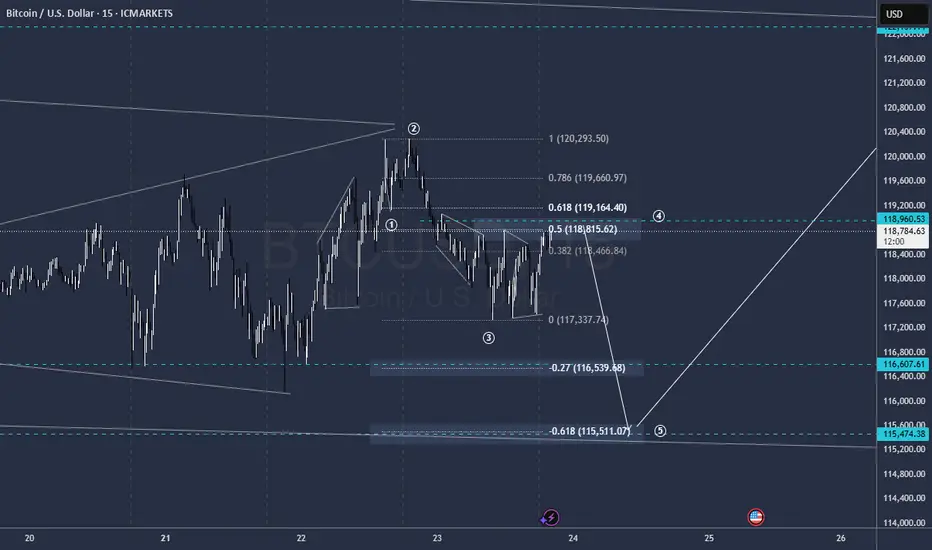
Prior 1H H&S was done, we were watching on 120K resistance area, as we said last time. Now, on 1H chart H&S is showing signs of failure - too extended right arm, no downside breakout. Price is taking the shape of triangle . All these signs are bullish. Because butterflies very often appear on a ruins of H&S, we suggest that this one could be formed here...
The risk level for this scenario is 116K lows - BTC has to stay above it to keep butterfly (and triangle) valid, otherwise, deeper retracement to 112K area could start.
Upside target starts from 123K top and up to 125K butterfly target.
Bullish bounce?The Bitcoin (BTC/USD) is falling toward the pivot and could bounce to the 1st resistance.
Pivot: 111,241.55
1st Support: 98,383.98
1st Resistance: 127,752.45
Risk Warning:
Trading Forex and CFDs carries a high level of risk to your capital and you should only trade with money you can afford to lose. Trading Forex and CFDs may not be suitable for all investors, so please ensure that you fully understand the risks involved and seek independent advice if necessary.
Disclaimer:
The above opinions given constitute general market commentary, and do not constitute the opinion or advice of IC Markets or any form of personal or investment advice.
Any opinions, news, research, analyses, prices, other information, or links to third-party sites contained on this website are provided on an "as-is" basis, are intended only to be informative, is not an advice nor a recommendation, nor research, or a record of our trading prices, or an offer of, or solicitation for a transaction in any financial instrument and thus should not be treated as such. The information provided does not involve any specific investment objectives, financial situation and needs of any specific person who may receive it. Please be aware, that past performance is not a reliable indicator of future performance and/or results. Past Performance or Forward-looking scenarios based upon the reasonable beliefs of the third-party provider are not a guarantee of future performance. Actual results may differ materially from those anticipated in forward-looking or past performance statements. IC Markets makes no representation or warranty and assumes no liability as to the accuracy or completeness of the information provided, nor any loss arising from any investment based on a recommendation, forecast or any information supplied by any third-party.

$BTC NEXT WAVE PROGRAMMED!bitcoin will load the next wave after the accumulation process it is in after the parabolic run
CHECK BTCUSD SIGNAL UPDATE GO AND READ CAPTAINEntry Point: Around 116100 TO 115750
Take Profit 1: 117600
Take Profit 2: 119150
Last Target: 171.200
Stop Loss: 114100

BTC at Multi-Factor Resistance: Wave Count Hints at Downside BTC is looking increasingly bearish as the price has risen to a resistance zone formed by multiple factors: trendlines, the POC (Point of Control), and moving averages.
The wave count also supports this bearish outlook / the bearish case.
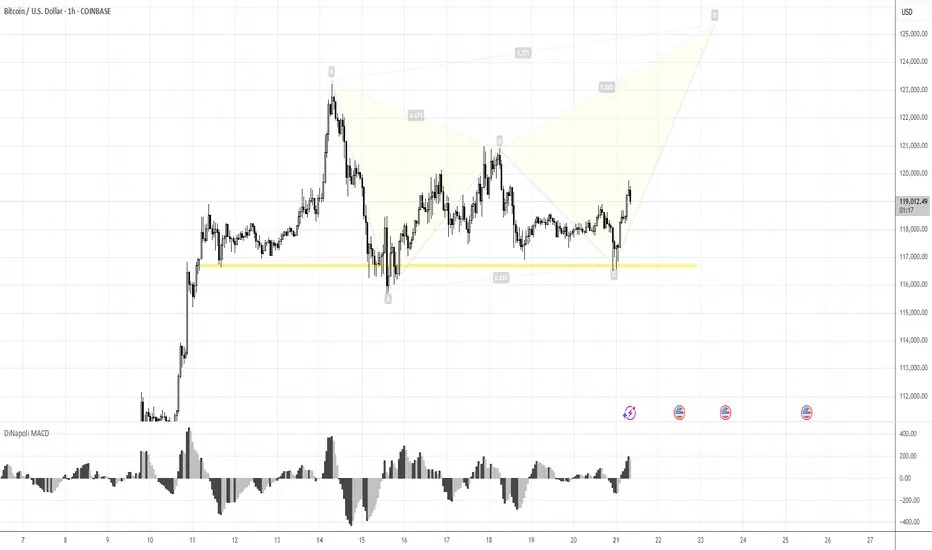
Bitcoin Long: Completion of Sub-wave 4, riding wave 5I updated the Elliott Wave counts for Bitcoin and we should have completed sub-wave 4 and is currently onto sub-wave 5. Based on my counts, sub-wave 3 has extended and is slightly more than 1.618x of wave 1, thus I expect sub-wave 5 to NOT extend. Based on Fibonacci extensions, the price target is around $124,600.
The stop loss for this idea is around $114,600.
Towards to end of the video, I zoomed out for Bitcoin and observed that Cycle level wave 1 and 3 are HUGE (red font) and the current Cycle Wave 5 looks too small. Thus, the entire 5-wave structure of what we are going through now may be just a Sub-Wave 1 of Cycle Wave 5. And that means that longer-term, Bitcoin may really go to $200,000 and beyond. But for traders, keep our foot on the ground and trade what is in front of us.
Good luck!

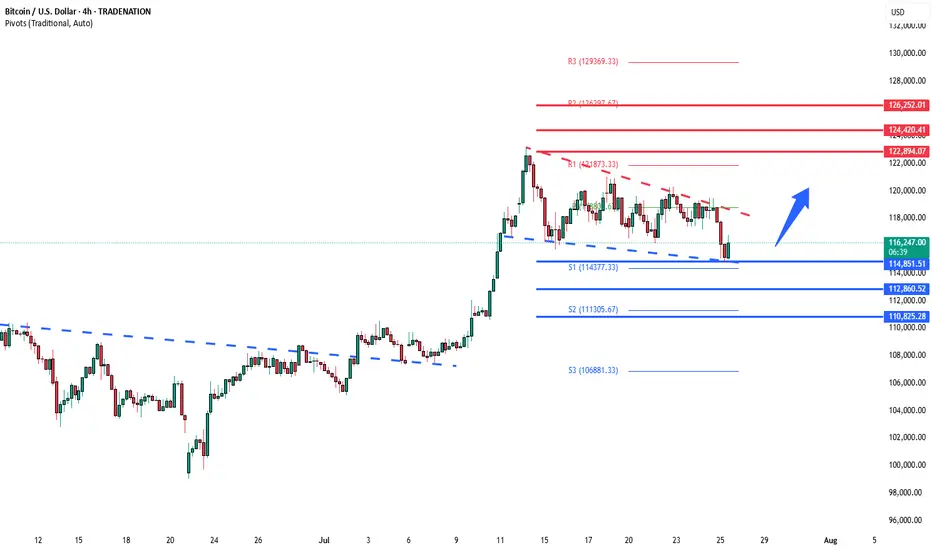
BTCUSD support retest at 114,850 The BTCUSD remains in a bullish trend, with recent price action showing signs of a corrective pullback within the broader uptrend.
Support Zone: 114,850 – a key level from previous consolidation. Price is currently testing or approaching this level.
A bullish rebound from 114,850 would confirm ongoing upside momentum, with potential targets at:
122,900 – initial resistance
124,420 – psychological and structural level
126,250 – extended resistance on the longer-term chart
Bearish Scenario:
A confirmed break and daily close below 114,850 would weaken the bullish outlook and suggest deeper downside risk toward:
112,860 – minor support
110,825 – stronger support and potential demand zone
Outlook:
Bullish bias remains intact while the BTCUSD holds above 114,850. A sustained break below this level could shift momentum to the downside in the short term.
This communication is for informational purposes only and should not be viewed as any form of recommendation as to a particular course of action or as investment advice. It is not intended as an offer or solicitation for the purchase or sale of any financial instrument or as an official confirmation of any transaction. Opinions, estimates and assumptions expressed herein are made as of the date of this communication and are subject to change without notice. This communication has been prepared based upon information, including market prices, data and other information, believed to be reliable; however, Trade Nation does not warrant its completeness or accuracy. All market prices and market data contained in or attached to this communication are indicative and subject to change without notice.
Why Your Chart Might Be Lying to You And (How to Fix It) !Hello Traders 🐺
Ever clicked the “Log” button on your chart and suddenly everything looked different?
Yeah, you’re not alone...
Most traders ignore it.
But understanding the difference between a Linear and Logarithmic chart can literally change how you see price action — especially if you’re into long-term moves or trading volatile markets like crypto.
Let’s break it down real simple 👇
🔹 Linear Chart (a.k.a. the default)
This is what most charts use by default.
It measures price change in absolute terms.
Meaning: the distance from $10 to $20 is exactly the same as from $20 to $30 — because in both cases, price moved $10.
🧠 Sounds fair, right?
Not always. Here's why...
Let’s say a stock goes from $1 to $2 — that’s a 100% gain.
But if it goes from $100 to $101 — that’s just 1%.
✅ Linear Chart – Pros
Simple and easy to read
Good for short-term price action
Better for assets with small price ranges
Familiar to most beginners
❌ Linear Chart – Cons
Misleading in long-term charts
Distorts large percentage moves
Trendlines become unreliable over time
Doesn’t reflect real growth in % terms
🔹 Logarithmic Chart (Log Scale)
This one shows percentage-based price movement.
Now, going from $10 to $20 (100% gain)
and going from $100 to $200 (also 100% gain)
look exactly the same on the chart — which actually makes more sense when analyzing growth.
It’s super useful when:
✅ You’re analyzing big moves over time
✅ You want to draw accurate trendlines in long-term charts
✅ You're dealing with assets that grew 5x, 10x or more
✅ You care about % gains instead of raw price
❌ Log Chart – Cons
Less intuitive for beginners
Not useful for low-volatility assets
Small price moves may look insignificant
here is an example of the same chart but in the Log Scale :
As you can see on the chart above there is huge difference in accuracy when you use Log scale
for the high volatile asset such as BTC specially in the long term movements .
🆚 So, When Should You Use Each One?
Situation Use Linear Use Log
Small price changes ✅ ❌
Day trading / scalping ✅ ❌
Long-term analysis ❌ ✅
Parabolic or exponential moves ❌ ✅
Drawing long trendlines ❌ ✅
Final Thoughts
If your chart looks weird when you zoom out…
If your trendlines don’t quite fit anymore…
Or if you’re analyzing something that went 10x…
🔁 Try switching to Log scale — it might just clean up the noise.
Small toggle. Big difference.
And also remember our golden rule :
🐺 Discipline is rarely enjoyable , but almost always profitable. 🐺
🐺 KIU_COIN 🐺

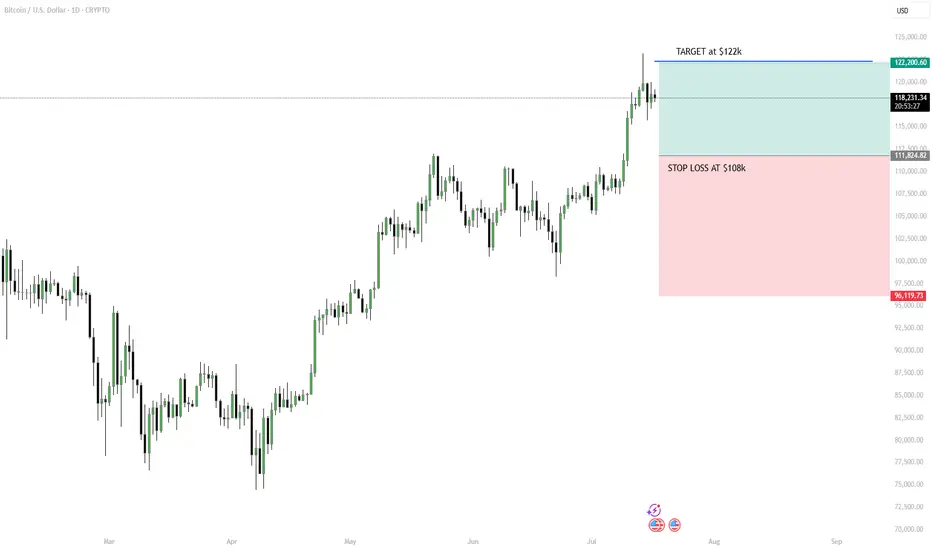
Strategy: “Breakout Bounce” – Buy the Retest, Ride the WaveHello Traders! BTC has broken out above $118K–$120K after a strong uptrend. Now it’s pausing, and a short-term pullback looks likely. Instead of buying the top, we wait for the price to retest previous resistance (around $112K–$114K), which could turn into support.
MY PLAN:
Wait for pullback to $112K–$114K zone.
Look for a bullish candle (daily or 4H) to confirm entry.
Target: $122K short-term or trail stop if trend continues.
Stop loss: Below $108K to manage risk.
Tip: Don’t chase. Be patient, follow the setup, and use proper risk management.
Please leave a comment and don't forget to support a fellow trader! Also, you can leave in the comments your target and plan ideas!
Have a great day y'all!
-Neo
btcusd sl;116.7k
Bitcoin is the first ever cryptocurrency to exist, which was created in 2009 by Satoshi Nakamoto and has since become the most valuable asset on the digital market. It operates without the need for intermediaries, relying solely on cryptography and netw
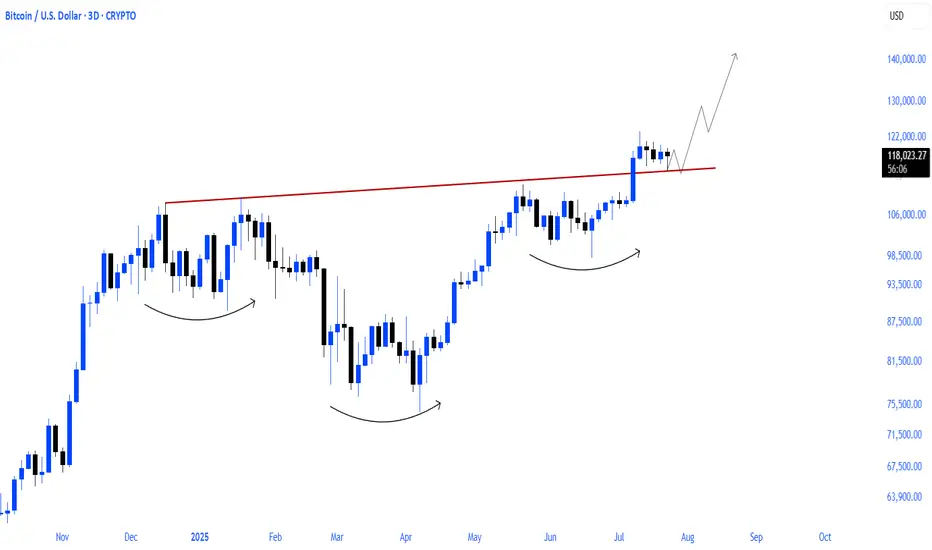
Healthy BTC Retrace in Trend Next Breakout Target 112K Then 122KBitcoin continues to respect the bullish market highlighted in our previous analysis, where the AB=CD structure pointed toward significant upside potential. The market has since retraced into a well defined re-accumulation zone, aligning precisely with prior expectations.
Price has held firmly above the round figure support ($100k), with the current structure confirming a healthy correction within trend.
As long as the re-accumulation zone between 104k–107k holds, momentum remains skewed to the upside. The projected 2.618 extension sits near the 122k mark, where the current setup aims to complete.
The broader structure still respects higher timeframe demand and ascending channel boundaries, keeping bullish continuation valid unless 100k decisively breaks. Watch for confirmation breakout above 112k to activate the next leg of the move.
If you found this analysis insightful, drop a like to support the work and leave a comment with your perspective whether you agree, disagree, or have an alternate scenario in mind. Let's grow together through collective insights.
